OUR ELECTRICITY TRANSMISSION NETWORK: A VISION FOR 2020 - URN 11D/955 - Gov.uk
←
→
Page content transcription
If your browser does not render page correctly, please read the page content below

OUR ELECTRICITY
TRANSMISSION
NETWORK:
A VISION FOR 2020

A Summary of an Updated Report to the Electricity Networks Strategy
Group

February 2012

                                                          URN 11D/955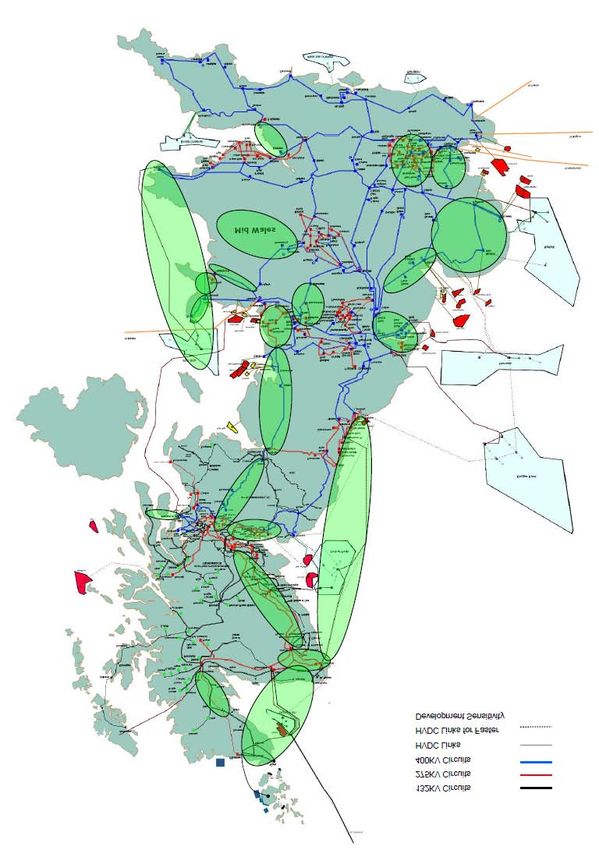
CONTENTS
FOREWORD .............................................................................................................. 2

1 Overview ............................................................................................................... 4

2 Approach to DevelopingScenarios .......................................................................... 9

3 Findings – Power Flows and Existing Transmission Capacity ...................... 12

4 Approach to Determining Network Reinforcement .......................................... 13

5 Potential Transmission Network Reinforcements ............................................ 15

   5.1      Scotland ...................................................................................................... 15
   5.2      Scotland to England .................................................................................... 19
   5.3      North to Midlands and Midlands to South ................................................... 22
   5.4      North Wales ................................................................................................ 23
   5.5      Mid-Wales ................................................................................................... 25
   5.6      South West.................................................................................................. 26
   5.7      English East Coast and East Anglia ............................................................ 28
   5.8      London, Thames Estuary and South Coast ................................................ 30
   5.9      Taking Investment Proposals Forward ........................................................ 32
6 Capital Cost of Potential Transmission Reinforcements................................. 36

Annex A................................................................................................................... 37

   Electricity Networks Strategy Group – Terms of Reference 2011 ......................... 37
Annex B................................................................................................................... 39

   ENSG Working Group Terms of Reference (Extract) ........................................... 39
Annex C................................................................................................................... 41

   Summary of Significant Changes from the 2009 ENSG Report ............................ 41
Annex D................................................................................................................... 43

   Glossary ............................................................................................................... 43

2

FOREWORD
by the Joint Chairs of ENSG

We welcome the 2012 ENSG Report as a valuable contribution to the ongoing discussions
about how to develop our electricity infrastructure in order to address the challenges facing
the sector, namely: the decarbonisation of electricity generation, meeting the Governments’
2020 renewables targets; maintaining security of supply; and managing the costs of the
network.

This Summary of the full ENSG report (“2012 ENSG Report”) sets out an updated high-level
view of how the electricity transmission system might need to be reinforced to facilitate the
achievement of the Government’s 2020 renewables targets. It presents, in one accessible
resource, the updated views of the three onshore electricity Transmission Owners1 , as
developed with input from the Electricity Networks Strategy Group (ENSG) Working Group. It
updates a report published in March 2009 entitled “Our Electricity Transmission Network: A
Vision for 2020” (“2009 ENSG Report”).

The 2012 ENSG Report is part of an ongoing process. In 2008, following the Transmission
Access Review, the Government and Ofgem recognised that the potentially long lead times
for expanding transmission capacity could impact upon meeting the 2020 renewables target.
We therefore asked the Transmission Owners to set out the strategic transmission network
investment that might be required to ensure that sufficient renewable generation could be
accommodated on the network. We also invited the ENSG to provide input to this work. The
subsequent 2009 ENSG Report was welcomed by stakeholders in industry and the wider
community as recognition of the urgency of network investment to help meet the UK’s
energy and climate change goals.

The 2009 ENSG report contained a commitment to ensure that appropriate investment was
taken forward in a timely manner. Since that time, the Transmission Owners have developed
more detailed proposals for certain reinforcements, and have presented some of their
proposals to the appropriate planning authorities. Similarly, proposals have been presented
to Ofgem for decisions on whether that project is justified at the proposed time, and, if so,

1
  National Grid Electricity Transmission (NGET), Scottish Power Transmission (SPT) and Scottish Hydro Electric Transmission
Ltd (SHETL)

3

what the appropriate level of funding should be. Through the Transmission Investment
Incentives framework, Ofgem has approved over £400million of funding since 2009. It is
important to note, however, that neither the 2009 ENSG Report nor the updated 2012 ENSG
Report prejudge future decisions by the Transmission Owners about what projects to
develop, or decisions by planning authorities about whether to grant consents. Nor do the
reports prejudge decisions by Ofgem about whether to grant funding or whether there could
be benefits from a role for third parties in delivering certain projects.

The 2009 ENSG Report also contained a commitment to continue to monitor developments
in generation and the network. At its meeting in February 2011 the ENSG asked the TOs to
undertake updated studies in the light of developments in generation and the network since
the 2009 ENSG Report was published. It also established a Working Group to provide input
into this. The updated studies were drawn upon by the TOs when preparing their Business
Plans for the next transmission price control (RIIO-T1), which includes mechanisms for
funding reinforcements once the need has been established.

We thank all of those who contributed to producing the 2012 ENSG Report. It will serve as
an important input into the future development of the electricity network, and a useful means
of communicating potential network requirements to wider stakeholders. We would welcome
feedback on the usefulness of this summary document and the 2012 ENSG Report,
including content and presentation. Please provide any comments to ensg@decc.gsi.gov.uk

Jonathan Brearley                               Hannah Nixon
Director, Energy Markets and Networks          Acting Senior Partner, Smarter Grids
Department of Energy and Climate Change        and Governance: Transmission
                                               Office of Gas and Electricity Markets
4

         Summary of the Updated Report to the
         Electricity Networks Strategy Group on the
         potential Strategic Reinforcements required to
         Facilitate Connection of New Generation to the
         GB Transmission Networks by 2020

1 Overview
The Electricity Networks Strategy Group (ENSG) is a high level forum, which brings together
key stakeholders in electricity networks that work together to support Government in meeting
the long-term energy challenges of tackling climate change and ensuring secure, clean and
affordable energy.

The Group is jointly chaired by the Department of Energy and Climate Change (DECC) and
Office of Gas and Electricity Markets (Ofgem) and its broad aim is to identify, and co-
ordinate strategy to help address key strategic issues that affect the electricity networks in
the transition to a low-carbon future. The ENSG Terms of Reference and membership are at
Annex A.

This document is a summary of the full report2 (“2012 ENSG Report”) which has been
prepared by the Transmission Owners (TOs) with input from the ENSG Working Group3 to
discharge an action placed on them by the ENSG to provide:

•      An update of the ENSG 2020 vision report incorporating network responses to changes
       to generation scenarios, technologies, policy developments, etc.

This summary of the 2012 ENSG Report provides a high level accessible synopsis of the full
report particularly for those not requiring full technical details. The reinforcements identified
by the TOs are based on the Gone Green 2011 scenario. This scenario, developed by
NGET, and updated annually in consultation with stakeholders, represents a potential

2
    Available at http://www.decc.gov.uk/en/content/cms/meeting_energy/network/ensg/ensg.aspx
3
    Extract from ENSG WG Terms of Reference and membership at Annex B
5

generation and demand background which meets the UK targets of 15% of energy demand
being provided by renewable sources and a 34% reduction in Green House Gas emissions
by 2020. It would also meet the Scottish and Welsh Governments’ 2020 renewable energy
targets i.e. the equivalent of 100% of Scotland's electricity demand should be met from
renewables and 7 TWh per annum of Welsh electricity production by 2020. It takes an
holistic approach to the meeting of the targets i.e. assumes that heat and transport will also
contribute towards meeting the targets. It estimates that in order to meet this target,
approximately 30% of UK’s electricity will have to come from renewable sources by 2020,
with a corresponding 12% from heat and 10% from transport. A previous scenario (Gone
Green 2008) was utilised in the report published in March 2009 entitled “Our Electricity
Transmission Network: A Vision for 2020” (“2009 ENSG Report”) and the Gone Green 2011
scenario takes the same holistic approach to meeting the 2020 environmental targets.

Gone Green takes into account the significant changes anticipated in the generation mix
between now and 2020. Sensitivities have also been applied to the Gone Green 2011
scenario to reflect possible faster or slower deployment of offshore wind on a regional basis.
The scenario and sensitivities particularly examine the potential transmission investments
associated with the connection of large volumes of onshore and offshore wind generation
that are required to meet the 2020 renewables targets and new nuclear generation.

The 2012 ENSG Report concludes that, provided the identified reinforcements are taken
forward on time and the planning consents needed for network development works can be
secured in a timely manner, then the reinforcements identified by the TOs in the report can
be delivered to required timescales.

In the 2012 ENSG Report, the TOs have identified and estimated the regional costs of the
potential transmission reinforcements that may be required to accommodate the connection
of a range of new generation needed to meet the UK’s renewable energy targets whilst, at
the same time, facilitating the connection of other essential new generation that will be
needed to maintain continued security of supply. To ensure that the identified reinforcements
are sufficiently robust, they have been tested against a range of background scenarios,
which take account of likely developments up to the year 2020. The total estimated cost of
the potential reinforcements contained in the 2012 ENSG Report, based on the Gone Green
2011 scenario, is around £8.8bn and the resulting network would be able to accommodate a
further 38.5GW of new generation (a little under half of the current generation), of which
23GW could be a combination of onshore and offshore wind generation. Details of these
potential reinforcements are included in Chapter 5 “Potential transmission network
6

reinforcements”. A summary table of changes to the Gone Green scenario and significant
changes to potential reinforcements since the 2009 ENSG Report is at Annex C.

The increase in estimated costs compared to the 2009 ENSG Report (£4.7bn) is largely due
to the updated report including the costs of possible provision of new subsea links from
Scottish Islands4 to the mainland, the inclusion of further options for reinforcements notably
a possible HVDC subsea link from North to South Wales and a possible third HVDC link
between Scotland and England; and updating the base price. The Scottish Island links were
considered as possibilities in the 2009 ENSG Report, but costs estimates were not available
then. The subsea North to South Wales link has been raised as a possibility since the 2009
ENSG Report (with pre-construction funding approved by Ofgem).

Table 1 provides details of the cost difference totalling around £4bn between the 2009
ENSG Report and the updated report.

Feedback on the 2009 ENSG Report indicated that stakeholders would find the identification
of possible alternative reinforcement options helpful. In drafting the 2012 ENSG Report,
therefore, the TOs have undertaken more analysis to identify possible options for
reinforcements. This is particularly relevant to the Scotland/England border, North Wales,
South West, English East Coast/East Anglia, and London.

Any new transmission infrastructure works would require regulatory and planning approval
which would require a number of actions by TOs including comprehensive routeing and
siting studies, consultations and detailed environmental impact assessment.

4
    Western Isles, Orkney Islands and Shetland Islands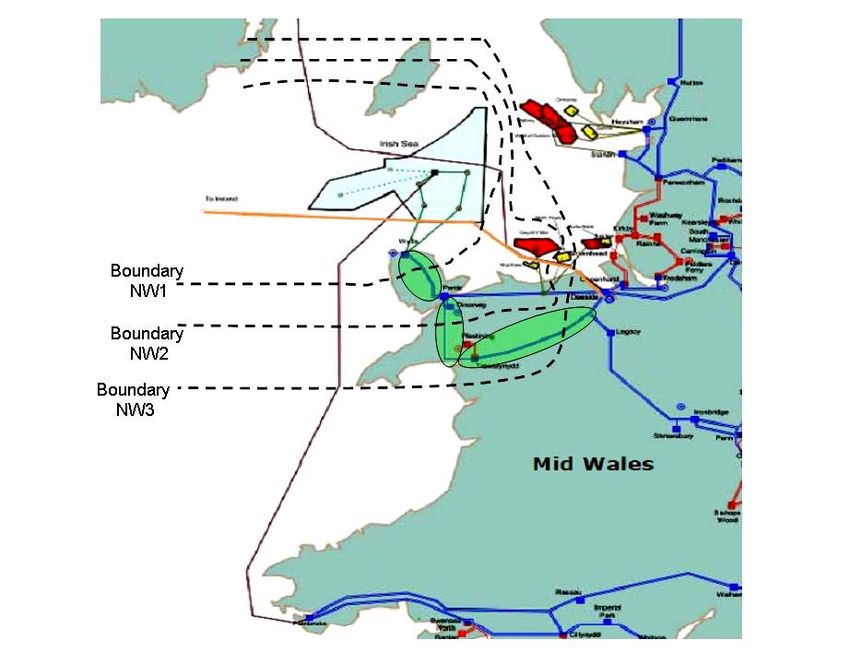
7

                 2009 ENSG
                             2012 ENSG Report Cost
                   Report                             Difference
   Regions                     (2008/09 Price Base)                          Comments
                    Cost                                 (£m)
                                       (£m)
                    (£m)
                                                                   Inclusion of Scottish Island
                                                                   connections

                                                                   The cost of the Western HVDC
                                                                   link, NGET – SHETL East
                                                                   Coast HVDC link 1, Series
  Scotland +
                                                                   Compensation are updated
  Scotland-
                   2715               5740              +3025      since ENSG 2009
   England
   Interface
                                                                   Possible NGET – SPT East
                                                                   Coast HVDC Link and Mersey
                                                                   Ring upgrade. These
                                                                   reinforcements were not
                                                                   considered in the 2009 ENSG
                                                                   Report
                                                                   New updated cost of Wylfa –
 North Wales +                                                     Pentir double circuits
                    575               1260               +685
  Mid-Wales                                                        Inclusion of Irish Sea –
                                                                   Pembroke HVDC Link

                                                                   Updated cost of possible
  South West        340                430               +90
                                                                   reinforcement

                                                                   In the 2009 ENSG Report,
                                                                   onshore HVDC reinforcements
                                                                   were considered in the Humber
                                                                   region. But the 2012 ENSG
 East Coast &                                                      Report considers onshore AC
                    910                750               -160
    Anglia                                                         reinforcements in this region
                                                                   and the cost of the onshore AC
                                                                   reinforcements in less than the
                                                                   cost of the onshore HVDC
                                                                   reinforcements

   London           190                190                0

  Base Price                                                       The base price difference from
                                                         +450
  Difference                                                       2008/09 to 2010/11

    Totals         4730               8820               4090

Table 1: Cost difference between the 2009 and 2012 ENSG Reports

The 2012 ENSG Report focuses on the Main Interconnected Transmission System (MITS)
and Scottish island connections. It does not propose developments in either interconnection
or offshore transmission, which are covered by separate regimes with their own workstreams
and regulation. The report does, however, consider potential interactions between
interconnectors, offshore transmission, and the MITS, and has made certain assumptions
about interconnection and offshore transmission.      For example there are three regions
(Scotland, North Wales, and the East Coast of England) where offshore wind connections
may impact significantly on the MITS by 2020. For the purposes of the 2012 ENSG Report,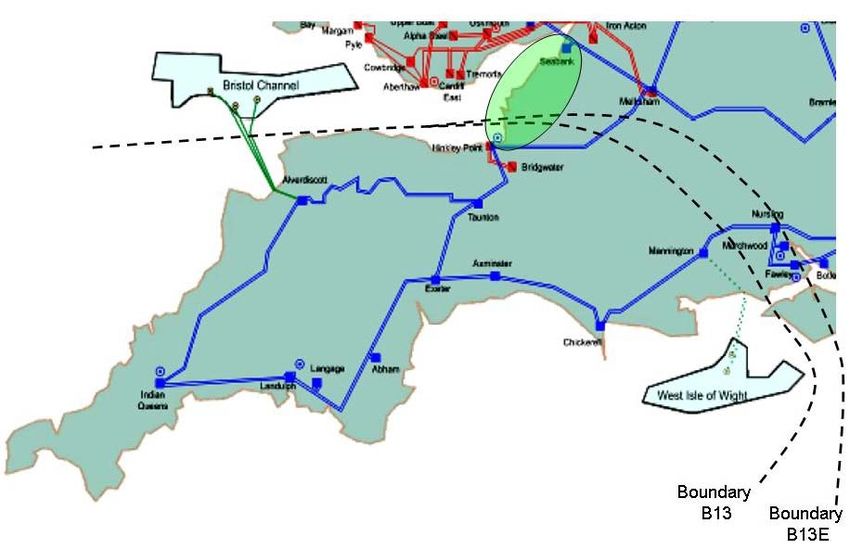
8

therefore, illustrative offshore network designs have been incorporated to assess the
potential impact on the MITS in these regions. These illustrative offshore transmission
system designs do not prejudge the outcome of the offshore transmission coordination
project, nor do they represent any investment decisions and/or contractual arrangements or
programme of the TOs, Offshore Transmission Owners (OFTOs) or third parties; nor do they
imply the actual connection routes for new electricity transmission infrastructure. More
generally, all relevant assumptions would need to be reviewed were the TOs to develop
more detailed plans for reinforcing any particular area of the MITS.

Any transmission system reinforcement (including those identified by the TOs in the 2012
ENSG Report) would only be applied when all other possible network solutions have been
explored and exhausted with the existing assets being fully utilised. Consideration has been
given to employing the latest and possible future technologies, especially where additional
economic and/or additional environmental benefits can be expected. Due account has been
taken of the lead time required to develop robust engineering solutions and the need to
obtain the necessary planning consents for each reinforcement. The TOs will keep these
designs under review and consider suggestions to help ensure the right solution is
developed.

The potential reinforcements are phased to be delivered in line with the prospective growth
of renewable generation in each region. It is recognised that there will continue to be a
degree of uncertainty about the volume and timing of generation growth in any given area.
Developments in the market will continue to be monitored and the scenarios updated
accordingly. Proposals for potential transmission reinforcements would be developed in such
a manner as to ensure that options for future development are maintained at minimum cost.
Undertaking pre-construction engineering work, for example, means that for each project
construction can be commenced when there is sufficient confidence that transmission
system reinforcement will be required. This is a least regret solution, i.e. the minimum
commitment to secure the ability to deliver to required timescales.

9

2 Approach to Developing
            Scenarios
The 2012 ENSG Report takes a similar approach to the 2009 ENSG Report. A number of
electricity generation and demand backgrounds have been developed. In their development,
numerous factors were taken into account; particularly in relation to ensuring that the UK,
Scottish and Welsh Government 2020 targets for renewable energy and the UK target for
Greenhouse Gas emissions5 would be met. Such factors include the analysis of:

•           closures of existing plants due to various legislation and age profile;
•           contracted new connections for all types of plant;
•           the potential for, and location of onshore and offshore wind generation; and
•           the potential build rates for wind and new nuclear generating plant.

In developing a detailed generation background, issues such as: security of supply; the
ability of the supply chain to deliver; and technological advances were taken into
consideration. The potential reinforcement requirements identified in the 2012 ENSG Report
are based on NGET’s Gone Green 2011 scenario which has been developed through
stakeholder engagement from the Gone Green 2008 scenario originally used for the 2009
ENSG Report. As with the Gone Green 2008 scenario, the Gone Green 2011 scenario
assumes that the main generation in 2020 would be from gas and wind, with a greater role
for nuclear and a reduced role for coal. The generation mix connecting to the transmission
network in the Gone Green 2011 scenario for the year 2020 on which the 2012 ENSG
Report is based, is presented in Figure 1.

5
    The UK target for 2020 is a reduction of at least 34% in greenhouse gas emissions compared to 1990.
10
9.33 GW, 9% 12.321 GW, 12%
3.113 GW, 3%
9.147 GW, 9%
14.545 GW, 14%
16.56 GW, 17%
35.507 GW, 36%
Nuclear Coal Gas Offshore Wind Onshore Wind Other Renewables Other
Figure 1: Generation mix in 2020 of the Gone Green 2011 Scenario Generation connected to
Transmission network
In the 2009 ENSG Report sensitivities were applied to the Gone Green 2008 scenario to
accommodate faster or slower development of onshore wind in Scotland. This was achieved
by increasing offshore wind generation in England and Wales to compensate for any
volumes of onshore wind in Scotland less than 11.4GW. For the 2012 ENSG Report
sensitivities are also applied to the Gone Green 2011 scenario to consider the possible
effects of faster or slower development of offshore wind generation in six GB regions. Under
all sensitivities the 2020 renewable energy targets would still met.
The total offshore windfarm capacity connected is assumed to be in the region of 16.6GW by
2020. In considering how this offshore capacity could be achieved, it is assumed that around
8GW of projects in The Crown Estate announcements on offshore wind Rounds1 and 2 and
Round 2 extensions will proceed to completion, with the remainder being made up from The
Crown Estate Round 3 and Scottish Territorial Waters (STW) development sites.
The Gone Green 2011 scenario also assumes 11.2GW of onshore wind generation; 12.3GW
of nuclear generation; and 41.7GW of gas generation.
The significant differences in assumptions between Gone Green 2011 and the Gone Green
2008 used in the 2009 ENSG Report are:
• Increase in nuclear capacity to reflect the existing Advanced Gas-Cooled Reactor
(AGR) stations being assumed to receive ten-year life extensions and two new11
nuclear installations connecting by 2020. This allows for a corresponding decrease in
coal-fired generation and a subsequent decrease in carbon emissions.
• The Gone Green 2011 scenario also meets the UK’s 2020 carbon reduction targets
which have become more stringent since 2009. The carbon emission reduction target
for 2020 in the Gone Green 2011 scenario is at least 34% on 1990 levels whereas it
was previously a 29% reduction for the Gone Green 2008 scenario.
• The exclusion of energy used in the aviation sector from the overall target calculation
which reduces the amount of renewable capacity required to meet the 15% target.
This would also result in a reduction in the overall renewable capacity in the scenario.
This reduction has been applied to wind generation capacity required as it is the main
source of renewable energy.
These differences mean that not as much new generation needs to connect in the Gone
Green 2011 (38.5GW) to meet the 2020 targets compared to Gone Green 2008 (45GW).
Gone Green 2011 has also been compared to the Renewable Energy Roadmap central
range and lies at the upper end of that range for all renewable generation sources.
Not all new generation will connect to the transmission network which is the reason for the
differences between total generation levels in the overall Gone Green 2011 scenario and
those contained in Figure 1. Gone Green 2011 assumes around 14GW of embedded
generation (generation connecting to the distribution network) by 2020. The developments in
the generation market and the progress that Developers have made in obtaining planning
consent and the subsequent build rate will be continued to be monitored and the Gone
Green scenario updated accordingly.
The generation assumptions made for the 2012 ENSG Report are entirely independent from,
and in no way pre-suppose, the outcome of individual planning decisions about projects on
particular sites. For nuclear generation it should also be noted that life extensions are
commercial decisions for operators and are subject to approval from the Office for Nuclear
Regulation (ONR) and the Nuclear Decommissioning Authority (NDA).12 3 Findings – Power Flows and Existing Transmission Capacity As with the 2009 ENSG Report the predominant power flow on the National Electricity System (NETS) will continue to be from North towards the South. In the North of Scotland, generation is assumed to significantly increase with onshore and offshore wind and marine renewables all contributing. The level of demand is not anticipated to increase significantly over the next decade. Accordingly, there is a predominant net export of energy from the region to the Central Belt of Scotland. Additional power flows in the Central Belt of Scotland, within the Scottish Power Transmission (SPT) network, would place a severe strain on the 275kV elements of the network and, in particular, the north to south and east to west power corridors. The circuits between Scotland and England are already operating at their maximum capability. Under all the generation scenarios considered, the transfers from Scotland to England increase significantly. Reinforcements identified to relieve the boundary restrictions across these circuits result in power transfers on the Upper North network of the England and Wales transmission system exceeding network capability. South of the Upper North boundary the increased power flows south from Scotland and North West of England progressively diminish as they are offset by the closure and displacement of existing conventional generation along the way. Accordingly, while there are transmission overloads in northern England the effects are greatly muted as the flows travel towards the Midlands. Offshore wind generation connecting in England and Wales, together with the potential connection of new nuclear power stations raises a number of regional connection issues; particularly in North Wales, South West England and along the English East Coast between the Humber and East Anglia. The anticipated increased power transfers across the North to Midlands boundary and/or the increased generation off the East Coast and/or Thames Estuary would also result in severe overloading of the northern transmission circuits securing London.
13

4Approach to Determining
Network Reinforcement
The range of potential power flows on the NETS has been determined on the basis of the
currently authorised NETS (i.e. the existing NETS together with all the approved
transmission system reinforcements assumed to be in place for the year 2015). Such
authorised transmission reinforcements include:

•           the Beauly – Denny 400kV line,
•           the uprating of the transmission capacity between Scotland & England; and,
•           the additional transmission capacity around North West and North East England.

The 2009 ENSG Report used the existing NETS SQSS6, but predominately focused on the
application of the deterministic rules. A full-cost benefit analysis (CBA) was restricted to
areas where the potential for high constraint cost had previously been identified, mainly the
Scotland-England boundaries.

For the purpose of calculating Required Transfers (RT), the 2012 ENSG Report is based on
the current NETS SQSS (version 2.1). This is consistent with the TOs’ RIIO-T1 Business
Plans submitted to Ofgem on 31 July 2011. However, the analysis is then further
supplemented with the CBA analysis method (as set out in the GSR009 amendment to the
NETS SQSS approved by the Gas and Electricity Markets Authority7 on 1 November 2011)
for the NETS SQSS standards under the economy criterion; whereas the RIIO-T18 Business
Plans include a series of more detailed CBAs to help determine the necessary level of
transmission investment. The Security Model criterion is not used in the analysis for the
2012 ENSG Report.

6
    National Electricity Transmission System Security and Quality of Supply Standards
7
http://www.ofgem.gov.uk/Pages/MoreInformation.aspx?docid=26&refer=Networks/Trans/ElecTransPolicy/SQSS
8
    RIIO is the Transmission Price Control for the period 2013/14-2020/21 for the TOs. This means
Revenue=Incentives+Innovation+Outputs
14 Therefore the actual investment could depart from the results from applying either the rules in the accepted amendments, or the current rules today. However, GSR009 would be expected to provide a better overall view of what the optimum investment is likely to be and give a first-pass deterministic assessment likely to be closer to the right minimum cost answer. By providing a better ‘first estimate’ of the optimal capacity requirements it brings efficiency to the planning process as it provides a better starting point before a more detailed assessment is carried out and this will simplify and streamline the design process. When identifying a shortfall in network capacity, consideration has been given to traditional solutions such as reconductoring circuits, upgrading to a higher voltage and constructing new lines. However, it is recognised that traditional methods of enhancing system capacity, particularly those which involve new overhead line routes, can be difficult to achieve due to planning constraints and environmental concerns. The TOs have therefore investigated the potential for new or previously unused technologies on the NETS in order to either enhance or maximise the use of existing assets or to provide new infrastructure with reduced environmental impact and an acceptable level of technological risk. When considering the use of new technologies that have not previously been used on the NETS it is important to ensure that all issues associated with these systems (technical, commercial and environmental) are fully understood prior to commitment to construct. Discussions have already taken place with manufacturers to assess what technologies could be used in future network developments and what designs represent feasible options considering the required timescales. In many cases using new technologies appears to offer significant benefits over traditional design options. However, when comparing a new, or unused, technology with existing design options it is necessary to quantify any benefits or drawbacks accurately to ensure that the optimum design is selected. There is also a need to look towards “smarter” ways of operating the transmission network to meet the increasing challenge of integrating large amounts of variable renewable generation and the advent of varying demand profiles. This could comprise a number of techniques such as the use of dynamic ratings to enhance the thermal rating of lines; the use of automated and co- ordinated systems such as Quadrature Booster (QB) control; and co-ordinated High Voltage Direct Current (HVDC) control systems which work in parallel with the existing High Voltage Alternating Current (HVAC) networks.
15

5Potential Transmission
Network Reinforcements
5.1    Scotland

The volume of generation in Scottish Hydro Electric Transmission Limited’s (SHETL’s) north
of Scotland area is expected to increase over the coming years due to the growing capacity
of renewable generation such as The Crown Estate Round 3 offshore wind farms, STW wind
farms, marine generation in the Pentland Firth and Orkney waters and numerous onshore
wind farms within Scotland. Under the Gone Green 2011 scenario about 6.3GW of new
generation would be connected by the end of 2020 in SHETL’s area. This includes 3.5GW of
onshore wind, 2.2GW of offshore wind and 0.6GW of marine generation. At present there is
about 0.9GW of onshore wind and no offshore and marine generation connected to the
SHETL system.

The volume of generation in SPT’s central and south of Scotland area is similarly expected
to increase over the coming years due to the growing capacity of onshore wind farms across
the south of Scotland, together with STW wind farms and the Crown Estate Round 3
offshore wind farm in the Firth of Forth. Under the Gone Green 2011 scenario about 3.9GW
of new generation would be connected in the SPT area by the end of 2020. This includes
2.3GW of onshore wind, 1GW offshore wind and 0.6GW of coal generation. Presently about
1.4GW onshore wind is connected to the SPT’s area.

A number of options for reinforcements have been identified by the TOs which would meet
the requirements from the Gone Green 2011 generation scenario for this area. These
reinforcement options (and costs) do not include projects which are currently under
construction; Beauly-Denny, Beauly-Dounreay and Beauly-Kintore are assumed to be in
place from 2015 onwards. A number of other reinforcements have been included which
would address potential regional transmission issues including the links to the main islands
of Western Isles, Orkney and Shetland.
16

•   Caithness-Moray-Shetland (CMS) 600MW HVDC Link from Caithness to Moray
    Coast via Moray Firth Offshore hub and associated reinforcements to accommodate
    existing and planned onshore and offshore renewable generation in Caithness, in the
    Moray Firth, and on Orkney and Shetland. The earliest possible completion date of
    this reinforcement is 2016.

•   East Coast AC 400kV Upgrade to address capacity requirements on the east side
    of SHETL’s area to enable the export of renewable energy from the north of Scotland
    to the demand centres in the south. The earliest possible completion date of this
    reinforcement is 2016.

•   East Coast Subsea HVDC Link from Peterhead in the north of Scotland to north of
    England to provide a significant increase in north to south transfer capacity. Should
    there be more renewable generation connections in the north of Scotland, a second
    East Coast HVDC Link could be required to provide further capacity. The earliest
    possible completion date of this reinforcement is 2018.

•   Kintyre to Hunterston AC Subsea Link could provide the necessary capacity to
    accommodate the renewable generation in the Kintyre and Argyll area. The earliest
    possible completion date of this reinforcement is 2015.

•   Orkney and Pentland Firth Subsea Link An initial 132kV subsea link between the
    west Orkney mainland and Caithness would be required to accommodate the first
    tranches of marine sites, together with developing onshore renewables. As further
    marine generation deploys there is expected to be a requirement for an HVDC link of
    greater capacity around 2019-2021, with a delivery point on the Scottish mainland,
    linked to a main HVDC hub at Peterhead. The earliest possible completion date of
    this 132kV subsea link is 2015.

•   Western Isles 450MW HVDC Link to accommodate potential increased wind
    generation in the Western Isles. The earliest possible completion date of this
    reinforcement is 2015.

•   Shetland Islands HVDC Link to connect onshore wind from Shetland Islands to
    Moray Firth offshore hub. The earliest possible completion date of this reinforcement
    is 2017.
17
• further Caithness reinforcement to integrate the Caithness AC system with the
Sinclairs Bay HVDC hub. The earliest possible completion date of this reinforcement
is assumed be beyond 2020.
• Beauly to Blackhillock Reinforcement it is possible that further high capacity
reinforcement between Beauly and Blackhillock may be required in the future. There
are a number of options being considered to provide this capacity. The earliest
possible completion date of this reinforcement is also assumed be beyond 2020.
• Central 400kV Upgrade (Denny – Wishaw) to meet increased transfer requirement
from SHETL to SPTL areas. The earliest possible completion date of this
reinforcement is 2017.
• SPT East Coast 400kV Upgrade (Kincardine – Harburn) to meet increased transfer
requirement from SHETL area. The earliest possible completion date of this
reinforcement is 2017
Figure 2 shows how the SHETL transmission system might look with the potential
reinforcements.18
Reinforced SHETL Transmission System
HVDC Link to
Shetland
ORKNEY
North West Orkney
Kirkwall
South Ronaldsay
B0
Gills Bay B0
Thurso
Dounreay Potential reinforcement
between Beauly and
WESTERN Spittal Blackhillock
ISLES
Mybster
Stornoway Cassley B1
Dunbeath Moray Offshore
Grabhair Lairg HVDC Hub
Brora
Shin Loch
Buidhe
Grudie Bridge
Fyrish Alness Fraserburgh
Mossford Elgin Macduff
Corriemoillie
Nairn
Keith
Afric
Inverness
Beauly Knocknagael Blackhillock Peterhead
Rothienorman
Skye
Kintore
Boat of Garten
Foyers
ABERDEEN
F. Augustus Tarland
Fort B2
Coll Errochty
William
Alyth
Tiree Tealing
Mull Dalmally
Cruachan DUNDEE
Oban Killin
Inverarnan
Inveraray PERTH B4
Braco
Sloy
B1
Port Ann
Jura
B2 HVDC Link to
Dunoon Denny North of England
Windyhill
Crossaig
Islay Hunterston
Carradale
Key
400kV
B3 Campbeltown 275kV
220kV
132kV
HVDC
B3
B4
Figure 2: The north of Scotland transmission network showing potential reinforcements in 2020
Figure 3 shows how the SPT transmission system might look with the potential
reinforcements.19 Figure 3: The SPT transmission system showing potential reinforcements Cost The total estimated cost of the possible set of reinforcements considered for Scotland is around £2.5bn for the Gone Green 2011 scenario. These costs exclude reinforcements shared from Scotland to England and Wales which are covered in the next section. Estimated costs for individual projects in all regions cannot generally be provided in the 2012 ENSG Report for commercial, procurement and legal reasons. 5.2 Scotland to England In addition to facilitating the transfer of flows from North Scotland this area would also have 1.1GW of new generation connected under the Gone Green 2011 scenario. This includes
20

about 0.8GW of offshore wind and about 0.3GW of biomass generation. There is no offshore
wind generation connected to the area at present. The capability of the Boundary B6
connecting the SPT and NGET networks is currently limited to 2.2GW by stability
restrictions. Reinforcements to this boundary are due to complete in 2012/13, resulting in an
export capability from Scotland to England and Wales of around 3.3GW. Further south
Boundary B7 currently has a capability of around 3.6GW and Boundary B7a has a capability
of 5.4GW. All of these other Scotland-England boundaries would become more constrained
as power flow increase from Scotland, thus potentially requiring numerous reinforcements. In
addition Boundary B7a also has potentially more generation to accommodate. The principal
means of accommodating potentially significantly increased power flows would be through a
Western HVDC link and East Coast HVDC Link. However, there are other potential
reinforcement options that would add further capacity.

Incremental Reinforcement

Upgrades to the onshore transmission system will maximise the capability of the Scotland-
England interconnection and enable the firm 4.4GW thermal capability of the existing
overhead line routes to be utilised. These works will involve the installation of series and
shunt compensation at a number of sites in southern Scotland and the north of England,
together with the uprating of some circuits from 275kV to 400kV operation and
reconductoring the overhead lines. The earliest possible completion date of these
reinforcements is 2015.

Western HVDC Link

The project constructs a new HVDC link between Hunterston substation in central Scotland
and Connah’s Quay substation in North Wales. The connection will be via an undersea cable
sited along the west coast of Great Britain. The project has already been allocated some
funding by Ofgem for preconstruction works and further funding has been requested. The
Western HVDC link will provide an increase in capacity of around 2.1GW to each of the
three Scotland-England boundaries. The total capital cost for the HVDC link is estimated to
be around £1bn as indicted in Ofgem’s Transmission Investment Incentives (TII) regarding
the Western HVDC link9. The earliest possible completion date of the western HVDC Link is
2015.

9
http://www.ofgem.gov.uk/Pages/MoreInformation.aspx?docid=20&refer=Networks/Trans/ElecTransPolicy/CriticalInvestments/I
nvestmentIncentives
21

East Coast Subsea HVDC Link

The Western HVDC link would provide sufficient transmission capacity until 2019 for
Boundary B7 and until 2018 for Boundary B7a under the Gone Green 2011 scenario, after
this point further reinforcement would be required. The NGET-SHETL East Coast HVDC link
option would provide an additional 2.1GW of boundary capability to B6 boundary. Although
the East Coast HVDC link would not cross the B7 and B7a boundaries, the improved load
sharing that the link can provide would result in an increase in boundary capability, however
this will not be the full 2.1GW as seen with the B4 and B6 boundaries. This total capital cost
of the HVDC link is estimated to be circa £1.2bn10. The earliest possible completion date of
the East Coast Subsea HVDC Link is 2018.

In addition there may be the potential option of offshore HVDC links to connect Round 3
offshore windfarms from Dogger Bank to the main AC transmission system. This approach
could also provide an increase in boundary capability to the B7 and B7a boundary.

Reconductor Harker-Hutton-Quernmore

This reinforcement would provide sufficient transmission capability until 2016 for Boundary
B7. This reinforcement would increase the post-fault winter capability of existing Harker-
Hutton-Quernmore circuits from 1390MVA to 3100MVA per circuit. Thus the improvement in
boundary capability is 1.4GW following this reinforcement. The earliest possible completion
date of this reinforcement is assumed to be in 2014.

Mersey Ring

These investments provide for the voltage upgrade of the 275kV double circuit from
Penwortham Substation through Washway Farm Substation to Kirkby Substation to 400kV
operation and the associated substation works at Penwortham, Washway Farm and Kirkby.
This Voltage Uprate would be required to restore compliance with the NETS SQSS following
the potential connection of several offshore wind farm projects, Combined Cycle Gas
Turbine (CCGT) Plant and also to allow increased electricity exports from Scotland. The
earliest possible completion date of the Mersey ring uprate is 2018.

10
   The cost is for indicative purpose only as the project is in its early stages of development. The uncertainty surrounding this
project is high covering a number of aspects such as final routing, technology, commodity prices, and markets.
22

Only the major reinforcement options are presented in this summary report. There are a
number of other reinforcement options which are included in the 2012 ENSG Report.

Figure 4 shows how the Scotland-England transmission network might look in 2020 with the
potential reinforcements.

Figure 4 – Map of Scotland-England transmission circuits with possible location of reinforcements

Cost
The estimated cost of the possible set of reinforcements considered for boundary B6, B7
and B7a is around £3.5bn for the Gone Green 2011 scenario.

5.3     North to Midlands and Midlands to South

The capability of this region is sensitive to the changing generation backgrounds and is
restricted by voltage limitations which vary throughout the year. The expected closure of
existing CCGT generation plants under the Gone Green 2011 scenario on both sides of
boundary B8 and B9 causes voltage depression around the boundaries. The Wylfa –
Pembroke HVDC link indentified in the North Wales region would provide additional thermal
and voltage boundary capability to these boundaries. Alternatively voltage issues within
Boundaries B8 and B9 can be solved by providing additional reactive power support.
23

Potential reinforcement options are shown in Figure 5.

Figure 5 –Map of North to Midlands and Midlands to South boundaries with possible location of
reinforcements

Cost
The estimated cost of the possible set of reinforcements considered for boundary B8 and B9
has been covered in the sections on North Wales and East Coast regions.

5.4    North Wales

A net increase of 2.8GW of generation is assumed to connect under the Gone Green 2011
scenario in the North Wales area by 2020. This includes a new nuclear power, Round 2 and
Round 3 offshore wind, and an interconnector link to Ireland which is expected to complete
before 2012/13. At present there is just under 1GW of nuclear generation, 2.1GW of thermal,
2GW of pumped storage generations connected to the North Wales transmission system.

Under the Gone Green 2011 scenario when the Round 3 Irish Sea windfarms and nuclear
generation start to significantly impact on the boundary further reinforcement would be
required in the form of:

   •   Two new transmission lines between Wylfa and Pentir.
   •   Installation of a second circuit between Pentir and Trawsfynydd.
24

The earliest possible completion dates of these reinforcements are 2018 and 2016
respectively.

A Wylfa - Pembroke HVDC link could also be required under the Gone Green 2011 Scenario
as early as 2020. This reinforcement would be further justified if all the units of Wylfa C
nuclear are operating at full capacity

Other onshore reinforcement which could be required:

   •   Reconductoring of the Trawsfynydd to Treuddyn Tee circuits.

The earliest possible completion dates of the Wylfa – Pembroke HVDC link and Trawsfynydd
– Treuddyn Tee reconductoring are 2017 and 2014 respectively.

In addition an offshore co-ordinated network design option has been developed to
accommodate 2GW of wind assumed by 2020 under Gone Green 2011 Scenario and could
be expanded to a maximum zonal capacity of 4.2GW for the full Round 3 Irish Sea wind
capacity. This design option would coordinate interconnection between the offshore
platforms and the onshore transmission which could potentially reduce the number of
connections to shore the cost of the connections and possibly provide circuit diversity to the
offshore generation. These potential benefits would be dependent upon assumptions made
for example on timing and scale of generation.
25

Figure 6 shows potential transmission network reinforcements in North Wales by 2020

   Figure 6: North Wales’ transmission system with potential reinforcement options

Cost
The estimated cost of the possible set of reinforcements considered for North Wales is
£1.12bn for the baseline Gone Green 2011 scenario.

5.5    Mid-Wales
Under the Gone Green 2011 scenario 360MW of onshore wind would connect to
transmission system and 400MW to the Scottish Power Manweb distribution network. The
capacity of the distribution network in the area is not sufficient to accommodate this
generation unless transmission infrastructure is established in Mid-Wales. In order to
provide a connection for the wind generation the following reinforcements have been
considered. The earliest anticipated completion date of these reinforcements is 2016.

   •   Mid-Wales Substation

   •   Construction of a new 400kV double circuit from Mid-Wales to Legacy – Shrewsbury
       - Ironbridge circuits
26
• Establish a new single switch 400kV mesh substation at Shrewsbury and reconfigure
the existing tee transformer arrangement such that it connects into the mesh
substation.
The dates for the completion of these works are aligned with the generators’ expected
connection dates and are subject to the consenting and regulatory approvals process.
The first phase of public consultation was completed in June 2011, and the full set of need
case, strategic optioneering and consultation reports can be found on the National Grid
website11. The other projects noted will also be subject to the Infrastructure Planning
Commission (IPC) process with a need case and strategic option document being produced.
Figure 7 shows an indication of the area within the Mid-Wales region where reinforcements
may be required.
Figure 7: Map of Mid-Wales region with an indication of possible reinforcements
Cost
The cost of the reinforcements in the 2011 Gone Green scenario is estimated to be around
£200m for this area.
5.6 South West
Under the Gone Green 2011 scenario 2.8GW of new generation is forecast to connect in the
area up to 2020. The new generation comprises offshore wind, nuclear and a small amount
11
http://www.nationalgrid.com/uk/Electricity/MajorProjects/MidWalesConnection/27
of marine. Under this scenario, there is about 2.2GW of generation comprising nuclear and
gas currently connected to the South West region.
A number of reinforcement options could be applied to accommodate this new generation.
Only one of these options would be required to achieve compliance with NETS SQSS and it
would be subject to the consenting and regulatory approvals processes.
.
• Hinkley Point- Bridgwater – Seabank 400kV AC Transmission Circuit
• Hinkley-Alternative Destinations 400kV AC Transmission Circuit
• HVAC subsea cable Hinkley Point-Seabank
• HVAC subsea cable Hinkley Point-Aberthaw
• HVDC cable Hinkley Point -Seabank
• HVDC cable Hinkley Point –Aberthaw
NGET announced, on 29th September 2011 following two years of extensive public
consultation, its preferred route corridor for the Hinkley Point C connection. This route option
mostly follows the existing 132kV distribution network which runs from Bridgwater to
Seabank and will involve uprating this corridor to 400kV operation (corresponding to one of
the route options under SW-R02). Technology options have not been decided at the time of
writing. Further information can be found on the dedicated Hinkley Point C connection
website12.
The earliest possible completion dates of the first two and remaining four reinforcement
options are 2019 and 2017 respectively.
Figure 8 highlights the area within this region where potential reinforcements would be
required.
12
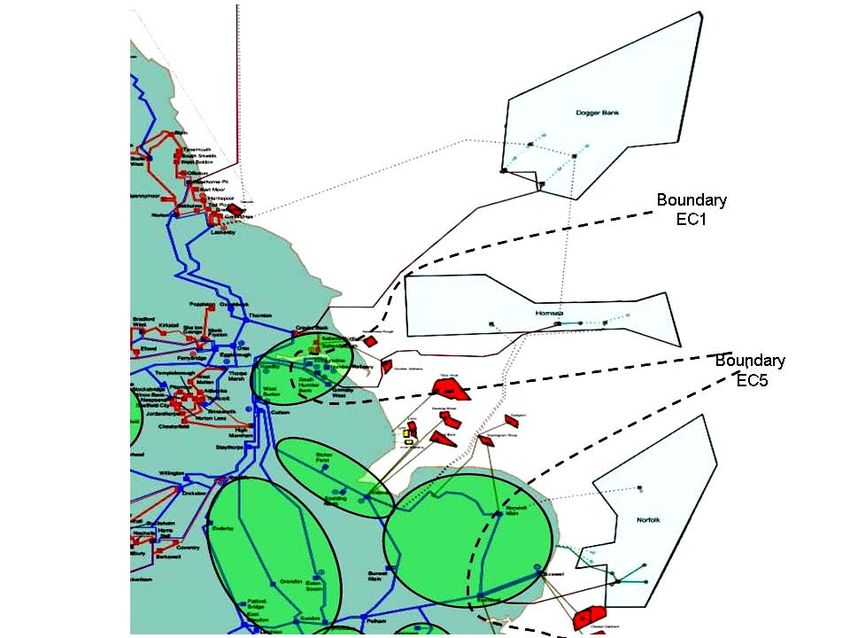
http://www.nationalgrid.com/uk/electricity/MajorProjects/HinkleyConnection28 Figure 8: Map of South West transmission network with possible location of reinforcements Cost The total estimated cost of the possible reinforcement considered for this area under the 2011 Gone Green scenario is £450m. 5.7 English East Coast and East Anglia The volume of generation off the East Coast is assumed to increase significantly over the study period under the Gone Green 2011 scenario. The East Coast has been extremely active in terms of proposed generation connections, with the three largest potential offshore wind developments (Dogger Bank, Hornsea and East Anglia, potentially amounting to around 25GW) all seeking to connect (at least in part) into this area. By 2020 the Gone Green 2011 scenario shows just under 6GW of offshore wind connecting in this region. In addition, there are a number of other, smaller, offshore wind developments, proposed new gas-fired generation and potential nuclear power stations. There is about 8.4GW generation currently connected within the region. This includes just over 7GW of gas and over 1GW of nuclear generation. Given the high levels of potential generation and uncertainties about timing of connections and eventual scale of generation, a large number (21) of possible reinforcement options (onshore and offshore) have been identified for the East Coast & East Anglia region that could enable the transmission system to meet the required power transfer levels. 17 of these possible reinforcement options did not appear in the 2009 ENSG Report.
29

The potential onshore reinforcements with their earliest possible completion dates are:

       •    Norwich - Sizewell turn-in at Bramford & reconductoring (2015)

       •    Extend Bramford Substation (2015)

       •    Bramford – Twinstead two new circuits (2018)

       •    Braintree – Rayleigh reconductoring (2015)

       •    Rayleigh - Coryton – Tilbury reconductoring (2015)

       •    Killingholme South Substation and new Double Circuit to West Burton (2018)

       •    Grimsby West - South Humber Bank new double circuit (2018)

       •    South Humber Bank – Killingholme new double circuit (2018)

       •    Humber circuits reconductoring (2015)

       •    Walpole QBs (2015)

       •    Elstree - Waltham Cross – Tilbury uprating, reconductoring and QBs (2019)

       •    Barking – Lakeside uprating (2015)

       •    Kemsley - Littlebrook – Rowdown reconductoring (2015)

       •    Rayleigh Reactor installing reactor (2014)

       •    Tilbury - Kingsnorth - Northfleet East reconductoring (2015)

4 potential offshore reinforcements would connect Hornsea, and Dogger Bank offshore wind
farms to each other and to connection points on the East Coast and East Anglia
(Killingholme South, Creyke Beck and Walpole). A further 2 potential offshore
reinforcements would connect Norfolk offshore wind farm to Bramford and Norwich Main. All
of these reinforcements have the potential to provide additional security to the onshore and
offshore networks. Fuller details are in the 2012 ENSG Report.

The Bramford – Twinstead two new circuits have been in public consultation since October
2009, and the full set of need case, strategic optioneering and consultation reports can be
found on the National Grid website13. The other projects noted will also be subject to the
IPC process with need case and strategic option documentation being produced.

13
     http://www.nationalgrid.com/uk/Electricity/MajorProjects/BramfordTwinstead/
30 Figure 9 gives an indication of the possible transmission network reinforcements. Figure 9: Map of the East Coast and East Anglia transmission network with possible location of reinforcements Cost The cost of reinforcing this region for the Gone Green 2011 base scenario is estimated to be around £790m. 5.8 London, Thames Estuary and South Coast London is the largest demand centre in the UK and a large proportion of electricity generated nationally flows into the city from the adjacent regions. Regionally the only significant generation is focused in the lower Thames Estuary where there are large coal, oil and gas- fired stations generation support is provided by units further away, such as the nuclear power stations to the East of London. Demand can also be met through the existing interconnectors to France and the Netherlands. Consequently, the demand in London is predominantly met by transmission connections from remote generation sources. The area
31

is particularly sensitive to changes from the existing interconnectors to Europe. The
commissioning of the Belgium-England interconnector (NEMO) coupled with the existing
interconnectors to mainland Europe could potentially swing flows from 5GW import to 5GW
export depending upon market conditions and generation/demand balance in the UK and
Europe.

The potential reinforcement options to accommodate potential changes with their earliest
possible completion dates are:

   •   Uprate and reconductor the Hackney - Brimsdown - Waltham Cross double circuit
       which bypasses Tottenham substation (2015)

   •   Reconductor the Pelham – Rye House circuits (2015)

   •   St. John’s Wood – Elstree – Sundon reinforcement (2018)

   •   Uprating the 275KV overhead line route connecting substations at West Weybridge,
       Chessington and Beddington to 400kV (2018)

The Waltham Cross to Hackney reinforcement is currently the subject of public consultation,
and the full set of need case, strategic optioneering and consultation reports can be found
on the National Grid website. The other projects noted will also be subject to the IPC
process with a need case and strategic option document being produced.

The final two options listed above did not appear in the 2009 ENSG Report.
32 Figure 10 shows possible transmission network reinforcements for this region. Figure 10: Map of London transmission network with location of possible reinforcements Cost The total estimated cost of the potential reinforcement options for this region under the 2011 Gone Green scenario is £200m under interconnector importing conditions and could rise up to £415m under exporting conditions. 5.9 Taking Investment Proposals Forward A wide range of potential reinforcements have been identified by the TOs to achieve compliance against the generation background and sensitivities. The future possible reinforcements listed in the 2012 ENSG Report are only options identified by the TOs at this stage. Any network reinforcements at and above 132kV would be (or are already being) consulted on. This includes pre-application consultation and examination under the Planning Act 2008 in England & Wales (except for associated development, including substations in Wales which require local authority and Welsh Assembly approval) and under the Electricity Act 1989 for electricity networks and in Scotland under the Scottish Planning regime.
33

The constrained areas of the network which may require reinforcing have been classified as
very strong need case and strong need case.

Very Strong Need Case areas are defined as existing or possible areas in the near future
(up to 2015) of the transmission network where there is significant and uneconomical
constraints, or where the likelihood of these constraints (or technical limitation) in the earlier
years are high. It is also characterised by conditions affecting the area such as generation
background or new reinforcements that are fairly certain. One example of such an area is
the Scotland-England circuits which currently have derogations against the NETS SQSS in
place.

Strong Need Case areas are defined as areas where the likelihood of significant network
constraint is lower than in Very Strong Need Case areas and depend on assumptions about
the generation and network conditions which are less certain and further out into the future
(beyond 2015).

Figures 11 and 12 show the NETS with high level potential need case for reinforcements
contained in the 2012 ENSG Report and the potential reinforcements respectively.
You can also read