Can Fishing Tourism Contribute to Conservation and Sustainability via Ecotourism? A Case Study of the Fishery for Giant African Threadfin ...
←
→
Page content transcription
If your browser does not render page correctly, please read the page content below
sustainability

Article
Can Fishing Tourism Contribute to Conservation and
Sustainability via Ecotourism? A Case Study of the
Fishery for Giant African Threadfin Polydactylus
quadrifilis on the Kwanza Estuary, Angola
Edward C. Butler 1, * , Amber-Robyn Childs 1 , Andrea Saayman 2               and Warren M. Potts 1
 1    Department of Ichthyology and Fisheries Science, Rhodes University, Grahamstown, Eastern Cape 6139,
      South Africa; a.childs@ru.ac.za (A.-R.C.); w.potts@ru.ac.za (W.M.P.)
 2    School of Economics, North-West University, Potchefstroom, North-West 2520, South Africa;
      andrea.saayman@nwu.ac.za
 *    Correspondence: ed.butler.fish@gmail.com

 Received: 20 March 2020; Accepted: 27 April 2020; Published: 21 May 2020

 Abstract: It has been suggested that tourism fisheries can raise the value of landed catch,
 provide alternative livelihoods for local artisanal fishers and, because recreationally caught fishes are
 often released, simultaneously conserve stocks. However, for fishing tourism to meet ecotourism
 standards, sustainable, local economic benefit is imperative. This study aimed to assess the direct
 economic contribution of the recreational fishery for Polydactylus quadrifilis on the Kwanza Estuary,
 Angola. The recreational fishery contributed significantly to economic productivity in an otherwise
 rural area, generating a total revenue (TR) of $236,826 per four-month fishing season. Based on TR,
 P. quadrifilis was 3.6–32.6 times more valuable than the same fish caught and sold in the artisanal sector.
 However, high rates of economic leakage (86.1% of local TR) reduced the value of recreationally
 caught fish to below that of artisanally caught fish. Important sources of economic leakage were via
 the non-local sourcing of lodge supplies, services and staff and through the repatriation of profits.
 Capacity building within the local community is suggested to reduce leakages and to create ‘linkages’
 with the recreational fishery. Greater community involvement, including the provision of business
 shares and greater communication and control, is suggested to achieve sustainability and incentivise
 the protection of recreationally important fishery species.

 Keywords: tourism fisheries; ecotourism; economics; social–ecological systems (SESs); fisheries
 management; livelihoods; recreational-to-commercial ratio (RCR)

1. Introduction
     Globally, recreational fisheries have been identified as significant contributors towards national
economies [1,2]. However, much of the research within this field has taken place in the developed
world, where there are high rates of participation and a lower reliance on fish stocks for food [3].
Recreational fisheries in the developing world are, on average, less well developed and therefore
receive less scientific attention [4,5]. Here, fisheries research has traditionally focussed on small-scale
artisanal sectors [3,6], due to their potential for poverty alleviation [7], and large industrialised fisheries,
based on their economic importance. Therefore, the recreational fisheries of much of the developing
world are not well understood, with many countries disregarding their impact, both economically and
environmentally [5].
     Recreational fisheries are characterised by heterogeneous human–nature relationships, and a
social–ecological system (SES) approach has been advocated to fully appreciate their complexity [8].

Sustainability 2020, 12, 4221; doi:10.3390/su12104221                        www.mdpi.com/journal/sustainability
Sustainability 2020, 12, 4221 2 of 23
Traditionally, systems of natural resource, such as forestry or fisheries, have been analysed with
oversimplified theoretical models that have not taken all aspects into account [8–10]. Therefore,
complexity theory and adaptive SES science is now receiving attention as a more holistic approach
towards natural resource management [9]. If we are to improve our understanding of recreational
fisheries in the developing world, it is critical that we apply an SES approach to our investigations [5].
In terms of Africa, the majority of recreational fisheries work has focussed separately on the biological
traits of the angling species [11,12] or on the traits of the user groups [13–15]. These studies have
largely taken place in southern Africa with little to no formal information available for the West African
region, despite increased evidence of the importance of foreign recreational fishing tourism there [4,7].
It has been widely suggested that recreational fisheries (including those in West Africa—[7])
have the potential to increase the value of fish catches based on the high ‘willingness to pay’ for
recreational fishing [16]. Additionally, recreational fisheries often maintain a non-consumptive or
‘reduced-impact’ use of fisheries resources, through catch-and-release (C&R) angling, and therefore a
number of authors have identified recreational angling as a potential vector for ecotourism [16–18]
and conservation [19,20]. However, it has also been acknowledged that many integrated conservation
and development projects that utilise ecotourism as a strategy have been prone to failure in the
medium to long term [16,21,22]. This is largely because projects are often theorised to be ecotourism
ventures (i.e., the concept works on paper) but are not adequately understood or tested from a practical
standpoint. This is because researchers have largely failed to appreciate that ecotourism acts within
complex SESs. Thus, recreational fisheries should be understood and managed according to their
unique social and ecological traits if they are to achieve ecotourism goals, such as the provision of
sustainable local employment opportunities, the empowerment of local communities, the provision of
high-quality tourism activities and the conservation of natural resources [16,23].
Ecotourism is increasingly popular in the developing world based on the remoteness of the
locations and the perception that they harbour ‘unspoilt’ environments [16]. In many cases, ecotourism
has created incentives for national governments to protect and expand wildlife areas where they
contribute towards local economic productivity [24]. Similarly, as West African recreational fisheries
are increasing in popularity with foreign fishermen due to their remote location, new and attractive
angling species and the perceived pristine state of their stocks [7,13], they present an opportunity to
contribute to local economic productivity. Unlike harvest fisheries, foreign West African recreational
fisheries are often non-consumptive [7]. Therefore, it is possible that their development may incentivise
the protection of recreationally important species, with knock-on effects via the protection of associated
ecosystems and thereby non-target species. This has been the case in the developed world. For example,
in Florida, USA, the strict management and protection of Atlantic tarpon (Megalops atlanticus), bonefish
(Albula vulpes) and important associated ecosystems has been driven largely through the recreational
value of the species [25,26]. Additionally, recreational fisheries have the potential to contribute towards
human welfare and provide a source of income and livelihoods for local communities [13,16,17,27].
If such benefits are available to consumptive fishery stakeholders, such as artisanal fishermen, they will
be more likely to protect the species or habitats that are important to the recreational fishery.
Ecotourism ventures are, however, complicated endeavours and require the commitment and
cohesion of numerous stakeholders [17,21]. Similarly, for recreational fisheries to operate as ecotourism
ventures, it is critical that there is local participation and that all user groups are committed to,
and benefit from, the process. In West Africa, fisheries have diverse user groups and there is a critical
reliance on artisanal fisheries for livelihoods and food security [28]. The development of recreational
fisheries in these areas is likely to place additional pressure on local ecosystems [29] and may result
in conflict between user groups [30,31]. Therefore, it is necessary to understand the ways in which
recreational fisheries are able to generate sources of income and livelihoods for local communities
whilst promoting sustainability and conservation [5]. It is suggested that an investigatory approach
that views recreational fishing as a tourism activity and views fishermen as ‘tourists’ may be able toSustainability 2020, 12, 4221 3 of 23
harness new methodologies and the wealth of knowledge that is available within tourism studies and
apply them within an SES framework.
A major problem with the development of tourism in developing countries is the potential for
leakage of value out of the local economy, thus rendering the contribution made to poverty alleviation
insignificant [32–34]. This leakage may take place on both the national and local scales. Leakages out
of the national economy have been shown to be significant and are largely through a need for increased
importation of goods and services and through the repatriation of profits by foreign tourism operators
and owners [34]. Leakage out of local economies is even more significant and is driven by the reduced
capacity of local communities to produce skilled staff and quality operational supplies [32]. In certain
cases, the local economic benefit from tourism has been shown to be as low as 1% [35]. From the
perspective of recreational fishing tourism, it is imperative that leakage is reduced so that local fishing
communities receive the maximum possible benefit and can persist even if consumptive fishing is
shifted away from the recreational target species.
Therefore, it is necessary to provide comprehensive economic evaluations of tourist recreational
fisheries in order to understand their potential value to various stakeholders and in order to improve
the management of the resource system. The recreational fishery for the giant African threadfin,
Polydactylus quadrifilis (Cuvier, 1829) (Actinopterygii: Polynemidae), on the Kwanza (commonly also
referred to as Cuanza) Estuary provides a typical example of a highly valuable complex SES that is
prone to overuse. The area appears to have large ecological importance as it forms one of few large
estuarine habitats in northern Angola. Additionally, the area experiences high rates of use via human
activities including recreational and artisanal fishing. Extremely little scientific research has taken place
within the system, and, therefore, there is limited information about the fishery. However, the resource
system appears to be relatively healthy as anecdotal fishing reports suggest that the fishery is highly
productive, producing both large numbers of fish and trophy fish. This study aims to assess the direct
economic contribution of the recreational fishery for P. quadrifilis on the Kwanza Estuary. In doing
so, it provides values in terms of direct economic contribution as well as estimates of local economic
benefit following estimated leakage. Additionally, the catch-per-unit-effort (CPUE) for the various
species in the area was assessed and used to provide an economic benefit (in US$) per fish and per
kilogram of fish caught in the recreational fishery. These values were then compared to the market
value of fish caught within the artisanal fishery using the principle of ‘recreational-to-commercial ratio’
or RCR (see [7]).
2. Materials and Methods
The Kwanza Tarpon lodge was founded in 2007 to cater to foreign fishing tourists. The majority of
foreign tourists visit the lodge to target a range of recreational angling species, including P. quadrifilis,
Caranx hippos, Sphyraena afra, Megalops atlanticus and members of the genera Lutjanus (primarily
L. agennes) and Pseudotolithus (P. typus and P. senegalensis), and usually spend between 5 and 10 days
at the lodge per trip. While the local status of these species is unknown, the International Union for
Conservation of Nature (IUCN) has categorised the majority (P. quadrifilis, C. hippos, S. afra and P. typus)
as least concern, while L. agennes has been classified as data-deficient, M. atlanticus as vulnerable
and P. senegalensis as endangered. The lodge enforces strict C&R for the majority of fish angled,
and only a small proportion of fish caught are kept for consumption, usually following accidental
fishing-related mortality. Additionally, there is an increasing market for domestic fishing tourism at
the lodge. Many domestic tourists, defined here as either Angolan nationals or working expatriates
residing in Angola but not in the local area around the lodge, visit the lodge on weekends and public
holidays. The majority of domestic fishing tourists travel from the capital (Luanda) and usually visit
the area for the day (arrive early in the morning and return home late in the evening). Occasionally,
domestic fishing tourists will stay for longer and will spend a night or two at the lodge. Domestic
tourists may pay inflated prices for the use of the lodge’s facilities based on the shorter duration ofSustainability 2020, 12, 4221 4 of 23
their stays and their smaller group sizes when compared to foreign guests, who commonly receive
package deals.
Apart from fishing tourists, both foreign and domestic tourists (non-fishing) also benefit from the
establishment of the lodge whereby they are attracted by the other appealing attributes and activities
that have resulted from the lodge’s establishment. These include a swimming pool, boat cruises, meals,
accommodation and general tranquility and relaxation.
In addition to lodge-based tourism, a number of domestic fishing tourists visit the area to fish
recreationally using private or charter vessels owned by local artisanal fishermen. Many of these
anglers travel from Luanda on weekends and public holidays and usually visit the area for the day.
Many domestic fishing tourists initially used the lodge vessels and guides but have subsequently either
switched to the artisanal charter boat services as a cheaper alternative or have purchased and begun
using their own vessels. Therefore, at least some of the recent increases in recreational effort can be
attributed to the lodge, and thus, it is likely that recreational angling effort in this fishery would be
reduced if the lodge did not exist.
2.1. Defining the Fishery ‘Sectors’
For the purposes of this study, the recreational fishery for P. quadrifilis on the Kwanza Estuary
will be divided into two main sectors. These will include the recreational fishery operating out of
the lodge (the ‘lodge fishery’) and the domestic recreational fishery, which operates separately from
the lodge through the use of private vessels and artisanal charter vessels (the ‘non-lodge fishery’)
(Figure 1a). The lodge fishery can be further divided into three separate sub-sectors. These include
the ‘foreign lodge fishery’, the ‘domestic lodge fishery’ and ‘lodge casuals’, or hereon referred to as
‘casuals’, who are defined as foreign and domestic tourists who visit the lodge for purposes other than
fishing (Figure 1a).
2.2. Catch-Per-Unit-Effort (CPUE)
CPUE—lodge fishery
Catch-per-unit-effort was recorded for the lodge fishery on the Kwanza Estuary during the winter
fishing seasons (approximately 1 June–30 September) in 2016, 2017 and 2018. Fishing took place on
boats owned by the lodge, and the skipper of the boat was responsible for recording catch and effort
data. Skippers took note of the location and time at which fishing began and ended for each session
and on each day. The type of fishing (trolling/artificial lure/bait) and number of rods were recorded.
The number of P. quadrifilis and other species caught was recorded for each session, and each fish
was either measured (mm, fork length (FL)/total length (TL)) or allocated an estimated weight (kg).
Estimations of weight occurred when the measurement of fish was impossible or would unnecessarily
extend the amount of time the fish spent out of the water. Measurements of the primary species were
converted into weight in kilograms using the equations developed for the relevant species or, in the
case where no length–weight relationships were available, a closely related species:
Polydactylus quadrifilis: W ( g) = 0.0069 × FL(cm)3.14 [36]
Caranx hippos: W ( g) = 0.0207 × FL(cm)2.987 (C. ignoblis—[37])
Sphyraena afra: W ( g) = 0.0192 × FL(cm)2.84 (S. barracuda—[37])
Lutjanus spp.: W ( g) = 0.028 × FL(cm)2.84 (L. argentimaculatus—[37])
Pseudotolithus spp.: W ( g) = 0.0075 × TL(cm)3.029 [38]
In cases where catch entries did not include a measurement or an estimated weight for a specific
fish, the average weight for the species caught during the givenfishing season was used.
P Ci
The CPUE was calculated using the formula CPUE = E where Ci is the quantity or mass
i
i
(kg) of fish captured by the ith fisher and Ei is the effort expended by the ith fisher (measured in
angler-hours—one angler-hour is equivalent to one angler fishing with one rod/line for one hour).Sustainability 2020, 12, 4221 5 of 23
Sustainability 2020, 12, x FOR PEER REVIEW 5 of 25
Figure 1. Schematic diagram illustrating the two main sectors of the recreational fishery present on
Figure 1. Schematic diagram illustrating the two main sectors of the recreational fishery present on the
the Kwanza Estuary and the three further sub-sectors within the ‘lodge fishery’ (a). Tourist spending
Kwanza Estuary and the three further sub-sectors within the ‘lodge fishery’ (a). Tourist spending from
from the fishery sectors contributes to total revenue (TR) on a local, regional, national or international
the fishery sectors contributes to total revenue (TR) on a local, regional, national or international scale.
scale. Local expenditure contributes to local total revenue (LTR) and is either retained (retained
Local expenditure contributes to local total revenue (LTR) and is either retained (retained revenue) or
revenue) or leaked to the regional or national economy or out of Angola (international scale) (b).
leaked to the regional or national economy or out of Angola (international scale) (b).
2.2. Catch-Per-Unit-Effort (CPUE)
CPUE—non-lodge fishery
CPUE—lodge fishery
ForCatch-per-unit-effort
boats operating separately
was recorded from the lodge
for the lodgefishery
(private recreational
on the anglers
Kwanza Estuary and the
during artisanal
charters—i.e.,
winter fishingnon-lodge fishery), total effort
seasons (approximately 1 June–30wasSeptember)
estimated using visual
in 2016, 2017 counts
and 2018.(location,
Fishing number
took of
boats, number
place on boatsofowned
rods and fishing
by the method
lodge, and theper boat) of
skipper that
thewere
boat performed at regular
was responsible intervals
for recording by lodge
catch
and effort
skippers data.fishing
during Skippers took note
outings of the
during 2016 location
and 2017andonly.
time This
at which
was fishing began
performed and endedfor
separately forprivate
each and
vessels session
for and on each
artisanal day. The type of fishing (trolling/artificial lure/bait) and number of rods
charters.
were recorded.
In 2016, The number
observations of P. quadrifilis
of fishing and made
effort were other species caughtaswas
as regularly recorded
possible withfora each session,
minimum of eight
and each fish was either measured (mm, fork length (FL)/total length (TL)) or allocated
weekday counts and eight weekend counts performed each month (four counts per week). In order an estimated
weight (kg). Estimations of weight occurred when the measurement of fish was impossible or would
to understand whether the use of less observation days in 2017 would significantly affect results,
unnecessarily extend the amount of time the fish spent out of the water. Measurements of the primary
four observations were randomly selected for each calendar week (two weekdays and both weekend
species were converted into weight in kilograms using the equations developed for the relevant
days) andor,
species a in
mean daily
the case effort
where no was calculatedrelationships
length–weight per weekday wereand per weekend
available, in 2016.species:
a closely related Thereafter,
two observations were randomly selected per week (one weekday and one weekend day) from the
same dataset, and an unpaired Student’s t-test was utilised to assess for difference between the mean
daily effort during the week and during the weekend between the 2-day sampling and the 4-daySustainability 2020, 12, 4221 6 of 23
sampling technique. Based on the result, fishing effort in 2017 was assessed using a reduced sampling
methodology where a minimum of four weekday counts and four weekend counts were performed
each month (two counts per week).
Species-specific catch was estimated for the non-lodge fishery using the fishing method-specific
effort data collected for the non-lodge fishery and the fishing method-specific CPUE from the
lodge fishery.
2.3. Economic Assessment
Since the focus of this study is to ascertain the direct economic contribution of the fishery for
P. quadrifilis on the Kwanza Estuary and estimate the percentage of value retained within the local
community, a number of typical methodological considerations need to be made and accounted for.
Income and economic activity generated through the lodge is only partly the result of recreational
fishermen. A large component of lodge income is derived from casual tourists who are not visiting the
area for the purposes of fishing. However, the lodge would not exist if it were not for its establishment
as a fishing lodge, and thereby, revenue generated through casual tourist spending may not have taken
place without its establishment (or at least not within this location). There are arguments for both the
inclusion and exclusion of casual spending within this study [39]. Therefore, economic impact within
this study will be presented both with and without the inclusion of casual spending at the lodge.
2.3.1. Definition of the Local, Regional, National and International Scales
Tourist and lodge spending was recorded and estimated at the local, regional, national and
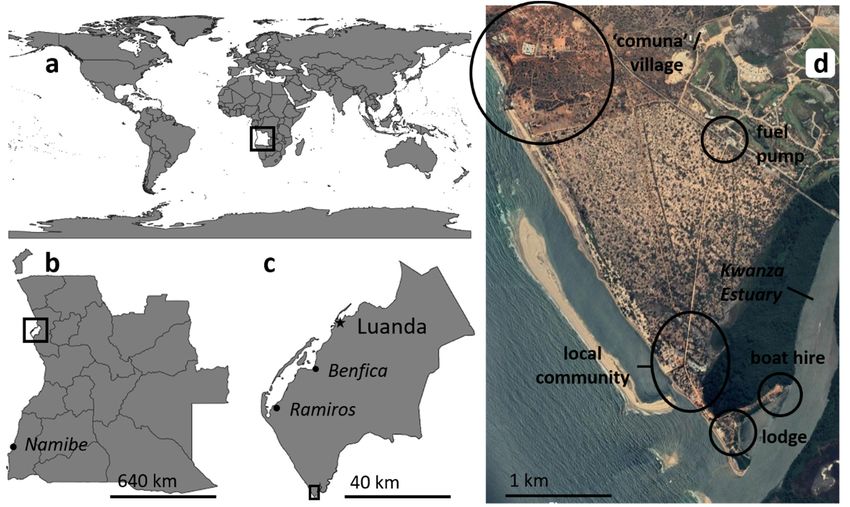
international scales (Figures 1b and 2). For the purpose of this study, the international scale incorporated
spending outside of the country (Figure 2a). The national scale constituted anywhere outside of the
province and included payments to national government (Figure 2b). The regional scale included
expenditure in the nearest two towns of Ramiros (39 km by road) and Benfica (65 km by road) and the
capital city, Luanda (80 km by road) (Figure 2c). The local scale included the local village, commonly
referred to by locals as the ‘comuna’, and the immediate surrounding area (within an approximately
10 km radius of the lodge—Figure 2d). All expenses were converted to a value in United States Dollars
(US$) using an exchange rate of 165 Angolan Kwanza to the Dollar and 15 South African Rand to the
Dollar, which was appropriate during the study period [40].
2.3.2. Economic Terminology and Definitions
In order to gain an understanding of the retention of value accruing from recreational fishing for
P. quadrifilis on the Kwanza Estuary, it was necessary to calculate total revenue (TR), local total revenue
(LTR) and leaked revenue (LR) generated through tourism [32]. Within this study, TR is defined as
the money spent by tourists that visited the lodge (lodge fishery) or visited the study site for the
purposes of recreational fishing (non-lodge fishery). A component of TR is spent locally (within an
approximately 10 km radius of the lodge—Figures 1b and 2d) and is referred to as LTR. For example,
money spent on guest flights to Angola was considered within TR but not within LTR, whereas money
spent at the lodge was considered within both TR and LTR (Figure 1b). Leaked revenue is defined as
LTR that does not accrue to a local person, either through payment or profit, even though the initial
spending occurred locally (Figure 1b).
Total revenue (TR) and local total revenue (LTR)
Total revenue and LTR were recorded from 1 June to 30 September 2016 and 2017 only and
were calculated separately for the lodge fishery and the non-lodge fishery. All tourist spending was
considered within TR, while tourist spending at the lodge, at the local fuel pump, within the local
village and community and with local artisanal fishermen was considered LTR (Figure 2). The average
daily spend per tourist per day was calculated according to the number of tourists and was presented inSustainability 2020, 12, x FOR PEER REVIEW 7 of 25
Sustainability 2020, 12, 4221 7 of 23
village, commonly referred to by locals as the ‘comuna’, and the immediate surrounding area (within
an approximately 10 km radius of the lodge—Figure 2d). All expenses were converted to a value in
terms
UnitedofStates
TR and LTR (by
Dollars dividing
(US$) using the value by the
an exchange ratenumber of tourists).
of 165 Angolan This to
Kwanza wasthecalculated
Dollar andseparately
15 South
for day tourists and overnight tourists in each sector.
African Rand to the Dollar, which was appropriate during the study period [40].
Figure 2.
Figure 2. AAvisual
visualrepresentation
representation of of
thethe
international (a), (a),
international national (b), regional
national (c) and
(b), regional (c)local
and (d) scales
local (d)
as defined
scales withinwithin
as defined this study.
this Black
study.boxes
Blackonboxes
each on
map refer
each to the
map location
refer to theoflocation
the following figure. All
of the following
fishingAll
figure. tourist
fishingspending within the
tourist spending various
within scales was
the various scalesconsidered withinwithin
was considered total revenue (TR).(TR).
total revenue The
satellite image (Google Earth, Google inc.) displaying the local area at the Kwanza
The satellite image (Google Earth, Google inc.) displaying the local area at the Kwanza Estuary mouth Estuary mouth (d)
indicates
(d) indicatesthethe
locations
locationswhere
where local
localfishing
fishingtourist
touristspending
spendingtooktookplace
place(including
(including atat the lodge, fuel
fuel
pumpand
pump andvillage
villageandandfor
forartisanal
artisanalboat
boathire)
hire)and
andcontributed
contributedto tolocal
localtotal
totalrevenue
revenue(LTR).
(LTR).
Lodge
2.3.2. fishery
Economic(foreign, domestic and
Terminology andlodge casuals)
Definitions
In order
Total to gain
revenue an understanding
within the foreign lodge of the retention
fishery of value accruing
was calculated by summing fromthe recreational
spending of fishing
each
for P. quadrifilis on the Kwanza Estuary, it was necessary to calculate total
foreign fishing tourist. Foreign tourists were transported to and from the airport in Luanda by lodge revenue (TR), local total
revenue
staff, and (LTR)
they paidand aleaked revenue
fixed daily rate (LR)
during generated
their stay,through
which tourism
included[32].theirWithin
meals, this study, TR is
accommodation
defined as the money spent by tourists that visited the lodge (lodge
and boat fees. These tourists did not spend extra money in the local economy, and all spending fishery) or visited the study site
within
for country
the the purposes of recreational
took place and was recordedfishingat(non-lodge fishery).
the lodge (except A component
perhaps for some ‘outof TR is spentregional
of pocket’ locally
spending at the airport, which was disregarded). However, some spending took place outside ofLTR.
(within an approximately 10 km radius of the lodge—Figures 1b and 2d) and is referred to as the
For example,
country and was money spent on
recorded. guest flights
A record was kept to Angola
of theirwas considered
country within
of origin, TR but
duration ofnot
staywithin LTR,
and flight
whereas
details money
(airline andspent
cost ofat return
the lodge wasThe
ticket). considered within visa
cost of a tourist bothwasTR calculated
and LTR (Figure
per guest 1b). Leaked
according
revenue is defined
to their country of origin. as LTR that does not accrue to a local person, either through payment or profit,
evenForthough the initial spending occurred locally (Figure 1b).
the domestic lodge fishery, expenses at the lodge were recorded. Fishing tourist spend on
Total
food, beveragesrevenueand (TR) and local was
transport total recorded
revenue (LTR)per group. Transport information that was recorded
Total revenue and LTR were recorded
included their area of origin (in Angola), number from 1ofJune to 30used
vehicles September
during2016 and 2017
transport and only andofwere
the size the
calculatedparty.
travelling separately
Transport for expense
the lodge wasfishery and per
calculated thetravelling
non-lodge fishery.
party usingAllthetourist
calculated spending
distancewasof
considered within TR, while tourist spending at the lodge, at the local
travel, the fuel price of 160 Kz/L (which remained constant over the sampling period) and an assumedfuel pump, within the local
village
fuel and community
consumption and with local artisanal fishermen was considered LTR (Figure 2). The
of 10 km/L.
average
Totaldaily
revenuespend per tourist
accrued per day
from lodge was calculated
casuals according
was also recorded to the number
according of tourists
to expenditure and
at the was
lodge
presented in terms of TR and LTR (by dividing the value by the number
only. This included spending on accommodation, meals, drinks and river cruises. However, casuals’ of tourists). This was
calculated separately for day tourists and overnight tourists in each sector.
spending outside of the lodge (including private transport to and from the lodge) was not considered
basedLodge
on the fishery (foreign,
fact that theydomestic
did not and lodge
travel casuals)
to the area for the purposes of fishing and information wasSustainability 2020, 12, 4221 8 of 23
not available to estimate other ‘out of pocket’ spending within the area, although it was assumed to
be minimal.
Non-lodge fishery
The direct economic contribution of the domestic recreational fishery operating separately from
the lodge was estimated using the simple equation:
direct economic contribution of fishermen spending = number of fishermen * average spending per fisherman [41,42].
Estimates of the number of domestic recreational fishermen fishing privately or with the use
of artisanal charters were gained from the fishing effort data collected and described earlier. Since
estimates of the number of domestic recreational anglers were only available during the week and
weekends in 2016 and 2017, the economic estimates were only made for those years.
Tourist spending was estimated per travelling party instead of per angler since the cost of
travel and boat usage was shared amongst anglers (see [42]). Average spending estimates for the
non-lodge fishery were collected via interviews with 19 domestic recreational anglers. All interviewees
provided their informed consent, and interviews were conducted in accordance with the Declaration
of Helsinki of 1975, Ethics approval 2019-0178-820, Rhodes University, Grahamstown, South Africa.
Collected information included their daily spending on food and beverages, travel to the study area,
accommodation (when applicable) and the cost of the day’s fishing (fuel for the boat or boat hire).
Leaked revenue (LR)
Leaked revenue was determined from 1 June to 30 September 2016 and 2017 and was calculated
separately for the lodge fishery and the non-lodge fishery. Leaked revenue was considered as LTR that
was not retained locally through lodge spending at locally owned businesses or directly with artisanal
fishermen, lodge spending on salaries for local staff or profit accrued by local artisanal fishermen for
the hiring of their boats (Figure 1, Table 1). Retained revenue was defined as the money that was
retained within the local community following estimated leakage. It was calculated by subtracting
estimated LR from the LTR and was calculated for each of the fishery sectors. Both LR and retained
revenue were expressed in USD and as a percentage of the LTR.
Lodge fishery (foreign, domestic and lodge casuals)
For the lodge fishery, all LTR accrued to the lodge as all tourist spending (locally) occurred at
the lodge. Therefore, an analysis of leakage was estimated using lodge expenditure—i.e., tracing
guest spending one step further from spending at the lodge to spending by the lodge on supplies and
operational costs.
Total spending by the lodge was assessed and leakage was estimated using the guidelines outlined
in Table 1. The retained revenue was calculated by subtracting the LR from the LTR. Retained revenue
was presented as a percentage of LTR for the lodge fishery. This percentage was then utilised to calculate
the retained revenue and LR from the LTR separately for the foreign lodge fishery, the domestic lodge
fishery and lodge casuals.Sustainability 2020, 12, 4221 9 of 23
Table 1. Components of local tourist spending considered retained or leaked for the Polydactylus quadrifilis recreational fishery on the Kwanza Estuary. Only local
tourist spending/local total revenue (LTR) was considered. Leaked revenue (LR) was further defined as LTR leaked to the regional, national and international scales
(see Figure 1b).
Local Total Revenue (LTR) LTR Considered Leaked to LTR Considered Leaked to LTR Considered Leaked to
Considered Retained the Regional Scale the National Scale the International Scale
All money spent by the lodge on goods All money spent by the lodge on goods
All money spent by the lodge on goods
All money spent by the lodge and and services from businesses located and services from businesses located
and services outside of the country/All
tourists on goods and services from outside of the local area but within the outside of the region but within the
money spent by the lodge and tourists at
locally owned businesses as well as region/All money spent by the lodge and country/All money spent by the lodge
local businesses with international
directly with local fishermen tourists at local businesses with regional and tourists at local businesses with
owners
owners national owners
All salaries paid by the lodge to All salaries paid by the lodge to
All salaries paid by the lodge to foreign
All salaries paid by the lodge to local staff non-local staff living outside of the local non-local staff living outside of the
staff
area but within the region region but within the country
Profit accrued by local artisanal
All staff flights on the Angolan
fishermen for the rental of boats to All lodge vehicle permitting and fines All staff flights on foreign airlines
airline—TAAG
recreational fishermen
Personal income tax paid on lodge
All lodge boat/vessel permitting employee salaries varying between 9% The cost of work visas for foreign staff
and 17%
Lodge permitting Lodge profit
Lodge communications costsSustainability 2020, 12, 4221 10 of 23
Non-lodge fishery
Leakage here was estimated by tracing the spending of domestic fishing tourists using private
vessels and artisanal charters. Any money spent locally (LTR) by domestic fishing tourists outside of
the lodge was assumed to be spent in either one of two locations—at the local fuel pump, or directly
to artisanal fishermen for boat hire (Figure 2). Money spent at the fuel pump was considered leaked
because the business was owned by a non-local who did not live in the area. Some fuel pump
employees were local but would not disclose their salaries. However, domestic fishing tourists likely
contributed relatively little towards the overall income at the fuel pump and therefore contributed
little towards local employee salaries. A percentage of the money paid directly to local fishermen for
boat hire was considered retained. This percentage was dictated by the cost of daily boat hire ($151.52)
minus the daily fuel cost of a charter, which was estimated to be $47.78 by 12 artisanal boat owners
during interviews.
Direct economic contribution in terms of fish and per kg of fish
The economic contributions were converted to a monetary value in terms of fish and per kg of fish
for all species and for P. quadrifilis only. Catch values, in terms of fish and kg of fish, were calculated
from the CPUE data. Values were expressed in terms of TR, LTR and retained revenue for each fishery
sector and during each season according to the following formulae:
TR or LTR or retained revenue
Economic value per f ish ($) =
Catch (no. o f f ish)
TR or LTR or retained revenue
Economic value per kg ($) =
Catch (kg)
The calculated values were then compared to the market value of fish in the artisanal sector to
present a recreational-to-commercial ratio (RCR) of economic value [7]. The market value of artisanal
catch was provided by artisanal fishermen during interviews in July 2017 (approximately $7.44 for all
recreational species and $8.38 per kg for P. quadrifilis). These values appeared to remain fairly consistent
over the study period.
3. Results
3.1. Catch-Per-Unit-Effort (CPUE)
CPUE—lodge fishery
Catch and effort data were collected for lodge clients for a total of 210 days over the three-year
period with 85 data-collection days in 2016, 77 days in 2017 and 64 days in 2018. Total angling effort
for the three years was 6,014 angler-hours with 1,977 angler-hours recorded in 2016 (23.3 angler-hours
per day), 2,075 in 2017 (27.0 angler-hours per day) and 1,962 in 2018 (30.7 angler-hours per day).
Fishing effort was dominated by artificial lure fishing (87%), followed by bait fishing (7%) and trolling
(6%).
A total of 847 fish were captured during the three periods (CPUE (± SD) = 0.14 ± 0.24 fish per
angler-hour) with a cumulative mass of 7,721 kg (mean = 9.2 kg, CPUE = 1.28 ± 2.51 kg per angler-hour),
although it varied drastically between years. The best catches were achieved in 2018 with 380 fish
(CPUE = 0.19 ± 0.30 fish per angler-hour) caught with a mass of 3,252 kg (CPUE = 1.66 ± 2.84 kg
per angler-hour). In contrast, 2017 produced poor catches totalling 156 fish (CPUE = 0.08 ± 0.15 fish
per angler-hour) with a total mass of 1,526 kg (CPUE = 0.74 ± 1.67 kg per angler-hour) (Figure 3).
Bait fishing produced the highest mean CPUE in terms of both fish number (0.18 ± 0.29 fish per
angler-hour) and weight (2.06 ± 4.20 kg per angler-hour) followed by artificial lure angling (0.14 ± 0.25
fish per angler-hour; 1.23 ± 2.48 kg per angler-hour) and trolling (0.07 ± 0.15 fish per angler-hour;Sustainability 2020, 12, x FOR PEER REVIEW 11 of 25
per angler-hour) with a total mass of 1,526 kg (CPUE = 0.74 ± 1.67 kg per angler-hour) (Figure 3). Bait
Sustainability 2020, 12,
fishing produced the4221
highest mean CPUE in terms of both fish number (0.18 ± 0.29 fish per angler- 11 of 23
hour) and weight (2.06 ± 4.20 kg per angler-hour) followed by artificial lure angling (0.14 ± 0.25 fish
per angler-hour; 1.23 ± 2.48 kg per angler-hour) and trolling (0.07 ± 0.15 fish per angler-hour; 1.14 ±
1.14 ± per
2.42 kg 2.42 kg per angler-hour).
angler-hour). In terms
In terms of average of trolling
fish size, average fish size,
produced the trolling produced
biggest fish the biggest fish
(mean = 15.46
(mean = 15.46 kg) followed by bait fishing (mean = 11.79 kg) and artificial lure
kg) followed by bait fishing (mean = 11.79 kg) and artificial lure angling (mean = 8.74 kg).angling (mean = 8.74 kg).
Figure 3. Catch-per-unit-effort (CPUE) of the dominant species caught by the lodge fishery on the
Figure 3. Catch-per-unit-effort (CPUE) of the dominant species caught by the lodge fishery on the
Kwanza Estuary in Angola between June and September in 2016, 2017 and 2018.
Kwanza Estuary in Angola between June and September in 2016, 2017 and 2018.
Polydactylus quadrifilis (50%), C. hippos (23%) and S. afra (5%) were the dominant species,
Polydactylus quadrifilis (50%), C. hippos (23%) and S. afra (5%) were the dominant species, while
while
members members of the
of the genera genera
Lutjanus (9%)Lutjanus (9%) and(6%)
and Pseudotolithus Pseudotolithus (6%) were
were also commonly alsoIncommonly
caught. terms caught.
In terms of cumulative numbers, P. quadrifilis had the highest CPUE (0.07 fish
of cumulative numbers, P. quadrifilis had the highest CPUE (0.07 fish per angler-hour) followed by C. per angler-hour) followed
by C. (0.03
hippos hipposfish(0.03 fish per angler-hour)
per angler-hour) and Lutjanus spp. Lutjanus
and(0.01 fish perspp. (0.01 fish
angler-hour). In per
termsangler-hour).
of cumulative In terms of
mass, P. quadrifilis
cumulative mass,also had the highest
P. quadrifilis CPUE
also had the(0.64 kg perCPUE
highest angler-hour)
(0.64 kg followed again by C. hippos
per angler-hour) followed again by
(0.29 kg per angler-hour) and Lutjanus spp. (0.14 kg per angler-hour).
C. hippos (0.29 kg per angler-hour) and Lutjanus spp. (0.14 kg per angler-hour).
The species composition varied dramatically among years with P. quadrifilis dominating catches
The species composition varied dramatically among years with P. quadrifilis dominating catches
in 2016 (238 individuals, 79%) before large reductions in 2017 (51 individuals, 33%) and 2018 (127
in 2016 (238 individuals, 79%) before large reductions in 2017 (51 individuals, 33%) and 2018
individuals, 33%) (Figure 3). In contrast, C. hippos did not contribute strongly to the fishery in 2016
(127 individuals,
(15 individuals, 33%)
5%), while(Figure 3). aInlarge
it formed contrast, C. hippos
percentage did not
of catches contribute
in 2017 strongly28%)
(44 individuals, to the
andfishery in 2016
(15
wasindividuals,
the most prolific5%), whileinit2018
species formed a large percentage
(142 individuals, of catches
37%). Likewise, in 2017
Lutjanus (44were
species individuals,
scarce 28%) and
was the(23
in 2016 most prolific8%)
individuals, species in 2018
and 2018 (142 individuals,
(10 individuals, 3%) but 37%). Likewise,
were dominant Lutjanus
in 2017 species were scarce in
(44 individuals,
28%) (Figure
2016 3) where they
(23 individuals, 8%) were
andheavily
2018 (10targeted with the use
individuals, 3%)ofbut
live were
bait (increase
dominant in effort from(44
in 2017 98 individuals,
angler-hours (5% of total effort) in 2016 to 205 angler-hours (10% of total effort) in 2017).
28%) (Figure 3) where they were heavily targeted with the use of live bait (increase in effort from 98
The majority of fish captured during the sampling period were large (mean, 9.22 kg). Mean
angler-hours (5% of total effort) in 2016 to 205 angler-hours (10% of total effort) in 2017).
weights for P. quadrifilis, C. hippos, S. afra, Lutjanus spp. and Pseudotolithus spp. were 9.2, 9.3, 9.5, 10.7
and 6.8The
kg,majority of fish captured during the sampling period were large (mean, 9.22 kg). Mean weights
respectively.
for P.CPUE—non-lodge
quadrifilis, C. hippos,
fishery S. afra, Lutjanus spp. and Pseudotolithus spp. were 9.2, 9.3, 9.5, 10.7 and
6.8 kg, respectively.
Domestic fishing effort within the non-lodge fishery was recorded most frequently during the
2016 season with 50 days of direct observation. During this season, based on four days of observation
CPUE—non-lodge fishery
per week (2 weekdays, 2 weekend days), average effort was estimated to be 35.5 angler-hours per
day during weekdays and 94.8 angler-hours per day during weekends. This was not significantly
Domestic
different fishing
for weekdays effort within
(unpaired thet-test:
Student’s non-lodge
t = −0.21,fishery
d.f. = 31,was recorded
p = 0.83) most frequently
or weekends (t = −0.31, during the
d.f. = 28, p = 0.76) from the estimates (33.1 angler-hours per day during
2016 season with 50 days of direct observation. During this season, based on four daysweekdays and 89.6 angler-
of observation
hours per day during weekends) based on two days of observation (1 weekday,
per week (2 weekdays, 2 weekend days), average effort was estimated to be 35.5 angler-hours 1 weekend day). per day
Based on these findings, fishing effort for the non-lodge fishery during the 2017 season was assessed
during weekdays and 94.8 angler-hours per day during weekends. This was not significantly different
using two days of observation per week.
for weekdays (unpaired Student’s t-test: t = −0.21, d.f. = 31, p = 0.83) or weekends (t = −0.31, d.f. = 28,
In 2017, daily local effort was calculated as 64.3 angler-hours per day during weekdays and 79.4
= 0.76) from
pangler-hours perthe
dayestimates (33.1 angler-hours
during weekends. per day
In terms of fishing method during
acrossweekdays andtrolling
both seasons, 89.6 angler-hours
was per
day during weekends) based on two days of observation (1 weekday, 1 weekend day). Based on these
findings, fishing effort for the non-lodge fishery during the 2017 season was assessed using two days
of observation per week.
In 2017, daily local effort was calculated as 64.3 angler-hours per day during weekdays and
79.4 angler-hours per day during weekends. In terms of fishing method across both seasons, trolling
was the most popular technique utilised (81.9%) followed by artificial lure fishing (17.5%). Based on
the CPUE calculated for each method in the lodge fishery, the total catch of the non-lodge fishery was
estimated as 483 fish with a weight of 7,612 kg in 2016 and 242 fish with a weight of 3,058 kg in 2017.Sustainability 2020, 12, 4221 12 of 23
In terms of P. quadrifilis, a total catch of 160 fish with a weight of 1,554 kg was estimated for 2016 and
91 fish with a weight of 973 kg for 2017.
3.2. Economic Assessment
3.2.1. Total Revenue (TR) and Local Total Revenue (LTR)
Total revenue, which consists of spending that takes place locally (LTR) or outside of the local
scale (regionally, nationally or internationally), is presented in Table 2. The TR generated from fishing
tourism (both the lodge fishery and non-lodge fishery) at the Kwanza Estuary (including lodge casuals)
was estimated as $295,638 in 2016 and $268,469 in 2017 (mean of $282,054 per fishing season) (Table 2).
Of this, a mean of $236,826 (83.9%) was spent locally and a mean of $33,010 was retained (13.9% of
LTR) per season. With the exclusion of lodge casual tourist spending, TR was reduced to $158,259 per
season, of which $113,031 (71.4%) was spent locally and $24,670 was retained (21.8% of LTR).
Lodge fishery (foreign, domestic and lodge casuals)
An average of 36 foreign fishing tourists visited the lodge and spent an average of 219 bed nights
there per season (Table 2). The average total cost for foreign tourists was estimated at $288.24 per
person per day and contributed, on average, $62,981 per season (Table 2). The local contribution of
each foreign fishing tourist was estimated at $201.28 per person per day during the study period and
contributed an amount of $43,981 towards LTR per season (69.8% of TR). This came in the form of
foreign guest spending at the lodge on accommodation (mean per season = $27,850), drinks ($1,994)
and fishing days ($14,087).
Non-local spending included the cost of guest visas (mean per season = $3,200) and flights
($15,800) and amounted to an average of $19,000 each season (Table 2). An average of 102 domestic
fishing guests visited the lodge, spending an average of 41 bed nights there and generating a mean
TR of $28,126 per season (Table 2). The direct total contributions of domestic lodge fishing tourists
to LTR were estimated at $355.58 per person per night for overnight guests and $217.70 per person
per day for day guests. Local TR averaged $21,646 (77% of total TR) per season and was spent at
the lodge on accommodation (mean per season = $6,094), drinks ($1,214), meals ($811) and boat hire
($13,528). Local contributions were estimated at $291.41 per person per night for overnight guests and
$153.53 per person per day for day visitors in 2016 and 2017 (Table 2). Non-local spending included
guest expenditure on transport to and from the lodge (mean per season = $1,360) and on food and
beverages ($5,120).
Non-lodge fishery
A total of 1,925 fishing days (one day’s fishing for one fishing tourist) were estimated for 2016 and
2017. Of those, a total of 1,099 fishing days were estimated for local charters, while 826 fishing days
were attributed to private vessels. The total estimated contribution per person per night was $196.44 for
overnight guests and $63.10 per person per day for day visitors (Table 2). The TR generated averaged
$67,152 per season and included local spending on accommodation (mean per season = $6,417),
boat fuel for private vessels ($13,223) and boat hire from artisanal fishers ($27,764), averaging $47,404
(70.6% of TR) per season (Table 2). Local contributions were estimated at $175.92 per person per night
for overnight guests and $42.58 per person per day for day visitors. Non-local revenue included
spending on food and beverages (mean per season = $12,954) and transportation ($6,794).Sustainability 2020, 12, 4221 13 of 23
Table 2. The mean spending per fishing tourist, estimated total revenue (TR), local total revenue (LTR), estimated leaked revenue (LR) and retained revenue per tourist
category for the recreational fishery for Polydactylus quadrifilis at the Kwanza Estuary, Angola. Values present the means per season across two fishing seasons (1 June
to 30 September) in 2016 and 2017.
Mean Total and [local] Mean Total and [local] Non-Local Retained
Number of Number of
Sector Spending pppd for Spending pppd for Day TR LTR Spending LR (% of LTR) Revenue
Tourists Bed Nights
Overnight Guests Visitors (TR Minus LTR) (% of LTR)
Lodge Fishery
Foreign lodge fishery 36 219 288.24 [201.28] - 62,981 43,981 19,000 40,858.35 (92.9%) 3,122.65 (7.1%)
Domestic lodge fishery 102 41 355.58 [291.41] 217.70 [153.53] 28,126 21,646 6,480 20,109.13 (92.9%) 1,536.87 (7.1%)
Casuals 1,700 408 [175.68] [58.99] 123,795 123,795 - 115,005.55 (92.9%) 8,789.45 (7.1%)
Lodge fishery excl. casuals 91,107 65,627 25,480 60,967.48 (92.9%) 4,659.52 (7.1%)
Lodge fishery incl. casuals 214,902 189,422 25,480 175,972.77 (92.9%) 13,448.50 (7.1%)
Non-lodge fishery 963 48 196.44 [175.92] 63.10 [42.58] 67,152 47,404 19,748 27,842.72 (58.7%) 19,561.84 (41.3%)
Lodge and non-lodge fishery excl. casuals 158,259 113,031 45,228 88,360.35 (78.2%) 24,670.20 (21.8%)
Lodge and non-lodge fishery incl. casuals 282,054 236,826 45,228 203,815.80 (86.1%) 33,009.51 (13.9%)Sustainability 2020, 12, 4221 14 of 23
3.2.2. Leaked Revenue (LR)
Lodge fishery (foreign, domestic and lodge casuals)
Expenses incurred by the lodge amounted to $159,437 in 2016 and $151,107 in 2017 (mean per
season = $155,272). Of this, only a small percentage (7.1% of LTR—$13,449 per season including
casuals or $4,660 per season excluding casuals) was considered retained within the local economy
(Tables 2 and 3). This came in the form of salaries to local staff (mean per season = $9,151), expenditure
on locally sourced fish and seafood ($2,966) and miscellaneous items ($1,322) (Table 3). The lodge
employed 17 full-time Angolan staff in both 2016 and 2017 including two boat captains, two cooks,
four security guards, three cleaners, three gardeners, one handyman, one carpenter and one driver.
However, only seven staff members were from the local community, while three were from Luanda
and seven were from the town of Namibe in the south of Angola. Of the 17 Angolan staff, only the
driver and the handyman could speak basic English (a necessary skill when interacting with foreign
English-speaking clientele).
The majority of lodge supplies were sourced in and around Luanda, and therefore direct leakage
into the regional economy was high (77.1% of lodge spending/LTR—$119,745) (Table 3). This was mostly
comprised of operational costs (food, beverages, fuel for electricity generation, general maintenance
etc.), averaging $101,494 per season. Other direct leakages to the regional economy included lodge
transportation costs (fuel and vehicle maintenance) at $13,407 per season and lodge employee salaries
at $4,845 per season (Table 3). Leakages of LTR directly to the national economy averaged $20,200 per
season and were mostly in the form of leakages via the salaries of non-local Angolan staff and personal
income tax paid on employee salaries (Table 3). Direct leakages of LTR out of the country came in the
form of salaries paid to foreign staff (mean per season = $7,684) and via the repatriation of lodge profit
(calculated as $40,309 and $27,990 before tax in 2016 and 2017, respectively—Table 3).
Non-lodge fishery
Local TR within the non-lodge fishery included spending on local accommodation, boat hire and
boat fuel. Over the two-year period, an average of $19,562 (41.3% of LTR) per season was considered
retained within the local community (Table 2). This came in the form of money paid directly to artisanal
fishermen for boat hire (mean per season = $27,764), minus estimated fuel cost ($8,755), averaging
$19,009 per season, and a percentage of the money spent on accommodation at the lodge at $553 per
season. Money spent on boat fuel for private vessels ($13,223 per season) was considered leaked to the
regional scale.Sustainability 2020, 12, 4221 15 of 23
Table 3. Detailed total spending of a recreational fishing lodge on the Kwanza Estuary, Angola, during the winter fishing season (June 1–September 30) of 2016 and
2017. Lodge expenditure originated as local total revenue (LTR) generated from foreign and domestic fishing as well as casual tourists and is further allocated as
money retained within the local economy (retained revenue) or leaked (leaked revenue—LR) to either the regional or national economies. Money leaked out of the
country is not indicated in the table but can be identified by subtracting all values from LTR.
2016 2017 Mean (2016 and 2017)
Leaked to Leaked to Leaked to Leaked to Leaked to Leaked to
Retained Retained Retained
LTR Regional National LTR Regional National LTR Regional National
Revenue Revenue Revenue
(US$) Economy Economy (US$) Economy Economy (US$) Economy Economy
(US$) (US$) (US$)
(US$) (US$) (US$) (US$) (US$) (US$)
Lodge Transport costs
Petrol and Diesel 8,502 8,502 6,012 6,012 7,257 7,257
Car maintenance 4,054 4,054 2,067 2,067 3,060 3,060
S&T 2,517 2,517 2,970 2,970 2,744 2,744
Staff flights 426 426 473 473 450 450
Vehicle permits and fines 570 570 121 121 345 345
Total 16,069 0 15,643 426 11,643 0 11,170 473 13,856 13,407 450
Lodge Operational costs
Boats
Fuel 1,614 1,614 1,729 1,729 1,672 1,672
Maintenance 1,043 1,043 2,445 2,445 1,744 1,744
Permits 1,030 1,030 1,030 1,030 1,030 1,030
Lodge
Diesel (electricity) 19,988 19,988 17,673 17,673 18,831 18,831
Food 55,750 3,184 52,566 47,832 2,748 45,084 51,791 2,966 48,825
Drinking water 3,811 3,811 2,752 2,752 3,281 3,281
Beverages 10,667 10,667 8,202 8,202 9,435 9,435
Permits 606 606 606 606 606 606
Communications 1,342 1,342 1,555 1,555 1,448 0 1,448
Maintenance (building materials and tools) 9,871 9,871 12,326 12,326 11,098 11,098
Cleaning supplies 3,340 3,340 4,151 4,151 3,745 3,745
Gas 964 964 594 594 779 779
Miscellaneous 2,144 1,765 379 1,414 899 515 1,779 1,332 447
Total 112,171 4,949 105,880 1,342 102,309 3,647 97,107 1,555 107,240 4,298 101,494 1,448
Lodge Salaries and Visas
Angolan staff 21,597 8,025 4,249 9,323 27,655 10,276 5,440 11,939 24,626 9,151 4,845 10,631
Foreign staff 9,200 1,516 9,200 1,516 9,200 1,516
Staff visas 400 400 300 300 350 350
Total 31,197 8,025 4,249 11,239 37,155 10,276 5,440 13,755 34,176 9,151 4,845 12,497
Lodge Profit
Total 40,309 6,853 27,990 4,758 34,150 0 0 5,805
Total contribution 199,746 12,974 125,771 19,860 179,097 13,923 113,718 20,541 189,422 13,449 119,745 20,200Sustainability 2020, 12, 4221 16 of 23
3.2.3. Direct Economic Contribution in Terms of Fish and per kg of Fish
The estimated value of fish caught recreationally on the Kwanza Estuary varied between the lodge
fishery and non-lodge fishery and between the fishing seasons in 2016 and 2017 (Figure 4, Table 4).
Prices per fish and per kg of fish were considerably higher in 2017 based on reduced catches in that
year (i.e., a lower ‘supply’ of fish). In terms of TR, the estimated prices per fish and per kg of fish for all
species and for P. quadrifilis were generally higher within the lodge fishery (Figure 4, Table 4). Based on
the TR accrued within the lodge fishery, with the inclusion (and exclusion) of casual spending, the total
direct economic contribution in terms of fish was calculated as $560.96 ($231.22 excl. casual spending)
per fish and $57.36 ($23.64) per kg in 2016 and $950.11 ($415.53) per fish and $97.15 ($42.49) per kg in
2017 (Table 4). However, when considering retained revenue alone, values dropped to $31.80 ($7.30)
per fish and $3.25 ($0.75) (RCR < 1) per kg in 2016 and to $65.84 ($15.45) per fish and $6.73 ($1.58)
Sustainability 2020, 12, x FOR PEER REVIEW 18 of 25
(RCR < 1) per kg in 2017 (Figure 4, Table 4).
Figure 4. Estimated recreational values of fish (all species) and of Polydactylus quadrifilis caught within
Figure 4. Estimated recreational values of fish (all species) and of Polydactylus quadrifilis caught within
the lodge and non-lodge recreational fisheries present on the Kwanza Estuary, Angola in 2016 and 2017.
the lodge and non-lodge recreational fisheries present on the Kwanza Estuary, Angola in 2016 and
Values are estimated in terms of total revenue (TR), local TR and locally retained LTR. Grey solid lines
2017. Values are estimated in terms of total revenue (TR), local TR and locally retained LTR. Grey
represent the price per kg of P. quadrifilis ($8.38), and black dotted lines represent the price per kg of all
solid lines represent the price per kg of P. quadrifilis ($8.38), and black dotted lines represent the price
species ($7.44) in the artisanal fishery.
per kg of all species ($7.44) in the artisanal fishery.
Table 4. The estimated values of recreationally caught fishes and Polydactylus quadrifilis from the
Kwanza Estuary, Angola in 2016 and 2017 displayed in dollar terms (US$—A) and in terms of
recreational-to-commercial ratio (RCR—B) using a commercial market value of $7.44 per kg for all
species and $8.38 per kg for P. quadrifilis. Values are given using estimates of total revenue (TR), local
total revenue (LTR) and retained revenue.
2016 2017
A—US$ All Species P. Quadrifilis All Species P. Quadrifilis
per fish per kg per fish per kg per fish per kg per fish per kgYou can also read