VOLATILE: Latest Third-Party Logistics Market Results and Predictions for 2020 Including Estimates for 190 Countries August 2020
←
→
Page content transcription
If your browser does not render page correctly, please read the page content below

VOLATILE:
Latest Third-Party Logistics
Market Results and Predictions
for 2020
Including Estimates for 190 Countries
August 2020

                          Phone: +1-800-525-3915
                          Website: www.3PLogistics.com
                          Email: Armstrong@3PLogistics.com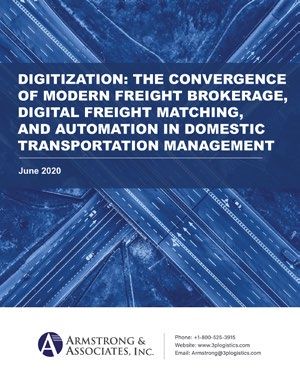
ABOUT ARMSTRONG & ASSOCIATES, INC.
Armstrong & Associates, Inc. (A&A) was established in 1980 to meet the needs of a newly deregulated domestic
transportation market. Since then, through its leading Third-Party Logistics (3PL) market research and history of
helping companies outsource logistics functions, A&A has become an internationally recognized key resource
for 3PL market information and consulting.

A&A’s mission is to have leading proprietary supply chain knowledge and market research not available
anywhere else. As proof of our continued work in supporting our mission, A&A’s 3PL market research is
frequently cited in media articles, publications, and securities filings by publicly traded 3PLs. In addition, A&A’s
email newsletter currently has over 88,000 subscribers globally.

A&A’s market research complements its consulting activities by providing continually updated data for analysis.
Based upon its unsurpassed knowledge of the 3PL market and the operations of leading 3PLs, A&A has
provided strategic planning consulting services to over 30 3PLs, supported 21 closed investment transactions,
and provided advice to numerous companies looking to benchmark existing 3PL operations or outsource
logistics functions.

All Rights Reserved.

No part of this publication may be reproduced, stored in a retrieval system or transmitted in any form by
any means, electronic, mechanical, photocopied, recorded or otherwise, without the prior permission of the
publisher, Armstrong & Associates, Inc.

The facts of this report are believed to be correct at the time of publication but cannot be guaranteed. Please
note that the findings, conclusions and recommendations that Armstrong & Associates delivers will be based
on information gathered in good faith from both primary and secondary sources, whose accuracy we are not
always in a position to guarantee. As such, Armstrong & Associates can accept no liability whatsoever for
actions taken based on any information that may subsequently prove to be incorrect.

          ©2020 Armstrong & Associates
U.S. 3PL MARKET

   Longer-Term Contracts Win in a Mixed
   2019, 2020 Faces Coronavirus Volatility and
   Economic Headwinds
   For 2020, Armstrong & Associates (A&A) continues to see negative impacts to the U.S. and Global Third-
   Party Logistics (3PL) Markets as the Coronavirus (COVID‐19) disrupts domestic 3PL operations and
   negatively effects both domestic and global supply chains.

   While it is extremely hard to model the impact of the Coronavirus, Q1 of 2020 was slightly negative for
   3PL providers (3PLs) as the economy began to deteriorate going into the pandemic after a soft 2019.
   In mid-March, suppliers started to close shop, and manufacturers and retailers drew down inventories.
   As seen in Asia and other regions, once the virus spread, there were significant operational disruptions
   and a general slowdown in economic activity. The first quarter saw some extra demand and resultant
   revenue increases within the Food & Grocery, Consumer, Internet Retailing, and Technological vertical
   industries as products were hoarded by consumers and computers and office equipment were
   purchased to adhere to stay-at-home orders.

   In May, as economic activity picked up with business reopenings, we have seen a significant “bullwhip”
   effect with significant order volume to replenish inventories and fill backorders driving volatile demand
   for domestic transportation. While air and ocean carrier capacity remains tight, international shipments
   have cooled somewhat after the Q2 surges in demand due to orders for personal protective gear and
   high-tech equipment to support remote workers.

   Looking back, 2019 went down as a mixed year for third‐party logistics in the U.S. After having
   an extraordinary year in 2018, as companies imported products and grew inventories to beat the
   implementation of Trump’s import tariffs during a good domestic economic environment, 2019 saw a
   year‐over‐year decline in transportation activity as the tariffs took hold.

   U.S. 3PL market net revenues (gross revenues less purchased transportation) grew 5.9% to $91.5 billion
   in 2019, while overall gross revenues declined 0.3%, bringing the total U.S. 3PL market to $212.8 billion.
   2019 marks the first year‐over‐year 3PL market contraction since its 16% decline in 2009 during the
   great recession. However, 2019’s slight market decline should be viewed in light of 2018’s extraordinary
   15.8% 3PL market growth which was unsurpassed since 2010 when the market bounced back from its
   16% decline during the great recession of 2009.

   For 2020, we expect overall 3PL gross revenues to work back to a lesser year-over-year decline of just
   under 1% and a slight net revenue increase for the year.

©2020 Armstrong & Associates                          3
U.S. 3PL MARKET

    Figure 1. U.S. 3PL Market 2005 - 2020E (US$ Billions)

                                 $240

                                 $220                                                                                                                          $213.5   $212.8
                                                                                                                                                                                 $208.0

                                 $200
                                                                                                                                                      $184.3
                                 $180
                                                                                                                                             $166.8
                                                                                                                                    $161.2
        Gross Revenue/Turnover

                                                                                                                           $157.8
                                 $160
                                                                                                                  $147.0
                                                                                                       $142.0
                                 $140                                                         $135.5
                                                                   $127.0            $127.5
                                                          $119.0
                                 $120            $113.6
                                        $104.2                              $107.1

                                 $100

                                  $80

                                  $60

                                  $40

                                  $20

                                   $0
                                          200      200      200      200      200      201      201        201      201      201      201      201      201      201      201      202
                                             5        6        7        8        9        0        1          2        3        4        5        6        7        8        9        0E

                                                                                                             Year

   Dedicated Contract Carriage (DCC)
   Within the asset‐heavy Dedicated Contract Carriage (DCC) 3PL market segment, gross revenue was
   off 3% for the first half of 2020 versus the first half of 2019 and net revenue saw a slight decline. DCC
   segment shipment volumes declined, but the overall impact was lessened due to the longer-term nature
   of its customer agreements. We anticipate the COVID-19 economic volatility in domestic transportation
   and increases in domestic transportation demand to positivity impact DCC growth for the remainder of
   the year as shippers look for a safe haven for capacity and as DCC providers continue to benefit from
   contracts negotiated prior to the pandemic.

   In 2018, the tight domestic motor carrier market led to 15.8% net revenue growth in DCC which
   continued into 2019 driving 12.1% net revenue growth for a total of $19.9 billion in 2019 DCC segment
   net revenues. DCC’s overall segment growth came even as many domestic truckload carriers, including
   large truckload carrier Celadon, sought bankruptcy protection. Most DCC contracts have one‐ to three-
   year terms with dedicated asset requirements. This makes them much “stickier” than standard shipper/
   carrier trucking contracts and were a strong contributor to the segment’s continued strong performance
   in 2019.

©2020 Armstrong & Associates                                                                           4
U.S. 3PL MARKET
Table 1. U.S. 3PL Market Growth by Segment
Gross Revenue % Change 2019
Net Revenue 1995-2019 Net
3PL Segment (Turnover) vs. 2018 Net
(US$ Billions) Revenue CAGR
(US$ Billions) Revenue
DTM 83.0 13.4 -0.3% 11.1%
ITM 58.7 22.1 -0.2% 10.8%
DCC 20.4 19.9 12.1% 7.6%
VAWD 47.2 36.1 9.2% 10.7%
Total* 209.3 91.5 5.9% 9.9%
*Total 2019 gross revenue (turnover) for the 3PL market in the U.S. is estimated at $212.8 billion. $3.5 billion is included for the
contract logistics software segment.
A&A’s market research shows dry van trailers being used for 70% of DCC truckloads, reefers 16%,
flatbeds 6%, and tankers and others 8%. Three‐fourths of major DCC providers have dry vans and
reefers. Half of major DCC providers have flatbeds. Customer trailers/containers are often used
especially for retail operations like Walmart. Other types of equipment include bulk tankers, curtain
sides, roller beds, end dumps, drop decks, and dry vans with lift gates.
The DCC segment leader J.B. Hunt Dedicated Contract Services (DCS), with 11,087 power units in
dedicated, posted above average net revenue growth of 24.6% to $2.7 billion pushing its DCC market
share to 13.5% on a net revenue basis. Penske Logistics, helped by its 2018 acquisition of EPES
Transport System, has grown into the third largest dedicated fleet with 5,530 power units.
Like J.B. Hunt, mid‐market DCC providers Black Horse Carriers and Marten Dedicated had a good year
with 14.3% and 18.8% growth respectively driving their DCC net revenues to $561 million and $266
million respectively.
We expect more modest DCC demand and growth for 2020. A lot will depend on underlying contract
truckload rates finding support in the market later in 2020 and disruptions from the Coronavirus on
shipper and DCC operations.
©2020 Armstrong & Associates 5U.S. 3PL MARKET
Table 2. Top 50 DCC 3PLs by 2019 Power Units*
Rank Provider DCC Power Units
1 J.B. Hunt DCS 11,087
2 Ryder DTS 6,000
3 Penske Logistics 5,530
4 Knight-Swift Transportation 5,347
5 Werner Logistics 4,630
6 NFI 4,100
7 Schneider Dedicated 3,917
8 Ruan DCT 3,820
9 Cardinal Logistics Holdings 3,155
10 Marten Transport 2,829
11 U.S. Xpress Enterprises 2,725
12 Solistica 2,339
13 Black Horse Carriers 2,235
14 C.R. England Dedicated 2,200
15 Day & Ross Transportation Group 1,950
16 Covenant Transportation Group 1,700
17 Averitt Express 1,385
18 UPS Supply Chain Solutions 1,382
19 DHL Supply Chain North America 1,300
20 Hub Group Dedicated 1,255
21 Commercial Warehousing 1,000
22 Cowan Logistics 766
23 Aim Integrated Logistics 744
24 Universal Logistics Holdings 726
25 CEVA Logistics U.S. 604
26 Odyssey Logistics & Technology 600
27 Bay & Bay Transportation 500
27 CRST Logistics 500
28 G&D Integrated 468
29 Lily Dedicated Logistics Systems 415
30 XPO Logistics 410
31 Dupré Logistics 366
32 Crowley Logistics 335
33 Warehouse Services 314
34 LEGACY Supply Chain Services 300
35 A. Duie Pyle 289
36 East Coast Warehouse & Distribution 260
37 LeSaint Logistics 250
38 Dart Advantage Logistics 238
39 ODW Logistics 230
40 Dimerco Express Group North America 221
40 Midwest Express Group 221
41 Saddle Creek Logistics Services 220
42 AMX 210
43 Atech Logistics 200
43 ITS Logistics 200
43 PAM Transport 200
43 Performance Team 200
44 Kenco Logistic Services 198
45 Ascent Global Logistics 171
*Power units are company reported or Armstrong & Associates, Inc. estimates.
Value-Added Warehousing and Distribution
(VAWD)
With COVID-19 stay-at-home orders and business shutdowns, Value-Added Warehousing and
Distribution (VAWD) had significant growth in business-to-consumer (B2C) e-commerce fulfillment
activity during the first half of 2020, while business-to-business (B2B) activity waned. Like DCC, VAWD
3PLs also benefit from being in longer-term business contracts (with an average term of three years).
Most VAWD 3PLs entered 2020 with full warehouses, so significant storage fees were still being paid.
As 2020 progressed and the shutdowns were initiated, in-and-out activity and non-e-commerce related
value-added service activity declined and overall inventory levels trended down leading to less storage
revenue. The overall impact for the first half of 2020 was a VAWD gross revenue decline of 7.1% and a net
revenue decrease of 5.8%. Q3 and Q4 should see incremental increases as the economy continues to
comeback in spits and spurts, and as VAWD customers rush to restore inventory levels.
©2020 Armstrong & Associates 6U.S. 3PL MARKET
2019 was a great year for VAWD with gross revenue growth of 9% to $47.2 billion. It was the best
growth the segment has realized since 2010 when VAWD posted a 12.9% increase. VAWD net revenues
grew 9.2% to $36.1 billion. The average contract warehousing agreement has a three‐year term, and
while there is significant market‐driven pricing pressure, it allows for pricing stability over the life of
the contract.
VAWD 3PLs continue to benefit from growth in retail e‐commerce business, which continues to be
the fastest growing domestic 3PL segment as detailed later in this report. Many VAWD 3PLs are
supporting retail brands’ strategies to manage their own order fulfillment channels and avoid being
captive to large e‐retailer platforms such as Amazon, Alibaba, and JD.com. Operationally, the growth in
in e‐commerce business has meant an expansion in multi-client warehousing/fulfillment operations;
many having footprints of under 100,000 square feet.
Beyond the current COVID-19 disruption, an ongoing headwind for VAWD 3PLs has been the “Amazon
Effect”. 3PLs are continuing to see increased competition from Amazon for labor and warehouse space.
This has dramatically impacted warehouse employee wages and lease rates in key distribution areas
such as Plainfield, Indiana and California’s Inland Empire. In turn, it is driving significant interest from
VAWD 3PLs to automate warehouses with autonomous robotic solutions.
Autonomous robots are supporting warehouse workers in picking and putaway. It seems like they are
dropping in price every day and have a short, less than one-year returns on investment (ROIs). With
some autonomous robots costing less than $1,000 per month to operate, the cost/benefit and positive
return on investment are increasing 3PLs interest in warehouse robots to support activities such as
picking, putaway, and cycle counting. This has benefited solutions providers such as Fetch Robotics,
Locus Robotics, and PINC Solutions.
In terms of the largest North American warehousing 3PLs, DHL Supply Chain leads the pack with 139
million square feet of warehousing space within North America, XPO is second with 90 million, Ryder
SCS is third with 56.4 million, NFI is fourth with 49.6 million, and GEODIS rounds out the top five with
44 million square feet. A&A’s complete list of the Top 50 largest North American VAWD 3PLs and their
capabilities can be found in our latest “Business of Warehousing in North America” report.
Domestic Transportation Management
(DTM)
For the first half of 2020, we saw an 8% drop in Domestic Transportation Management (DTM) 3PL
segment gross revenues versus the same period in 2019 and a 16% decline in net revenues as
shipment volumes dropped off across all modes. Heavily impacted were 3PLs with customers in
Automotive, Industrial, Building/Construction, and Elements/Raw Materials vertical industries. Reefer
and Dry Van Truckload fared better than construction dependent Flatbed.
In 2019, slack demand, abundant carrier capacity, and corresponding lower truckload rates drove the
non‐asset based Domestic Transportation Management (DTM) 3PL segment gross revenue down 4.1%
to $83 billion and net revenue decreased 0.3% to $13.4 billion. We anticipate that 2020 will end with an
even larger decline.
©2020 Armstrong & Associates 7U.S. 3PL Market
Eighty‐three percent of DTM’s total segment revenues come from freight brokerage with the remainder
coming from managed transportation. Freight brokerage primarily relies upon one‐year agreements with
virtually no volume commitments like those in DCC. 2019 registered the DTM segment’s only decline
since the great recession of 2009 when gross revenue fell 15% and net revenue was down 11.4%.
2019 was a stark contrast to 2018 when extraordinary domestic carrier demand, during the inventory
buildup prior to Trump’s import tariffs being implemented, led DTM to a whopping 20.6% gross revenue
increase.
The DTM segment is led by C.H. Robinson. Its North American Surface Transportation net revenues
decreased 5.7% from $1,906 million in 2018 to $1,797 million in 2019 and accounted for 13.4% of total
DTM segment net revenues. While it is still the segment leader, its market share as measured by net
revenue, is significantly lower than its market share of over 20% eight years ago. Part of C.H. Robinson’s
2020 strategy is to gain back some of the market share it has lost to competitors such as Total Quality
Logistics with 2019 net revenue of $687 million (down 0.6% from 2018), Echo Global Logistics with $386
million in net revenue (off 8.2% from 2018), and MODE Transportation which registered $285 million in
net revenue as it combined with SunteckTTS in 2019.
On the DTM “watch list” is rapidly growing Austin, Texas‐based Arrive Logistics and Nolan
Transportation Group (NTG). Arrive had year‐over‐year net revenue growth of 43.8% to $69 million and
2019 gross revenue of $550 million. Its CEO Matt Pyatt and President Eric Dunigan both came from
Command Transportation and founded Arrive in 2014 before Command’s $420 million sale to Echo
Global Logistics in June 2015. NTG recorded solid year‐over‐year net revenue growth of 16.7% to $125
million and grew its 2019 gross revenue to $875 million. Gryphon Investors bought a majority stake in
NTG through its portfolio company Transportation Insight in December 2018.
One thing Digital Freight Brokers such as Uber Freight, Convoy, and Transfix have done is to place an
emphasis on “digitalizing” DTM operations. While managed transportation (versus freight brokerage)
has been highly automated for years via transportation management systems (TMS), electronic data
interchange (EDI) and other systems interfaces, most freight brokerage operations still have many
manual processes. However, traditional DTMs have not been standing still and a plethora of technology
solutions have come to market over the past three years to augment traditional TMS’ and digitalize
freight brokerage operations.
The DTM 3PL market segment is becoming centered around creating digital experiences, workflow
automation, and optimizing customer and carrier focused service performance. Freight Brokerage is
made up of carriers and customers, both who want a mix of the best price, service performance, and
user experience. Pressure to evolve and digitalize increases as freight brokerage competitors adopt
strategies centered around automating operations and improving customer/carrier experiences via
digital platforms.
Digital Freight Brokers (DFBs) are defined by a set of distinct operating characteristics:
1. Intelligent Capacity Systems:
Digital freight brokerage operations are centered around what we define as “Intelligent Capacity
Systems”. At a given moment, millions of information points touch a freight brokerage. Data points
such as traffic, weather, historical carrier transactions pricing and performance, third-party capacity
markets, and other variables make the task of decision-making complex. Processing carrier capacity
©2020 Armstrong & Associates 8U.S. 3PL Market
data, making real-time routing decisions, and facilitating digital bookings are creating a new
category of systems used to augment TMS which we call “Intelligent Capacity Systems”. Intelligent
Capacity Systems use artificial intelligence and machine learning to perform transportation planning,
routing, and carrier selection functions traditionally managed by carrier sales staff in a buy/sell side
freight brokerage model.
2. Intelligent versus Rule-Based Systems:
Digital Freight Brokers that are on the right side of the paradigm shift away from rule-based systems
to A.I. and machine learning centric intelligent systems efficiently accounting for multiple data
streams, and continuously learning and matching shipments to carrier capacity in the cloud.
3. Digital User Experiences are Critical to Stickiness and Automation:
Best-in-class digital user experiences are becoming expected by motor carrier partners, and
shippers. Automated functions such as search, pricing, booking, and payments are becoming
expected. Freight broker digital experiences are expected to be on par with consumer digital
experiences, and the digital platforms are exploiting this gap. Straight-forward, user-friendly digital
experiences help build sticky carrier capacity and create more liquidity on a freight broker’s platform
allowing it to transact and execute bookings more easily. Early adaptors, who build liquidity, will reap
rewards in the form of valuable freight platforms with readily available carrier capacity.
4. Visibility Management Systems to Improve Customer Experiences and Exception Management:
What we define as “Visibility Management Systems” are further systems augmentations to core
TMS which provide real-time tracking information from multiple sources. Adopting these systems
improves the percentage of freight which is real-time tracked and is an important customer success
metric. In a digital freight brokerage environment, it is expected that shipments will be tracked in
real-time, and in-transit exceptions will be highlighted and resolved as they occur.
5. Connectable Digital Carrier Capacity Networks:
With key automated workflows such as pricing, carrier capacity management, and load booking,
DFBs can embed their carrier capacity networks into shipper transportation management systems
and routing guides to gain a competitive advantage in procuring freight.
We anticipate a not-so-distant future in Digital Freight Brokerage where shippers seamlessly tender
shipments to DFBs at a contractual or an automated spot price via interfaces between their TMS and
a freight broker’s Intelligent Capacity System. The Intelligent Capacity System will then select the
optimal carrier based upon detailed and data-rich smart carrier profiles, lane history, and multiple
other data points; it will then tender the load to a carrier, handle tender acceptance/rejects (re-
tendering), and book the load in the freight broker’s TMS. Using the TMS, an appointment will be
scheduled, if needed. This will trigger the Visibility Management System to initiate transit status
updates until delivery where back office automated proof of delivery information is uploaded into
a TMS and freight bill payment/carrier settlement is triggered. Transactional freight brokerage is
getting closer to the automation levels seen in Managed Transportation.
6. Feedback Loops:
The focus on digital experiences helps companies collect more capacity information leading to better
freight matches, more bookings, and carrier capacity information. Each transaction builds upon itself
laying the groundwork for increasingly optimal future transportation planning and execution.
©2020 Armstrong & Associates 9U.S. 3PL MARKET
7. Carrier Experiences are Key:
Positioned around personalized digital user experiences, Digital Freight Brokers are spending time
on building straight-forward, user-friendly digital experiences with carriers. Every Digital Freight
Broker is focused on data-collection to continuously drive improvements in its carrier experience
and freight matching. In addition, they have built out automated document handling and freight bill
payment/carrier settlement processes.
Serious action is being taken by approximately half of the Top 50 DTM/Freight Brokers to build a digital
freight brokerage platform. These freight brokers are responding by either building technologies in-
house, buying from third-party software vendors, or a mixture of both. However, of the freight brokers
we analyze, very few have developed and implemented a long-term strategy to achieve full digital
transformation.
One fact is certain, the attractiveness of digitalizing produces a significant ROI, if done correctly. The
traditional rule of thumb for freight brokers was to generate annual gross revenue of $1 million per
person. Through a well implemented digital transformation, our new benchmark is $4 million in gross
revenue per person per year.
As a result, freight brokerage executives and teams are looking to adopt technologies to improve load
booking experiences and operating metrics. Key digitalization success metrics include, but are not
limited to, increasing carrier reutilization (capacity “stickiness”), revenue per employee, percent of freight
real-time tracked, and percentage of freight digital bookings (full lifecycle from load available to booking
and dispatch).
Digital DTM / Freight Broker Key Performance Metrics:
• Carrier Reutilization
• Revenue per Employee
• % of Freight Real-Time Tracked
• % of Digital Bookings
This demand for improved experiences and more efficient operations has produced the emergence of
new DFB entrants into the DTM market. To effectively compete for customer freight and carrier capacity
in this digital era, freight brokers must strategically plan out a digitalization roadmap to stay competitive
in sourcing carrier capacity, and in acquiring and retaining customers.
International Transportation Management
(ITM)
The International Transportation Management (ITM) 3PL segment, consisting of air and ocean freight
forwarding and complementary value‐added services saw 3.8% gross revenue growth in the first half of
2020. In Q2 2020 ocean and air volumes were off, while air and ocean capacity both remained tight. This
resulted in significant rate increases over last year which drove up gross revenues. With the shutdown,
commercial airline belly space, which accounts for approximately 40% of total capacity, went away and
ocean carrier capacity tightened due to blank (cancelled) sailings out of Asia.
©2020 Armstrong & Associates 10U.S. 3PL MARKET Our expectation is that the ITM market will stay soft the remainder of the year with trade war headwinds adding to a volatile COVID-19 economic environment and reduced rates as more carrier capacity continues to come back online. In 2019, ITM posted a 5.2% gross revenue decline dropping to $58.7 billion and net revenue declined a slight 0.2% to $22.1 billion. Like its domestic brethren DTM, ITM 3PLs tend to contract on an annual basis for air and ocean freight forwarding services. Air freight was the weakest subsegment as the 2018 pre‐import tariff inventory build past and shippers converted to lower‐cost ocean freight, where possible. Ocean freight was also soft in 2019 after the 2018 inventory build. On the plus side, all of the tariff import duties changes keep ITM providers’ customs and compliance departments busy driving increased revenues in those operations. We anticipated a weak first half of 2020 due to extended New Year’s holidays in China and Coronavirus‐ driven supply chain disruptions globally. Once the Coronavirus lessens, we should see a peak in air freight demand. The ITM segment is also looking forward to the finalization of the U.S./China trade deal which could further reduce or eliminate import tariffs and improve trading conditions between the world’s top two economies. Expeditors International, the largest of the U.S.‐based freight forwarders, had a better than average 2019 with gross revenue increasing 0.5% to $8.2 billion and net revenue increasing 0.6% to $2.6 billion. Customs Brokerage and Other Services, which includes DTM and VAWD, was a bright spot in 2019 growing its gross revenue 16% to $3 billion and net revenue 6.4% to $1.2 billion. It is now Expeditors’ fastest growing business segment and has grown to 47% of Expeditors’ total net revenues. Airfreight dropped to 30% of 2019 net revenue and Ocean Freight was 23%. While 2019 was a negative growth year with a gross revenue decline of 6.9% and net revenue decline of 1.9%, C.H. Robinson’s Global Forwarding division has been expanding rapidly in ITM via a mix of acquisitions and organic growth. In 2011 it had net revenue of $100 million. To add significant capabilities and operational scale, it acquired $807 million ITM provider Phoenix International in 2012. From there, it added $251 million Aussie provider APC Logistics in 2016, $124 million Canadian ITM Milgram in 2017, and $84 million Madrid, Spain‐based Space Cargo in 2019. Global Forwarding has done a good job expanding its freight forwarding operations and developing solutions combining C.H. Robinson’s domestic and international transportation management capabilities. It has a 36% compound annual growth rate (CAGR) on cross selling business with C.H. Robinson’s North American Surface Transportation division. C.H. Robinson Global Forwarding’s 2019 gross revenue was $2.3 billion and its net revenue was $534 million. ©2020 Armstrong & Associates 11
U.S. 3PL MARKET

    Figure 2. U.S. 3PL Market Segment Net Revenues and CAGRs 2005 - 2020E*

                                $39,000
                                $37,000
                                $35,000
                                $33,0 00                                                                                                                     10.7%
                                $31,000
                                $29,000
                                $27,000
                                $25,000                                                                                                                      10.8%
               (US$ Millions)

                                $23,000
                                $21,000
                                $19,000
                                                                                                                                                             7.6%
                                $17,000
                                $15,000
                                $13,000
                                 $11,000
                                 $9,00 0                                                                                                                     11.1%
                                 $7,000
                                 $5,0 00
                                 $3,000
                                  $1,000
                                           20      20     20       20      20     20      20     20      20     20       20     20     20     20      20        20
                                             05      06     07       08      09     10      11     12      13     14       15     16     17     18      19        20
                                                                                                                                                                    E
                                                                 Value-Added Warehousing & Distribution (VAWD) - Asset Based
                                                                 Dedicated Contract Carriage (DCC) - Asset Based
                                                                 In ternational Transportation Man agemen t (ITM) - Non-Asset Based
                                                                 Domestic Transportation Management (DTM) - Non-Asset Based

   *CAGRs are from 1995-2019.

   U.S. segment net revenue compound annual growth rates range from 10.7% to 11.1% for all segments
   except DCC which is 7.6%. Although DCC is a fairly mature U.S. segment, it had the largest year-over-
   year net revenue increase of all segments in 2019 at 12.1% and was the second largest in 2018 increasing
   by 15.8% over 2017. For 2020, we anticipate just over 4% growth in DCC.

    Table 3. U.S. 3PL Segment Growth Predictions for 2020

                                                      2020E
                                                                                   2019 vs. 2020E                          2020E                     2019 vs. 2020E
                                                  Gross Revenue
      3PL Segment                                                                  Gross Revenue                        Net Revenue                   Net Revenue
                                                    (Turnover)
                                                                                      (YOY %)                          (US$ Billions)                   (YOY %)
                                                   (US$ Billions)
   DTM                                                                    78.0                          -6.0%                           12.3                            -8.2%
   ITM                                                                    58.3                          -0.7%                           22.0                            -0.3%
   DCC                                                                    21.2                           4.1%                            21.1                            6.0%
   VAWD                                                                   46.9                          -0.6%                           36.7                              1.7%
   Total*                                                            204.4                          -2.3%                              92.2                             0.7%
   *Total 2020 gross revenue (turnover) for the 3PL market in the U.S. is estimated at $208.0 billion. $3.6 billion is included for the
   contract logistics software segment.

©2020 Armstrong & Associates                                                               12
U.S. 3PL MARKET
Top U.S. Based 3PLs
C.H. Robinson, XPO, UPS, J.B. Hunt and Expeditors continue to hold their spots as the Top 5 U.S.-based
3PLs in our Top 50 list. Europe-based global supply chain managers, Kuehne + Nagel Americas and
DHL Supply Chain North America, resume at 6th and 7th place, respectively. U.S.-based Ryder, Hub and
Coyote, although in different places, round out the Top 10.
Some notable shifts in rank include major European player, DSV Panalpina Americas, now at 12th place
versus its pre-merger individual rankings of 21st for DSV Americas and 17th for Panalpina Americas.
The merger of U.S.-based domestic transportation managers, MODE Transportation and SunteckTTS,
rocketed the combined company into the Top 20. Individual rankings had MODE at 34th and SunteckTTS
at 37th last year. Lineage Logistics, helped by its acquisition of Preferred Freezer Services among others,
jumped 10 spots to 32nd.
New entrants to this year’s list are Neovia Logistics, Pilot Freight Services and SEKO Logistics. Up-and-
comers include ArcBest, Uber Freight and Redwood Logistics, all within the DTM segment, making next
year’s analysis that more interesting.
Table 4. Top 50 U.S. Based 3PLs by Gross Revenue
2019 Gross Revenue
Rank Provider
(US$ M)*
1 C.H. Robinson 14,630
2 XPO Logistics 12,144
3 UPS Supply Chain Solutions 9,302
4 J.B. Hunt (JBI, DCS & ICS) 8,788
5 Expeditors 8,175
6 Kuehne + Nagel (Americas) 7,060
7 DHL Supply Chain North America 4,364
8 Ryder Supply Chain Solutions 3,969
9 Hub Group 3,668
10 Coyote Logistics 3,600
11 Total Quality Logistics 3,394
12 DSV Panalpina (Americas) 3,225
13 Burris Logistics 3,100
14 Transplace 3,000
15 Schneider Logistics & Dedicated 2,650
16 Penske Logistics 2,600
17 GEODIS North America 2,540
18 FedEx Logistics 2,310
19 MODE Transportation 2,300
20 Transportation Insight 2,210
21 Echo Global Logistics 2,185
22 DB Schenker North America 2,178
23 Landstar 2,173
24 NFI 2,130
25 CEVA Logistics (Americas) 1,950
26 Americold 1,775
27 Ingram Micro Commerce & Lifecycle Services 1,750
28 Worldwide Express/Unishippers 1,675
29 BDP International 1,552
30 GlobalTranz Enterprises 1,532
31 Werner Enterprises Dedicated & Logistics 1,524
32 Lineage Logistics 1,440
33 Knight-Swift Transportation 1,395
34 Universal Logistics Holdings 1,260
35 syncreon 1,203
36 TransGroup Global Logistics 1,200
37 Radial 1,082
38 Odyssey Logistics & Technology 1,018
39 APL Logistics (Americas) 1,010
40 Ruan 1,002
41 Crane Worldwide Logistics 916
42 OIA Global 876
43 Nolan Transportation Group 875
44 Nippon Express (Americas) 855
45 Neovia Logistics 835
46 Pilot Freight Services 829
47 Radiant Logistics 813
48 Cardinal Logistics Management 805
49 SEKO Logistics 800
50 U.S. Xpress 797
*Revenues are company reported or Armstrong & Associates, Inc. estimates and have been converted to US$ using the average
annual exchange rate in order to make non-currency related growth comparisons.
©2020 Armstrong & Associates 13U.S. E-COMMERCE MARKET
U.S. E-Commerce Logistics Costs, 3PL
E-Commerce Revenues, and Amazon’s
Current Market Share
The Census Bureau of the U.S. Department of Commerce announced that U.S. retail e-commerce sales
for the third quarter of 2019 were $154.5 billion, an increase of 5% from the second quarter of 2019.
E-commerce retail now represents 9.8% of retail in the United States. The segment has grown at a 14.9%
CAGR over the last five years, with little sign of slowing. We expect a 14.4% CAGR through 2022.
E-commerce logistics costs in the U.S. are growing rapidly, with a 19.9% CAGR expected through 2020
and currently represent 9.9% of total U.S. logistics costs.
Major cost drivers include the continued and even more rapid expansion of e-commerce retail (both
domestic and cross-border) with COVID-19, logistics network development, increasingly complex last-
mile delivery, a shift to B2C in the parcel segment, a tight labor market, and the increasing importance of
reverse logistics.
Figure 3. U.S. E-Commerce Logistics Costs 2017 - 2020E (US$ Billions)
$201.8
$168.2
$141.6
$117.2
2017 2018 2019 2020E
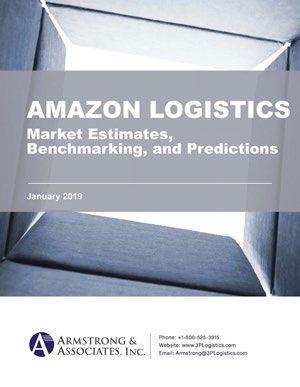
E-commerce is the most rapidly growing 3PL segment. Retailers rely on Amazon and third-party
logistics providers to help manage omnichannel and e-commerce operations. U.S. 3PL e-commerce
revenues reached $43.4 billion in 2019, and we expect a 28.0% CAGR through 2020 as e-commerce
purchases continue during the pandemic and companies continue to outsource versus build internal
fulfillment operations.
©2020 Armstrong & Associates 14U.S. E-COMMERCE MARKET
Figure 4. U.S. 3PL E-Commerce Revenues 2017 - 2020E (US$ Billions)
$53.3
$43.4
$35.1
$25.4
2017 2018 2019 2020E
With services ranging from domestic transportation management (DTM), value-added warehousing and
distribution (VAWD), international transportation management (ITM), and dedicated contract carriage
(DCC), 3PLs provide expertise and end-to-end services, which allow retailers to focus on their own core
competencies.
We estimate that Amazon’s U.S. 3PL revenues reached $25.5 billion in 2019 and that it will see 25%
growth in 2020 due to COVID-19 stay-at-home orders and the continuing trend for consumers to shop
online.
Figure 5. Amazon’s U.S. E-Commerce 3PL Market Revenue (US$ Billions)
$31.8
$25.5
$19.8
$12.6
2017 2018 2019 2020E
Because of Amazon’s unique market position, it is continuing to gain market share of the overall
U.S. E-Commerce 3PL Market segment even while many retail brands strategize on how to manage
their distribution channels more directly. Its market share is estimated to have grown from 50% of
the segment’s revenues in 2017 to 60% in 2020. While 3PLs are benefiting from the rapid growth in
e-commerce, Amazon’s market scale, brand strength, demand planning support for customers, and
transportation procurement cost advantage are leading to its above average 3PL growth.
©2020 Armstrong & Associates 15MERGERS & ACQUISITIONS
Figure 6. Amazon’s Market Share of the Overall U.S. E-Commerce 3PL Market Segment
59% 60%
56%
50%
2017 2018 2019 2020E
While we include Amazon in our e-commerce logistics costs and e-commerce 3PL revenue estimates,
we historically haven’t included it in our 3PL Market estimates given it is outlier businesswise (it is a
retail merchandiser, 3PL, and web services company) and does not price its services nor report its 3PL
revenue on comparable basis to the rest of the 3PL market.
Merger & Acquisition Activity
In 2019, there were 11 trackable, large 3PL M&A deals with purchase prices over $100 million1, three of
which were billion-dollar deals. Strategic buyers acquired niche players to round out service offerings
or expand footprints, financial buyers (such as Providence Equity Partners, Gryphon Investors, and CI
Capital Partners) continued to be motivated investors, and cold storage heated up the M&A landscape.
Figure 7. 3PL Acquisitions over $100 Million (1999 - 2019)
20
18 18
16
14
12 12
11 11
10
9 9
8
6 6
5 5 5 5 5
4 4 4
3 3 3
2 2
1 1
0 0
19 20 20 20 20 20 20 20 20 20 20 20 20 20 20 20 20 20 20 20 20
99 0 0 0 1 0 2 0 3 0 4 0 5 0 6 0 7 0 8 0 9 10 11 12 13 14 15 16 17 18 19
1 Mergers and acquisitions with disclosed or estimated terms at purchase price values at or over $100 million USD.
©2020 Armstrong & Associates 16MERGERS & ACQUISITIONS The largest deal in 2019 was the $5.5 billion merger between global supply chain manager and freight forwarder DSV and Swiss rival Panalpina. In 2016, DSV had acquired another rival, UTi Worldwide for $1.35 billion. Through strategic acquisitions and organic growth, DSV Panalpina is now ranked as the 6th top global 3PL. In April 2019, French container line CMA CGM successfully completed its public tender offer to acquire the 13th largest global 3PL, CEVA Logistics for $1.65 billion and become its majority shareholder. In May 2019, CEVA acquired CMA CGM Logistics (CC Log). The acquisition of CC Log is part of a restructuring done by CMA CGM as part of the integration of CEVA into CMA CGM. CC Log has 1,200 employees in 32 countries via directly-owned entities and cooperation agreements in 26 additional countries with significant presence in India, China, Australia and the US. The integration of CC Log into the CEVA Freight Management Business line is expected to add 170,000 TEUs in ocean freight. CEVA is also ramping up its expansion plans in Africa. In July 2020, it acquired majority stake in Belgian-based AMI Worldwide, which has more than 100 years of experience in that region. Kuehne + Nagel, the world’s second largest 3PL, has been expanding its perishables logistics business since 2017 with the acquisitions of perishables specialists Trillvane of Kenya, Commodity Forwarders of the U.S., and Panatlantic Logistics of Ecuador. In July 2019, Kuehne + Nagel acquired major Canadian perishables player Worldwide Perishable Canada Co. Perishables account for one-third of Kuehne + Nagel’s global air freight volumes. Kuehne + Nagel also acquired Jöbstl Group in July 2019 and Rotra in January 2020 to further expand its overland network throughout Europe. Major European 3PL Rhenus Group, continued its global expansion with numerous acquisitions in 2019. In January, it acquired UK-based Core Management Logistics and Italian-based Cesped. In March, it acquired South African-based World Net Logistics. From there, it expanded in the Americas region with the acquisition of Canadian-based Roadair Group (March) and U.S.-based Freight Logistics Group (April). The new Miami gateway enables Rhenus to consolidate and strengthen its network between North America and Latin America. Rhenus also acquired UK-based PSL Group in August 2019, and both Spanish logistics company LTK and Irish logistics company C+G Logistics in February 2020. There were two other billion dollar deals in 2019, both occurring with VAWD 3PLs. In May, Americold purchased Cloverleaf Cold Storage and Zero Mountain for $1.2 billion and a few days later Lineage Logistics purchased Preferred Freezer for $1 billion. Both 3PLs have had significant M&A deal volume since Americold went public in January 2018. In February 2019, Americold acquired the privately-held PortFresh Holdings, a leading temperature- controlled operator specialized in fresh produce trade primarily through the Port of Savannah. In May, it had the $1.2 billion Cloverleaf/Zero deal, noted above, as well as the acquisition of privately held Lanier Cold Storage for $81.9 million. In January 2020, Americold acquired Canada-based Nova Cold Logistics from Brookfield Business Partners for approximately $260 million. In February 2020, Americold expanded into Brazil via its joint venture with SuperFrio Armazéns Gerais SA (SuperFrio), a Brazilian temperature- controlled storage provider. Americold’s warehousing footprint now covers 178 temperature-controlled warehouses with 160 of them in the U.S., three in Canada, two in Argentina, six in Australia and seven in New Zealand. Americold also operates a national, refrigerated, less-than-truckload distribution operation in the U.S. ©2020 Armstrong & Associates 17
MERGERS & ACQUISITIONS

   Lineage Logistics was founded in 2008 by principal investment firm Bay Grove Capital. Lineage has
   grown from a single warehouse location in 2008 to the largest player in the temperature-controlled
   supply chain industry, both through organic growth and by executing nearly 40 acquisitions. In July
   2018, Lineage received a $700 million investment by Stonepeak Infrastructure Partners, D1 Capital
   Partners and current Lineage investors. This investment was followed by the acquisition of Yearsley
   Group (November 2018), the billion dollar Preferred Freezer deal (May 2019), Iowa Cold Storage; two
   facilities from Ryder Logistics and Western Distribution Services, and two Van Soest Coldstores in the
   Netherlands and Belgium (September 2019).

   In 2020, Lineage acquired private-equity owned Emergent Cold for $900 million. Emergent Cold recently
   acquired Polarcold, New Orleans Cold Storage, and Oxford Cold Storage and expands Lineage’s
   footprint of facilities in the Asia-Pacific region. Lineage also recently closed deals with Henningsen Cold
   Storage and Maines Paper & Food Service in May and has a pending deal with Ontario Refrigerated
   Services (ORS) of Toronto. Following the close of this transaction, which will mark its entrance into
   Canada, Lineage will have a global footprint of over 1.9 billion cubic feet of temperature-controlled
   capacity across over 300 facilities in 13 countries spanning North America, Europe, Asia, Australia, New
   Zealand, and South America.

   In January 2018, DTM 3PL Redwood Logistics merged with Simplified Logistics via a CI Capital Partners
   majority interest investment valued at $133 million. Since then, it has made four additional strategic
   acquisitions. It acquired the Phoenix-based Freight Management division of ROAR Logistics in April
   2018 and LTL-centric DTM LTX Solutions in January 2019. In February 2019, Redwood Logistics hit the
   large deal tracker again with its $100 million acquisition of freight broker Strive Logistics. And in its
   latest acquisition (May 2019), Redwood Logistics acquired managed transportation DTM Eminent Global
   Logistics.

   Redwood Logistics’ strategic acquisitions have rounded out its offering to include truckload and less-
   than-truckload (LTL) freight brokerage, managed transportation services, and transportation technology
   services. It has moved up from being the 25th largest DTM/freight broker in 2017 to the 17th largest in
   2019.

   Another sizable deal over $100 million was by refrigerated products distributor and cold storage provider,
   Burris Logistics. In April 2019, it acquired DTM Trinity Logistics for $280 million. Trinity provides truckload
   and LTL freight brokerage, intermodal, and Managed Transportation services. Burris Logistics also
   purchased freight broker Streamline Logistics in 2018.

   GlobalTranz, with strong private equity backing, has made 11 acquisitions since 2017. Throughout
   2019, GlobalTranz acquired Our Freight Guy (January), Circle 8 Logistics (April), and Global Freight
   Solutions (October). In January 2020, it acquired managed transportation provider Cerasis. GlobalTranz’s
   consistent organic growth and strategic combinations has moved it up the top DTM/Freight Brokerage
   rankings from 15th in 2016 to 11th in 2019.

©2020 Armstrong & Associates                            18
MERGERS & ACQUISITIONS

       Figure 8. GlobalTranz Ownership and Acquisition Timeline

                                                                                                                                      Our                                        Global
                                                                                                                                               Circle 8                                       Cerasis
                                                                                                                                    Freight                                      Freight
                                                                                                                                              Logistics
                                                                                                                                     Guy                                        Solutions
   ACQUISITIONS

                                                                                                                       AFN
                                                                                    AJR            SynchOne          Logistics
                                                                               Transportation

                    Global            Logistics   Worthington     Apex
                    Freight           Planning     Logistics    Logistics
                    Source            Services     Solutions     Group
   OWNERSHIP

                  Providence Equity Partners                                                    The Jordan Company                                        Providence Equity Partners

                  2017                                                      2018                                                 2019                                                       2020

   In 2018, private-equity firm Gryphon Investors replaced Ridgemont Equity Partners as Transportation
   Insight’s majority owner. A few months later, Gryphon Investors and Transportation Insight acquired
   freight broker Nolan Transportation Group from Ridgemont Equity Partners. Nolan operates as a
   sister company to Transportation Insight. In December 2019, Transportation Insight purchased freight
   brokerage Meridian Logistics (aka FreightPros) to roll into Nolan’s freight brokerage operations. In
   January 2020, Nolan acquired refrigerated truckload specialized freight brokerage Eagle Transportation.

   Private-equity firm York Capital Management acquired MODE Transportation from Hub Group in 2018.
   At the end of 2019, MODE acquired SunteckTTS, the product of the 2017 merger between freight brokers
   Sunteck and TTS. MODE Transportation is a major agent-centric DTM offering truckload, less-than-
   truckload, intermodal, rail, ocean, air, and managed transportation services with over 100 offices and
   agents across North America.

   In 2018, Universal Logistics Holdings, Inc., made four strategic acquisitions in the intermodal space.
   It acquired Specialized Rail Service Inc., Southern Counties Express, Fore Transportation and
   the Container Connection. In 2019, it made two acquisitions (Michael’s Cartage and Roadrunner
   Transportation Systems’ intermodal business). Intermodal, now its largest segment, grew 55% in 2019
   offsetting its Truckload segment drop of 20%.

   C.H. Robinson, the leading DTM in North America, continues to pick up niche players. In February 2019,
   it acquired The Space Cargo Group, a freight forwarding group that expands its presence in Spain and
   Columbia. And in May, C.H. Robinson acquired Italian-based Dema Service to expand its DTM services
   across Europe. In March 2020, C.H. Robinson picked up Roadrunner’s Prime Distribution Services (PDS)
   in a $225 million acquisition. (Roadrunner also sold its Stagecoach Cartage and Distribution to J.H.
   Rose Logistics in April 2020 and announced the proposed spinoff of Ascent Global Logistics.) PDS is a
   provider of retail consolidation and value-added warehousing and distribution services in North America.
   The addition expands C.H. Robinson’s retail consolidation business and adds some company-owned
   warehousing capability to its domestic service offering.

©2020 Armstrong & Associates                                                                          19
GLOBAL COSTS AND REVENUE
Global Logistcs Costs and Third-Party
Logistics Revenues
Global third-party logistics revenues reached $951 billion in 2019 resulting in a mere 2.1% increase over
2018 versus the 9.1% increase it registered in 2018. Due to COVID-19 and trade war headwinds, we are
expecting a 2.9% decrease in 3PL revenues globally.
Post-industrial societies have the largest 3PL revenues. Developing countries tend to have lower 3PL
revenues. The numbers reflect the greater outsourcing of functions to 3PLs in developed and more
economically sophisticated countries.
While developing economies in Africa, the Middle East and South America have shown growth spurts,
Asia Pacific is the largest overall region accounting for almost 41% of the total global logistics costs
(Europe’s are 18% and North America’s are 23%). The countries with the largest logistics spends are
China ($2.1 trillion) and the U.S. ($1.7 trillion).
Table 5. 2019-2020E Global Logistics Market and 3PL Segment Revenues by Country/Region (US$ Billions)
2019 Logistics 2019 3PL 2019 ITM 2019 VAWD 2019 TM 2020E Logistics 2020E 3PL 2020E ITM 2020E VAWD 2020E TM
Country/Region
Cost Revenue Revenue Revenue Revenue Cost Revenue Revenue Revenue Revenue
Algeria 28.5 2.2 0.6 0.6 1.0 26.9 2.1 0.6 0.5 1.0
Egypt 30.0 2.6 0.7 0.6 1.2 30.0 2.6 0.7 0.7 1.2
Morocco 17.9 1.5 0.4 0.4 0.7 17.1 1.5 0.4 0.4 0.7
Nigeria 71.9 5.2 1.5 1.3 2.4 73.2 5.4 1.4 1.4 2.5
South Africa 39.1 4.0 1.1 1.0 1.8 37.2 3.9 1.1 1.0 1.8
Sudan 5.4 0.4 0.1 0.1 0.2 5.4 0.4 0.1 0.1 0.2
Africa-Others 166.2 12.9 3.6 3.3 5.9 160.9 12.6 3.4 3.2 5.9
Africa Total 359.0 28.8 8.1 7.3 13.2 350.7 28.5 7.7 7.2 13.4
Australia 118.4 12.4 3.5 3.1 5.7 113.9 12.1 3.3 3.1 5.7
Bangladesh 49.5 4.1 1.1 1.0 1.9 51.7 4.3 1.1 1.1 1.9
Brunei Darussalam 1.9 0.2 0.0 0.0 0.1 1.8 0.2 0.0 0.0 0.1
Cambodia 4.4 0.3 0.1 0.1 0.2 4.5 0.4 0.1 0.1 0.2
China 2,050.3 216.3 60.5 54.7 99.2 2,023.7 215.5 60.2 54.5 104.2
Hong Kong 31.7 3.6 1.0 0.9 1.7 31.1 3.6 1.0 0.9 1.7
India 381.3 27.8 7.8 7.0 12.8 381.7 28.2 7.5 7.1 13.0
Indonesia 244.6 18.6 5.2 4.7 8.5 240.7 18.5 5.0 4.7 8.6
Japan 438.1 47.3 13.2 12.0 21.7 413.1 45.0 12.4 11.4 21.5
Lao P.D.R. 3.4 0.3 0.1 0.1 0.1 3.6 0.3 0.1 0.1 0.1
Macao SAR 5.5 0.6 0.2 0.1 0.3 5.3 0.5 0.1 0.1 0.3
Malaysia 47.5 3.5 1.0 0.9 1.6 47.1 3.5 0.9 0.9 1.6
Myanmar (Burma) 11.4 0.9 0.2 0.2 0.4 11.8 0.9 0.2 0.2 0.4
New Zealand 22.9 2.2 0.6 0.6 1.0 21.3 2.1 0.6 0.5 1.0
Philippines 46.4 3.4 0.9 0.9 1.6 47.4 3.5 0.9 0.9 1.6
Singapore 30.8 3.7 1.0 0.9 1.7 29.8 3.6 1.0 0.9 1.7
South Korea 146.5 16.7 4.7 4.2 7.7 138.7 15.9 4.4 4.0 7.6
Sri Lanka 16.2 1.1 0.3 0.3 0.5 16.4 1.2 0.3 0.3 0.5
Taiwan 52.9 5.9 1.7 1.5 2.7 51.7 5.8 1.6 1.5 2.7
Thailand 79.4 6.0 1.7 1.5 2.8 79.5 6.1 1.6 1.5 2.8
Vietnam 52.3 4.1 1.1 1.0 1.9 54.3 4.3 1.1 1.1 1.9
Asia Pacific-Others 15.4 1.2 0.3 0.3 0.5 15.8 1.2 0.3 0.3 0.6
Asia Pacific Total 3,850.7 380.2 106.3 96.2 174.3 3,784.8 376.8 103.9 95.3 179.8
©2020 Armstrong & Associates 20GLOBAL COSTS AND REVENUE
2019 Logistics 2019 3PL 2019 ITM 2019 VAWD 2019 TM 2020E Logistics 2020E 3PL 2020E ITM 2020E VAWD 2020E TM
Country/Region
Cost Revenue Revenue Revenue Revenue Cost Revenue Revenue Revenue Revenue
Kazakhstan 25.7 2.2 0.6 0.5 1.0 23.4 2.0 0.6 0.5 1.0
Russia 263.7 21.1 5.9 5.3 9.7 226.5 18.3 5.3 4.6 9.2
Ukraine 23.9 1.9 0.5 0.5 0.9 22.8 1.9 0.5 0.5 0.9
CIS-Others 44.7 3.5 1.0 0.9 1.6 41.2 3.3 0.9 0.8 1.6
CIS Total 358.0 28.7 8.0 7.3 13.2 313.9 25.5 7.3 6.5 12.6
Austria 37.4 4.0 1.1 1.0 1.8 35.3 3.8 1.0 1.0 1.7
Belgium 41.5 4.4 1.2 1.1 2.0 38.0 4.1 1.0 1.0 1.8
Czech Republic 22.0 2.4 0.7 0.6 1.1 20.5 2.3 0.6 0.6 1.0
Denmark 30.4 3.2 0.9 0.8 1.5 28.8 3.0 0.8 0.8 1.3
Finland 22.7 2.4 0.7 0.6 1.1 21.1 2.3 0.6 0.6 1.0
France 237.7 24.8 6.6 6.3 12.4 214.2 22.4 5.4 5.7 10.4
Germany 313.3 32.9 9.1 8.3 16.2 298.3 31.4 7.8 7.9 14.5
Greece 26.4 2.4 0.7 0.6 1.1 24.0 2.2 0.6 0.6 1.0
Hungary 17.1 1.9 0.5 0.5 0.9 16.1 1.8 0.5 0.5 0.8
Ireland 29.8 3.5 1.0 0.9 1.6 27.9 3.3 0.8 0.8 1.4
Italy 178.7 18.4 4.9 4.7 9.2 159.4 16.4 4.0 4.2 7.7
Netherlands 67.0 9.8 2.6 2.5 4.9 62.7 9.2 2.2 2.3 4.3
Norway 37.3 3.8 1.1 1.0 1.8 34.7 3.6 0.9 0.9 1.6
Poland 57.4 5.8 1.6 1.5 2.7 54.8 5.6 1.4 1.4 2.5
Portugal 24.9 2.5 0.7 0.6 1.1 23.0 2.3 0.6 0.6 1.0
Romania 28.2 2.8 0.8 0.7 1.3 27.3 2.8 0.7 0.7 1.2
Spain 114.8 11.7 3.1 3.0 5.9 102.7 10.5 2.5 2.7 4.9
Sweden 41.5 4.3 1.2 1.1 2.0 39.5 4.1 1.0 1.0 1.8
Switzerland 59.5 6.3 1.8 1.6 2.9 55.0 5.8 1.5 1.5 2.5
United Kingdom 232.9 22.9 6.1 5.8 11.5 209.2 20.6 5.0 5.2 9.6
Europe-Others 72.5 7.2 2.0 1.8 3.3 67.8 6.8 1.7 1.7 3.0
Europe Total 1,693.0 177.6 48.5 44.9 86.3 1,560.2 164.0 40.5 41.5 74.9
Iran 74.3 5.9 1.7 1.5 2.7 70.3 5.7 1.6 1.4 2.7
Israel 43.8 4.3 1.2 1.1 2.0 41.4 4.1 1.1 1.0 2.0
Pakistan 44.3 3.6 1.0 0.9 1.7 42.4 3.5 1.0 0.9 1.7
Saudi Arabia 101.3 9.2 2.6 2.3 4.2 96.0 8.8 2.4 2.2 4.2
Turkey 92.2 8.7 2.4 2.2 4.0 100.2 9.5 2.4 2.4 4.2
United Arab Emirates 40.6 4.1 1.2 1.0 1.9 36.9 3.8 1.1 1.0 1.8
Middle East-Others 122.5 10.1 2.8 2.6 4.6 119.1 10.0 2.7 2.5 4.7
Middle East Total 519.0 46.0 12.9 11.6 21.1 506.3 45.4 12.3 11.5 21.3
Canada 155.8 16.4 4.5 4.1 7.5 144.1 15.3 4.2 3.9 7.4
Mexico 152.9 16.4 4.5 4.1 7.5 144.3 15.6 4.3 3.9 7.5
United States 1,715.2 212.8 58.7 47.2 103.4 1,617.4 208.0 58.3 46.9 99.2
North America-Others 79.2 6.7 1.9 1.7 3.1 75.5 6.4 1.8 1.6 3.1
North America Total 2,103.0 252.2 69.6 57.2 121.6 1,981.3 245.3 68.5 56.3 117.1
Argentina 53.5 4.9 1.4 1.2 2.3 75.3 7.0 1.6 1.8 2.8
Brazil 214.3 19.9 5.6 5.0 9.1 205.9 19.4 5.3 4.9 9.1
Chile 33.8 3.3 0.9 0.8 1.5 33.0 3.2 0.9 0.8 1.5
Colombia 41.0 3.5 1.0 0.9 1.6 39.4 3.4 0.9 0.9 1.6
Peru 28.6 2.5 0.7 0.6 1.1 25.4 2.2 0.6 0.6 1.1
Venezuela 8.3 0.6 0.2 0.2 0.3 6.3 0.5 0.1 0.1 0.3
South America-Others 40.3 3.3 0.9 0.8 1.5 37.0 3.1 0.9 0.8 1.5
South America Total 419.8 38.0 10.6 9.6 17.4 422.2 38.7 10.3 9.8 17.8
Grand Total 9,302.6 951.6 264.1 234.1 447.0 8,919.5 924.2 250.6 228.1 436.9
Sources: International Monetary Fund WEO Oct 2019, OECD (2020), Nominal GDP forecast, and Armstrong & Associates, Inc.
Databases
©2020 Armstrong & Associates 21TOP 50 GLOBAL 3PLS Top 50 Global 3PLs Besides a few shifts in rank, not much has changed within the top 10 global 3PLs on our list from 2018 to 2019. Going further down the list though, you will notice CJ Logistics replaced DACHSER for 12th and DACHSER fell three spots to 15th. Since 2013, CJ Logistics has accelerated its global expansion strategy in an effort to become a Top 5 Global 3PL by aggressively pursuing mergers and acquisitions in China (CJ Smart Cargo, CJ Rokin Logistics, CJ Speedex Logistics), Malaysia (CJ Century Logistics), India (CJ Darcl Logistics) the Middle East (CJ ICM Logistics) and Vietnam (CJ Gemadept Logistics, CJ Gemadept Shipping). In mid-2018, CJ Logistics expanded its North American operations with the acquisition of Chicago-based VAWD 3PL, DSC Logistics. The acquisition helped CJ Logistics expand its North American footprint and customer base, and allows it to cross sell international transportation management and other services to existing DSC customers. In turn, current DSC customers also benefit from CJ Logistics’ extensive international transportation management capabilities and large Asian network, which includes CJ Rokin Logistics one of the largest integrated 3PLs in China. CJ Logistics’ strategy appears to be working as it rose seven spots from its 19th place rank last year. It also landed at 20th on our Top 25 Global Freight Forwarders list this year which it had not made previously. Another major Greater China-based provider, Kerry Logistics, scaled the list this year hitting top 20 status, surpassing France-based Bolloré Logistics and Japan’s Kintetsu World Express. Kerry also hit 10th on our Top 25 Global Freight Forwarder this year. Individually, it ranked 15th for air freight and 6th for ocean freight volumes handled in 2019. Kerry Logistics has been nurturing its acquisition strategy by acquiring several freight forwarders allowing it to expand internationally in countries such as Spain, Italy, Germany, Africa and the U.S. Its joint venture with Dubai-based freight forwarder, Globalink Logistics DWC LLC, expands Kerry Logistics’ coverage in Central Asia and the CIS region. Other recent joint ventures include expansion in e-commerce and food/cold chain logistics. In August 2019, the group acquired a majority interest in Turkey’s ASAV Logistics Services to further the expansion of its global network. On March 31, 2020, the group completed the acquisition of the remaining 49% in Apex, the third largest NVOCC in terms of volume from Asia to the U.S. in 2019, at a consideration of approximately $176 million. New to this year’s list are MODE Transportation, SAIC Anji Logistics, and Ingram Micro Commerce & Lifecycle Services. As in our top U.S.-based 3PLs list, MODE was helped by its merger with SunteckTT. ©2020 Armstrong & Associates 22
TOP 50 GLOBAL 3PLS

   SAIC Anji Logistics provides logistics services for the Shanghai Automotive Industry Corporation (SAIC)
   group as well as outside clients primarily in the automotive and industrial verticals. In order to provide
   a more apples-to-apples comparison to the other providers considered, SAIC Anji Logistics’ in-house
   logistics revenues were capped at 50% for the list.

   As an e-commerce and reverse logistics specialist, it’s no surprise that Ingram Micro Commerce &
   Lifecycle Services made this year’s list. With $1.5 billion in 2018 revenue, it just missed last year’s
   list coming in 53rd. However, continued growth in B2C e-commerce, which is 70% of its business,
   has boosted it seven places causing TM-focused providers BDP International and Knight-Swift
   Transportation to drop from the list.

    Table 6. Top 50 Global 3PLs by Gross Revenue

                                                                                         2019 Gross Revenue
                                     Rank                     Provider
                                                                                               (US$ M)*
                                       1    DHL Supply Chain & Global Forwarding                       27,302
                                       2    Kuehne + Nagel                                             25,875
                                       3    Nippon Express                                             19,953
                                       4    DB Schenker                                                19,349
                                       5    C.H. Robinson                                              14,630
                                       6    DSV Panalpina                                              14,355
                                       7    XPO Logistics                                              12,144
                                       8    Sinotrans                                                  10,549
                                       9    UPS Supply Chain Solutions                                  9,302
                                      10    J.B. Hunt (JBI, DCS & ICS)                                  8,788
                                      11    Expeditors                                                  8,175
                                      12    CJ Logistics                                                7,173
                                      13    CEVA Logistics                                              7,124
                                      14    Hitachi Transport System                                    6,472
                                      15    DACHSER                                                     6,408
                                      16    GEODIS                                                      6,379
                                      17    Toll Group                                                  6,260
                                      18    Damco/Maersk Logistics                                      5,965
                                      19    GEFCO                                                       5,365
                                      20    Kerry Logistics                                             5,274
                                      21    Bolloré Logistics                                           5,180
                                      22    Kintetsu World Express                                      5,067
                                      23    Yusen Logistics/NYK Logistics                               4,410
                                      24    Agility                                                     4,122
                                      25    Ryder Supply Chain Solutions                                3,969
                                      26    Hub Group                                                   3,668
                                      27    Coyote Logistics                                            3,600
                                      28    Imperial Logistics                                          3,507
                                      29    Total Quality Logistics                                     3,394
                                      30    Burris Logistics                                            3,100
                                      31    Transplace                                                  3,000
                                      32    Hellmann Worldwide Logistics                                2,974
                                      33    Schneider Logistics & Dedicated                             2,650
                                      34    Sankyu                                                      2,613
                                      35    Penske Logistics                                            2,600
                                      36    SAIC Anji Logistics**                                       2,530
                                      37    FedEx Logistics                                             2,310
                                      38    MODE Transportation                                         2,300
                                      39    Transportation Insight                                      2,210
                                      40    Echo Global Logistics                                       2,185
                                      41    Landstar                                                    2,173
                                      42    NFI                                                         2,130
                                      43    Mainfreight                                                 2,038
                                      44    Groupe CAT                                                  1,925
                                      44    Fiege Logistik                                              1,925
                                      45    Americold                                                   1,775
                                      46    Ingram Micro Commerce & Lifecycle Services                  1,750
                                      47    ID Logistics Group                                          1,737
                                      48    Worldwide Express/Unishippers                               1,675
                                      49    APL Logistics                                               1,630

   *Revenues are company reported or Armstrong & Associates, Inc. estimates and have been converted to US$ using the average
   annual exchange rate in order to make non-currency related growth comparisons.
   **In-house logistics revenues were capped at 50% for fairness.

©2020 Armstrong & Associates                                             23
You can also read