Temperature Tolerance and Thermal Environment of European Seed Bugs - MDPI
←
→
Page content transcription
If your browser does not render page correctly, please read the page content below
insects
Article
Temperature Tolerance and Thermal Environment of
European Seed Bugs
Helmut Käfer 1, * , Helmut Kovac 1, * , Nikolay Simov 2 , Andrea Battisti 3 ,
Bettina Erregger 1,4 , Arne K. D. Schmidt 1,5 and Anton Stabentheiner 1, *
 1    Institute of Biology, University of Graz, 8010 Graz, Austria
 2    National Museum of Natural History, 1000 Sofia, Bulgaria; myrmedobia@gmail.com
 3    School of Agricultural Sciences and Veterinary Medicine, University of Padova, 35122 Padova, Italy;
      andrea.battisti@unipd.it
 4    Institute of Animal Nutrition, Livestock Products, and Nutrition Physiology, University of Natural
      Resources and Life Sciences, 1180 Vienna, Austria; bettina.erregger@gmail.com
 5    AGES, The Austrian Agency for Health and Food Safety, 1220 Vienna, Austria; arne.kd.schmidt@gmail.com
 *    Correspondence: helmut.kaefer@uni-graz.at (H.K.); helmut.kovac@uni-graz.at (H.K.);
      anton.stabentheiner@uni-graz.at (A.S.)

 Received: 17 February 2020; Accepted: 17 March 2020; Published: 20 March 2020

 Abstract: Heteroptera, or true bugs populate many climate zones, coping with different environmental
 conditions. The aim of this study was the evaluation of their thermal limits and derived traits,
 as well as climatological parameters which might influence their distribution. We assessed the
 thermal limits (critical thermal maxima, CTmax , and minima, CTmin ) of eight seed bug species
 (Lygaeidae, Pyrrhocoridae) distributed over four Köppen–Geiger climate classification types (KCC),
 approximately 6◦ of latitude, and four European countries (Austria, Italy, Croatia, Bulgaria). In test
 tubes, a temperature ramp was driven down to −5 ◦ C for CTmin and up to 50 ◦ C for CTmax (0.25 ◦ C/min)
 until the bugs’ voluntary, coordinated movement stopped. In contrast to CTmin , CTmax depended
 significantly on KCC, species, and body mass. CTmax showed high correlation with bioclimatic
 parameters such as annual mean temperature and mean maximum temperature of warmest month
 (BIO5), as well as three parameters representing temperature variability. CTmin correlated with mean
 annual temperature, mean minimum temperature of coldest month (BIO6), and two parameters
 representing variability. Although the derived trait cold tolerance (TC = BIO6 − CTmin ) depended on
 several bioclimatic variables, heat tolerance (TH = CTmax − BIO5) showed no correlation. Seed bugs
 seem to have potential for further range shifts in the face of global warming.

 Keywords: true bugs; thermal limits; distribution; bioclimatic parameters; climate

1. Introduction
     Heteroptera, or true bugs, are a widely distributed, highly diverse insect taxon with approximately
45,300 [1] species worldwide. They populate every climate zone from arctic to desert [2–4], showing
great ability to cope with a variety of environmental factors. This leads to a substantial potential for
invasiveness, and indeed many bug species are known to be highly invasive. For example, Halyomorpha
halys, an Asian stink bug invading Europe and North America, made it to the top four “most wanted”
species list in the USA, inflicting economic damage of USD 37 million to tree fruit production in
2010 [5]. However, although some species thrive over wide latitudinal ranges, other closely related
species are more restricted in their distribution range (e.g., Orsillus depressus: Southern and Central
Europe, northwards until Scandinavia; O. maculatus: Southern Europe, around the Mediterranean and
Black Sea) [6]. Species such as Oxycarenus lavaterae are known to have spread from their Mediterranean

Insects 2020, 11, 197; doi:10.3390/insects11030197                               www.mdpi.com/journal/insects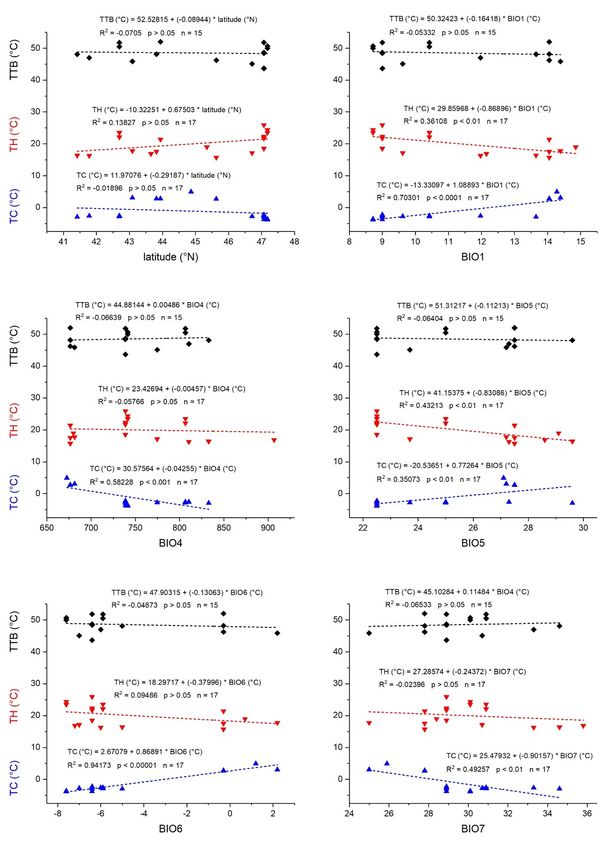
Insects 2020, 11, 197 2 of 17
origins rather recently and are on their way north- and eastwards [7–11]. They seem to benefit from
climate change, with its higher annual mean temperatures, as well as human behavior, which facilitates
dispersion (often along traffic routes) and settlement (e.g., through extensive plantings of Tilia trees,
a host plant of Oxycarenus in urban environments).
Temperature is a main parameter for thriving and spread of ectothermic insects [12–14]. Within the
insects’ favorable temperature zone, it determines development and reproduction. Temperatures
outside of this favorable zone hinder and become lethal at a certain point [15]. In temperate
climate regions, the change from favorable to unfavorable is mainly a seasonal occurrence, with low
temperatures during the winter and possible high temperature extremes during summer. Adaptations
such as hibernation or winter diapause, and aestivation lets the organisms cope with these adverse
environmental conditions.
The climate variability hypothesis states that organisms exposed to higher variations in
their thermal environment show more tolerance to extreme temperatures [16]. In this regard,
the organisms’ critical thermal maxima show less variation than their critical thermal minima [17–19].
Geographical latitude, seasonality in temperature, and also elevation above sea level are thought to
correlate with the animals’ temperature tolerance breadth and be a valid measurement for climate
variability (see for instance [18,20–23]).
Several attempts have been made to assess and model the distribution of ectotherms and
endotherms in connection with thermal tolerance and macro-ecological scales such as climate
parameters and latitude [18,20,24–28]. One problem correlating thermal traits of animals with
climatic measurements are the differences in scale (climate data point = animal size × 10,000 [29]).
Contradictory hypotheses regarding the species’ susceptibility to climate warming (e.g., [30] vs. [31])
show that large-scale climate-based studies might be insufficient to describe and predict biological
effects. The assessment of microclimatic habitats as buffers of environmental conditions seems to be
more suitable. However, even microclimate measurements do not always show the temperatures the
animals are exposed to [32,33], because in reaction to uncomfortable conditions the animals show
various physiological (e.g., evaporation [34–36]) and/or behavioral reactions (e.g., by burrowing or
simply moving away [37,38]). Such micro-scale measurements, however, are often not feasible, or
data are not accessible. For medium to large scale assessment of physiological and behavioral factors
driving insect distribution and dispersion, therefore, standard meteorological data and their bioclimatic
classifications are often the only accessible data source to study physiological and behavioral responses
in order to gain a deeper understanding of the underlying mechanisms of animal survival under
extreme environmental conditions [39]. Critical thermal limits are commonly used physiological
parameters to assess factors driving insect dispersion and distribution. One way to describe upper
and lower thermal limits of organisms is the definition of temperature when voluntary, coordinated
movement stops [40–42], rendering the animal finally unable to react to an adverse environment via
locomotion (i.e., moving away to another, more habitable part of its surroundings).
The aim of this study was the evaluation of thermal tolerance traits (critical thermal maximum
and minimum) of some common bugs from the temperate central Europe and the neighboring
Mediterranean climate zones. The data were analyzed in relation to climatological and geographical
parameters, as well as phylogenetic traits. With this knowledge, we wanted to test whether the climate
variability hypothesis is applicable for this insect group, and whether their thermal traits are the basics
for their high potential of invasiveness.
2. Materials and Methods
2.1. Animals
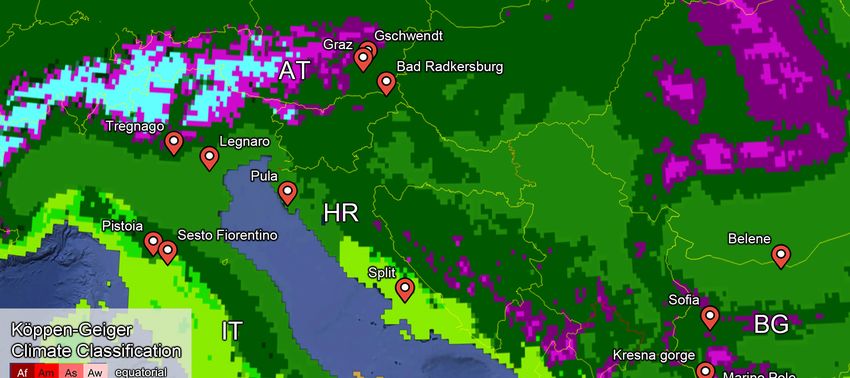
Eight bug species common in Europe (Table 1) were sampled in four Köppen–Geiger climate
(KCC) regions in Austria, Italy, Croatia, and Bulgaria during the cold season, from autumn (end of
September) to winter (mid of January) in the years 2013, 2014, 2016, and 2018 (Figure 1, Table 2, Table S1).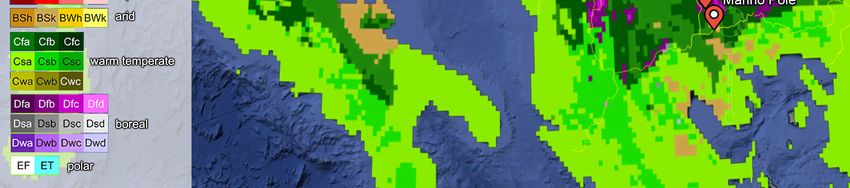
Insects 2020, 11, 197                                                                                           3 of 17

These bug species are distributed over wide areas of Europe, some restricted to the southern and
central parts, and some spread to regions north of the polar circle [43]. All physiological measurements
were performed on adult individuals at the laboratory in Austria. The animals were transported to the
laboratory by ourselves or were delivered via express mail within 3 to 5 days. The bugs were sampled
randomly at the respective sample sites. Sex of the individuals was not determined. All individuals
were similar in their external characteristics (habitus, size, body mass). Therefore, we assume that we
mapped a natural gender relationship of the respective populations. Individuals that were noticeably
behaviorally impaired (possibly by transport) were excluded from the evaluation. This as well as
different numbers of sampled individuals resulted in an inconsistent number (n) per species/sample
site/experiment. All experiments were conducted immediately after the individuals arrived in our
laboratory. All bug sampling, transportation, and experiments took place in concurrence with national
and EU regulations.

                             Table 1. Bug species sampled and their systematic order [6,43].

                   Species                     Subfamily             Family          Suborder          Order
            Arocatus longiceps
                                               Lygaeinae
       Melanocoryphus albomaculatus
             Orsillus depressus
                                               Orsillinae
             Orsillus maculatus                                     Lygaeidae
                                                                                    Heteroptera      Hemiptera
            Oxycarenus lavaterae             Oxycareninae
          Rhyparochromus vulgaris
                                           Rhyparochrominae
           Scolopostethus pictus
             Pyrrhocoris apterus
 Insects 2020, 11, x
                                                                  Pyrrhocoridae                                  4 of 19

       Figure1.1.Sample
      Figure      Samplelocations
                          locationsand
                                    andclimate regions
                                         climate regionsaccording to to
                                                          according   thethe
                                                                           Köppen–Geiger
                                                                             Köppen–Geiger climate classification
                                                                                              climate classification
      (KCC);
       (KCC);map
               mapmodified
                    modified from
                               fromGoogle
                                     GoogleEarth Pro,
                                             Earth    KCC
                                                   Pro, KCCoverlay from
                                                              overlay  fromhttp://koeppen-geiger.vu-wien.ac.at/.
                                                                              http://koeppen-geiger.vu-wien.ac.at/
       [48].

 2.3. Critical Thermal Maximum (CTmax)
     We used a similar experimental setup as in Section 2.2, without the shaking apparatus activated.
 Stimulation was not necessary, as the insects were always active at higher temperatures. Up to 10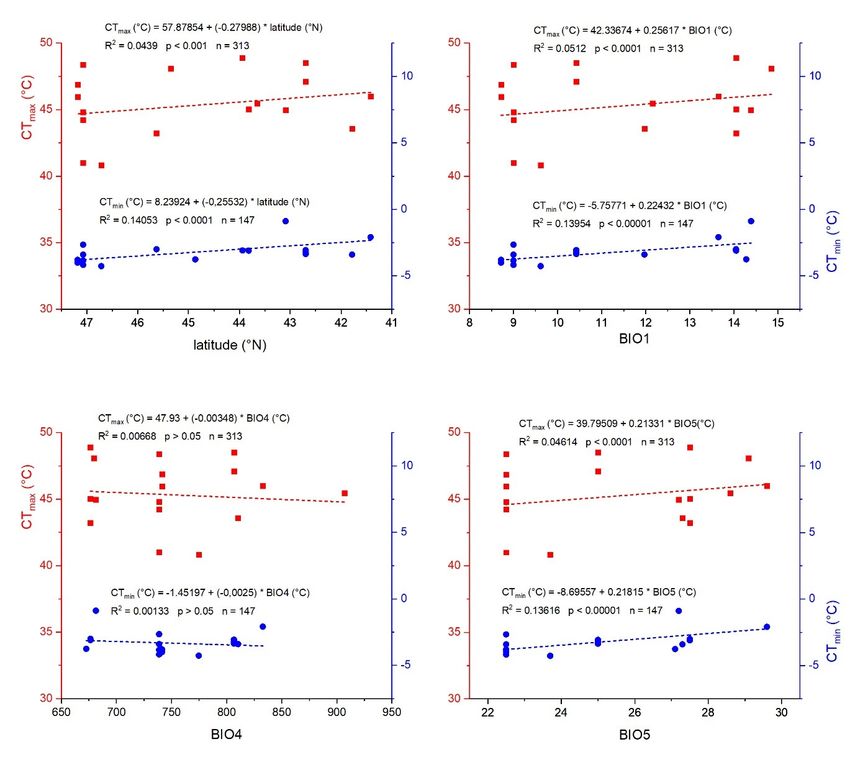
Insects 2020, 11, 197                                                                                                                                             4 of 17

      Table 2. Species, sample location and Köppen–Geiger climate classification (KCC), mean body mass with SD, critical thermal minima and maxima (CTmin , CTmax )
      with SD, thermal tolerance breadth (TTB), and heat and cold tolerance (TH, TC) of the true bugs assessed.

               Species                                      Lat (◦ N)/Long     Mass         CTmin ± SD          Mass         CTmax ± SD         TTB     TH        TC
                                     Location - KCC
                                                                  (◦ E)        (mg)         (◦ C)     n         (mg)         (◦ C)     n        (◦ C)   (◦ C)    (◦ C)
         Arocatus longiceps          Graz (AT) - Cfb         47.071/15.44    6.6 ± 1.1    −4.2 ± 0.4   8      6.7 ± 1.3    44.2 ± 0.5   30      48.4     21.7    −2.2
                                     Sofia (BG) - Cfa       42.696/23.334    6.8 ± 0.9    −3.1 ± 0.8   6          -             -        -       -        -      −2.8
                                 Kresna gorge (BG) - Cfa    41.783/23.155    3.6 ± 0.6    −3.4 ± 1.6   2       3.6 ± 1     43.6 ± 0.6   25      47.0     16.3    −2.6
  Melanocoryphus albomaculatus       Pistoia (IT) - Cfa     43.939/10.849    14.4 ± 3.4   −3.1 ± 0.3   9      14.6 ± 2.6   48.9 ± 0.5   14      52.0     21.4     2.8
         Orsillus depressus           Graz (AT) - Cfb        47.071/15.44    9.7 ± 1.8    −3.8 ± 0.4   9      9.2 ± 1.6    44.8 ± 0.8   10      48.6     22.3    −2.6
         Orsillus maculatus        Tregnago (IT) - Cfb      45.629/11.095    15.2 ± 4.6   −3.0 ± 0.7   5      10.7 ± 2.4   43.2 ± 1.2   25      46.2     15.7    2.7
                                  Marino Pole (BG) - Bsk    41.419/23.331    11.5 ± 2.5   −2.1 ± 2.6   7      11.4 ± 2.7   46.0 ± 0.4   10      48.1     16.4    −2.9
       Oxycarenus lavaterae          Sofia (BG) - Cfa       42.696/23.334    2.5 ± 0.8    −3.2 ± 2.0   8      3.1 ± 0.5    48.5 ± 0.3   19      51.7     23.5    −2.7
                                     Graz (AT) - Cfb         47.071/15.44    4.0 ± 0.7    −3.4 ± 2.1   8      3.4 ± 0.8    48.4 ± 0.2   19      51.8     25.9    −3.0
                                    Legnaro (IT) - Cfa      45.346/11.964        -            -        -      4.7 ± 0.7    48.1 ± 0.4   32       -       19.0     -
     Rhyparochromus vulgaris      Gschwendt (AT) - Cfb      47.179/15.573    15.1 ± 2.5   −3.8 ± 0.5   10     17.1 ± 3.5   46.9 ± 0.4   10      50.7     24.4    −3.8
       Scolopostethus pictus      Radkersburg (AT) - Cfb    46.714/15.998    2.8 ± 0.7    −4.3 ± 0.2   9      3.5 ± 0.6    40.8 ± 0.6   29      45.1     17.1    −2.7
                                     Graz (AT) – Cfb         47.071/15.44    3.9 ± 0.8    −2.7 ± 0.4   9      3.3 ± 0.6    41 ± 0.4.0    9      43.7     18.5    −3.7
        Pyrrhocoris apterus           Graz (AT) - Cfb       47.179/15.573    55.9 ± 9.3   −4.0 ± 0.6   21    53.2 ± 13.4   46.0 ± 0.5   10      50.0     23.5    −3.6
                                   SestoFno/FI (IT) - Csa   43.818/11.204    24.5 ± 2.8   −3.1 ± 1.4    8     39.0 ± 8.5   45.0 ± 0.5   19      48.1     17.5    2.8
                                     Belene (BG) - Cfa      43.652/25.129         -           -         -      25.4 ± 5    45.5 ± 0.6   32       -       16.9      -
                                      Sofia (BG) - Cfa      42.696/23.334    29.5 ± 6.7   −3.4 ± 1.6    9     47.3 ± 8.4   47.1 ± 0.2   10      50.4     22.1    −2.5
                                      Split (HR) - Csa       43.09/16.752    39.0 ± 6.4   −0.9 ± 0.6   10     29.8 ± 2.9   45.0 ± 0.4   10      45.9     17.8    3.1
                                      Pula (HR) - Cfa       44.867/13.85     31.6 ± 3.4   −3.8 ± 0.7    9          -            -        -       -        -       5.0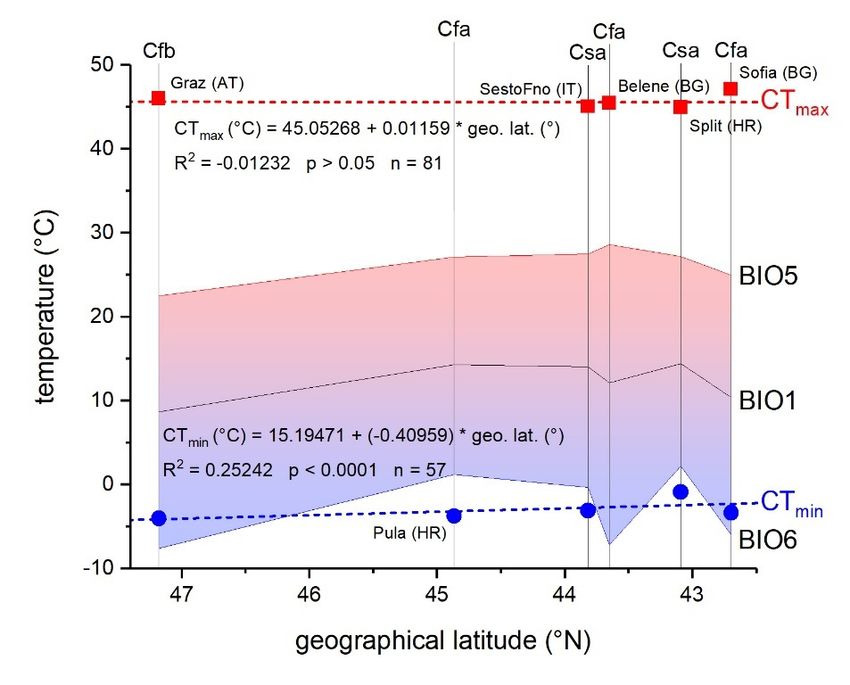
Insects 2020, 11, 197                                                                              5 of 17

2.2. Critical Thermal Minimum (CTmin )
      We placed the true bugs (see Table 2 for n) in individual measurement chambers (acrylic glass
test tubes, about 3 to 10 ml, depending on size, which were mounted in a self-constructed shaking
device. The device was submerged into a temperature-controlled water bath (JULABO F33, JULABO
Labortechnik GmbH, Seelbach, Germany). Up to nine individuals of the same species were tested per
trial run. An additional empty tube contained a thermocouple connected to a data logger (ALMEMO
2690, Ahlborn GmbH, Holzkirchen, Germany), which recorded the exact temperature the animals
were exposed to in one second intervals. After 10 min of habituation at 15 ◦ C, we drove a temperature
ramp at a slope of −0.25 ◦ C/min down to −5 ◦ C. After 5 min at this temperature, we warmed the
chambers at a rate of 2 ◦ C/min until 15 ◦ C was reached again. The measurement chambers were shaken
forcefully by the shaking device once a minute for 1 s for the entire experiment (approximately 100 min).
The experiments were recorded via video camera (Sony HDR-CX730E, Sony Europe Limited, Vienna,
Austria) for later evaluation of the animals’ behavior. To determine the lower threshold of activity,
the last appearance of voluntary movement of antennae or legs at a shaking event was determined.
The temperature at the next shaking event was specified as the CTmin (according to [44]). All evaluated
individuals survived the experiment and regained full mobility.

2.3. Critical Thermal Maximum (CTmax )
      We used a similar experimental setup as in Section 2.2, without the shaking apparatus activated.
Stimulation was not necessary, as the insects were always active at higher temperatures. Up to
10 measurement chambers were used for the bugs; the thermocouple for measuring the temperature
was placed in an additional similar chamber, near the animals. Following a standardized method
(e.g., [45–47]), the experiments started at a temperature of 25 ◦ C. After 10 min of habituation, we
drove a temperature ramp up to 50 ◦ C at a rate of 0.25 ◦ C/min. Again, the animals’ behavior was
recorded via video camera for later evaluation. The cease of coordinated movement marked the
so-called knockdown point the experimental ambient temperature measured at this time was described
as CTmax ([40–42]). As we did not abort the experiment after the first individual reached CTmax but
finished the temperature ramp, no individuals survived the CTmax experiments.

2.4. Thermal Tolerance Breadth (TTB), Heat Tolerance (TH), Cold Tolerance (TC)
     Thermal tolerance breadth (TTB) is the temperature range in which the bugs were able to exhibit
voluntary coordinated movement. It was calculated as TTB = CTmax − CTmin . The heat tolerance
(TH) and cold tolerance (TC) were calculated from the upper and lower thermal limits and bioclimatic
variables: TH = CTmax − BIO5 (maximum temperature of the warmest month), and TC = BIO6 − CTmin
(BIO6 = minimum temperature of the coldest month), respectively. Positive values for TH and TC
show the bugs’ ability to endure the occurring ambient temperatures. Negative values indicate that
they will have to avoid heat or cold damage by other means. TTB, TH, and TC were calculated from
mean CTmin and CTmax values per species and sample location.

2.5. Climate Data, Bioclimatic Variables, and Data Analysis
     The climate regions of our study animals were detailed from the Köppen–Geiger climate
classification system (KCC, Figure 1) updated by Kottek et al. [48]. The animal data were correlated
with eight bioclimatic variables (BIO1 to BIO7; BIO12) extracted from the WorldClim dataset ([49], http:
//worldclim.org/, January 2019) using ArcGIS ArcMap 10.5 (Environmental Systems Research Institute,
Redlands, CA, USA). The variables are the climatological normal from 1970–2000. The climatological
normal is a 30 year average of a weather variable and is used as an average or baseline to evaluate
climatic effects. Correlations of physiological data and climate variables were tested via ANOVA and
general linear model (GLM) modules in STATGRAPHICS Centurion 18 (Statgraphics Technologies Inc.,
The Plains, Virginia, USA).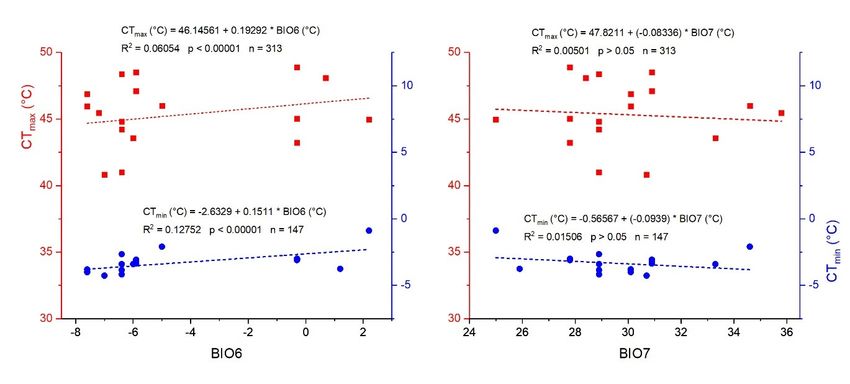
Insects 2020, 11, 197                                                                                 6 of 17

2.6. Testing for a Phylogenetic Signal
     A detailed phylogenetic cladogram was not available for our sampled bug species. To model
phylogenetic relations between the species, we generated a branching tree using an established
taxonomy ([6,43], Table 1), which is preferable to ignoring taxonomic relationship entirely [50]. For the
analyses regarding the phylogenetic signal, we built a phylogenetic tree based on recent studies of
Heteroptera: Pentatomomorpha [51] using Mesquite software 3.6 [52]. The taxonomic positions of
relevant subfamilies in this study were taken as template for the eight species (19 populations) assessed
in our study, where polytomies were randomly resolved into a series of dichotomies. Due to missing
exact relationships between species, we set branch length to 1 ([53]; see Figure S1). To incorporate
phylogenetic signals (i.e., related species that have similar traits) for all temperature parameters,
species, and body mass, we calculated Pagel’s λ [54] using R 3.5.1 [55]. The Pagel’s λ ranges between 0
(no phylogenetic signal) and 1 (strong phylogenetic signal) and was determined using the pgls function
in the caper package [56].

3. Results
     The investigated seed bugs showed high interspecies variability in their thermal traits. Mean CTmax
ranged from 40.8 ± 0.6 ◦ C in Scolopostethus pictus (Bad Radkersburg, AT, Cfb climate type) to 48.9 ± 0.5 ◦ C
in Melanocoryphus albomaculatus (Pistoia, IT; Cfa climate type, see Figure 1). CTmin ranged from
−4.3 ± 0.2 ◦ C in S. pictus (Bad Radkersburg, AT, Cfb) to −0.9 ± 0.6 ◦ C in Pyrrhocoris apterus (Split, HR,
Csa; mean values of individuals in a distribution area). TTB ranged from 45.1 ◦ C (Orsillus maculatus,
HR) to 52.0 ◦ C (M. albomaculatus, IT). In addition, intraspecies variations were high in some cases.
For details, see Table 2 and Figure S3.

3.1. Critical Thermal Limits (CTmin , CTmax )
     Critical thermal maxima differed significantly among bug species (ANOVA, F-quotient = 387.82,
p < 0.0001), with the exception of Arocatus longiceps and Orsillus maculatus. Critical thermal minima
(ANOVA, F-quotient = 1.36, p > 0.05) did not differ significantly among bug species.
     A multifactorial ANOVA with mass as covariate revealed a correlation of CTmin with KCC, but
not with species or body mass (Table 3). The hotter the climate, the lower the tolerance against low
temperatures was observed. General linear model (GLM) statistics revealed significant influence of
bioclimatic parameters on CTmin (p < 0.0001). It was directly related to the mean diurnal temperature
range (BIO2), isothermality (BIO3), and minimum temperatures (BIO6) (Table 3, Figure 2, Figure S4).
     By contrast, for CTmax , we found highly significant relationships with all three parameters: KCC,
species, and body mass. Species had the highest F-quotient, but also KCC showed significant influence
(Table 3). A generalized linear model (GLM) for CTmax showed highly significant correlations both for
the entire model as well as for every single bioclimatic parameter. Temperature seasonality (BIO4)
and minimum temperature of coldest month (BIO6) seemed to have a lesser but still significant effect.
For details, see Table 3. Figure 2 shows the correlations of CTmin and CTmax with latitude and climatic
parameters BIO1, and BIO4 to BIO7.

3.2. Correlation with Derived Physiological Thermal Tolerance Parameters (TTB, TC, TH)
     Thermal tolerance breadth (TTB) ranged from 43.7 ◦ C in Scoloposthetus pictus (Graz, AT) to
52.0  ◦Cin Melanocoryphus albomaculatus (Pistoia, IT) (Table 2). It was influenced by species (ANOVA,
df = 7, F = 11.37, p = 0.0357) but did not correlate with KCC or mass. A GLM for all bioclimatic
parameters showed a (weak) dependency on BIO1, BIO4, BIO5, and BIO6 after successive removal of
non-significant parameters (Table 4, see Figure 3 for correlations of single parameters).
     Cold tolerance (TC = BIO6 − CTmin ) was highest in Rhyparochromus vulgaris (−3.8 ◦ C, Gschwendt,
AT) and lowest in Pyrrhocoris apterus (5.0 ◦ C, Pula, HR) (Table 2). In Austria and Bulgaria, BIO6
(minimum temperature of the coldest month) was lower than the tested species’ CTmin (see Figure 4
Insects 2020, 11, 197 7 of 17
for P. apterus). TC did not correlate with KCC, species, or mass, but with some bioclimatic parameters
(GLM, df = 4, F = 224.56, p < 0.0001). BIO1 to BIO3, and BIO6 fitted the model significantly after
removal of non-significant parameters (Table 4).
Heat tolerance (TH = CTmax − BIO5) was lowest in Orsillus maculatus (15.7 ◦ C, Tregnago, IT) and
highest in Oxycarenus lavaterae (25.9 ◦ C, Graz, AT) (Table 2). It was not dependent on KCC, species,
mass (ANOVA, p > 0.05 for all), or bioclimatic factors (GLM, df = 7, p > 0.05) (Table 4). In all species
from all locations, CTmax was considerably higher than the maximal temperature of the warmest
month (BIO5) (compare Figure 4).
3.3. Testing for Phylogenetic Signal
A strong phylogenetic signal was detected in body mass (Table 5), which generally can be explained
by small mass differences between several species (compare Figure S2). We found no significant
phylogenetic signal in the tested physiological parameters using Pagel’s λ for critical thermal minimum
(CTmin ), temperature breath (TTB), heat tolerance (TH), and cold tolerance (TC) (λ = 0 with distinct
values for hypothesis and null hypothesis). For the critical thermal maximum (CTmax ), a phylogenetic
signal was indicated (Pagel’s λ = 1, p(λ=1) = 1) but the null hypothesis of no signal showed also a certain
probability (p(λ=0) = 0.235).
Table 3. Statistical analysis of CTmin and CTmax on Köppen–Geiger climate classification (KCC), species,
body mass, (via multifactorial ANOVA), and bioclimatic parameters (via general linear model (GLM)).
CTmin CTmax
df F-Quotient p-Value df F-Quotient p-Value
KCC 3 10.46Insects2020,
Insects 11,x 197
2020,11, 9 8ofof1917
Figure 2. Correlation of physiological parameters CTmin (blue) and CTmax (red) with latitude and
bioclimatic
Figure variables of
2. Correlation (BIO1, BIO4–BIO7;
physiological from http://worldclim.org/version2
parameters CTmin (blue) and CTmax (red)[49];with
variables are and
latitude the
average from
bioclimatic 1970 to
variables 2000).BIO4–BIO7;
(BIO1, Dots represent
from means of individual species at[49];
http://worldclim.org/version2 certain sample
variables aresites.
the
Correlations
average from calculated with number
1970 to 2000). of individuals.
Dots represent means See
of also Table 2 species
individual and Table
at S2.
certain sample sites.
Correlations calculated with number of individuals. See also Table 2 and Table S2.Insects 2020,
Insects 11, x197
2020, 11, 109 of
of 19
17
Figure 3. Physiological parameters thermal tolerance breadth (TTB, black), and heat and cold tolerance
Figure 3. Physiological
(TH, red; parameters
TC, blue) derived from CTthermal
max andtolerance breadth
CTmin (see (TTB,section)
Methods black), in
and heat and cold
dependence on tolerance
latitude
(TH, red; TC, blue)
and bioclimatic derived(BIO1,
variables from CT max and CTmin
BIO4–BIO7). (seerepresent
Dots Methodsmeans
section)
ofin dependence
individual on latitude
species and
at certain
bioclimatic
sample sites.variables
See also(BIO1,
Table 2BIO4–BIO7). Dots represent means of individual species at certain sample
and Table S2.
sites. See also Table 2 and Table S2.Insects2020,
Insects 11,x197
2020,11, 1110ofof1917
Figure 4. Thermal tolerance breadth (CTmax − CTmin ) of Pyrrhocoris apterus as well as bioclimatic
variables
Figure BIO1 (mean
4. Thermal annual
tolerance temperature),
breadth (CTmax −BIO5
CTmin(maximum temperature
) of Pyrrhocoris apterus asofwell
warmest month), and
as bioclimatic BIO6
variables
(minimum
BIO1 (meantemperature of coldest month)
annual temperature), BIO5 at the sampletemperature
(maximum sites in dependence on geographical
of warmest month), andlatitude.
BIO6
(minimum temperature of coldest month) at the sample sites in dependence on geographical latitude.
Table 5. Statistical analysis of phylogenetic signal in fresh body mass, CTmin , CTmax , TTB (thermal
tolerance breadth), TC (cold tolerance), and TH (heat tolerance). Estimation of phylogenetic signals for
Table 5. Statistical analysis of phylogenetic signal in fresh body mass, CTmin, CTmax, TTB (thermal
single traits with Pagel’s λ: p(λ=0) states the significance level of “no phylogenetic signal”, and P(λ=1) the
tolerance breadth), TC (cold tolerance), and TH (heat tolerance). Estimation of phylogenetic signals for
significance level of “a strong phylogenetic signal. In the case of body mass, for example, p(λ=0) < 0.001
single traits with Pagel’s λ: p(λ=0) states the significance level of “no phylogenetic signal”, and P(λ=1) the
means that the hypothesis of no phylogenetic signal was discarded, and P(λ=1) = 1 means that the
significance level of “a strong phylogenetic signal. In the case of body mass, for example, p(λ=0) < 0.001
hypothesis of a strong phylogenetic signal was confirmed (i.e., is not discarded).
means that the hypothesis of no phylogenetic signal was discarded, and P(λ=1) = 1 means that the
hypothesis of a strong phylogenetic signal was confirmed
Pagel’s λ (i.e., is not discarded).
p(λ=0) p(λ=1)
Body mass (mg) 1
Pagel’s λInsects 2020, 11, 197 11 of 17
beetles [58,59]. In other insects, however, results are not consistent. In ants, a positive correlation was
reported [60,61] but also a decrease with mass [62,63]. In termites, a positive [64] or no correlation was
reported [65].
Concerning the ability to tolerate cold, by contrast, the results are more diverse (Table 3).
Although CTmin is influenced by bioclimatic variables in general, only some bioclimatic variables
seemed to have a direct effect, that is, the minimum temperature of the coldest month (BIO6)
and associated parameters (mean diurnal range, BIO2; isothermality, BIO3). This seems plausible,
because minimum environmental temperatures strongly determine survival during cold seasons,
when behavioral avoidance is restricted, and thus the evolutionary drive to withstand them by
physiological adaptation is high. If one accepts this interpretation, it seems intelligible that the annual
mean temperature (BIO1) has only a weak effect on CTmin . Mass had no effect on the CTmin of seed
bugs (Table 3, Figure S3). By contrast, in ants, a decrease with mass was reported [63]. In a seasonal
comparison of two termite species, no effect of mass on CTmin was reported [65]. Raschmanová et al. [66]
observed a significant decrease of cold resistance with increasing body length in Collembola species
inhabiting soil and subterranean habitats.
Responses to temperatures below the favorable temperature range (i.e., cold stress) often rely
on different physiological mechanisms than those to heat stress. They are decoupled evolutionarily,
and therefore may change differently in the course of the species’ colonization of new areas [67].
Our findings support the hypothesis of decoupled thermal limits. Although cold tolerance (TC)
correlated significantly with several bioclimatic parameters in a GLM analysis, heat tolerance (TH)
did not (Table 4). This is in good accordance with a study of Addo-Bediako et al. [20], who found
that upper thermal limits show little geographical variation, but the lower bounds of supercooling
points and lower lethal temperatures do decline with latitude (and thus minimum temperature).
In individual regression analyses (where other bioclimatic parameters were not included as covariates),
cold tolerance (TC) depended on all tested bioclimatic parameters (Figure 3). On the one hand, it
is plausible that with decreasing annual mean temperature (BIO1) and the minimum temperature
of the coldest month (BIO6), the bugs adapted to endure lower temperatures (have a lower CTmin ;
Figure 2). On the other hand, the observed negative values of cold tolerance (TC) under cold conditions
(minimum temperature of the coldest month, BIO6; Figure 3) would indicate that the bugs were
below their safe thermal conditions. This suggests that they seek out more favorable microclimatic
environments in good time, that is, at higher ambient temperatures where unhindered mobility is
guaranteed. The temperature in these microclimatic environments may well be higher than indicated
by the macroclimatic variables [68]. By contrast, heat tolerance TH, which represents the difference of
CTmax to the maximum temperature of the warmest month (BIO5), depended only on the annual mean
temperature (BIO1) and the maximum temperature of the warmest month (BIO5) (Figure 3, Table S2).
A decreasing heat tolerance with these bioclimatic variables (BIO1, BIO5) indicates a decrease of the
upper thermal safety margin (compare Figure 4). It remains unclear, however, whether this occurs
because of physiological restraints (i.e., inability for a higher CTmax ) or a lack of need to increase CTmax
further (because the thermal safety range is already sufficient).
Both cold and heat tolerance (TC, TH) did not correlate with latitude (Figure 3). This could have
been due to the narrow latitudinal range of 6◦ , as already mentioned above. Our results demonstrated
that the investigation of variables directly affecting the studied organisms, instead of surrogate variables
such as latitude or elevation, should increase the ability to understand the mechanisms driving animal
distribution and biodiversity (see also [69]).
It has to be kept in mind, however, that our analysis does not include all ecological factors relevant
for survival of unfavorable conditions. Mean minimum temperatures of the coldest month (BIO6) in
Austria and Bulgaria were lower than the species’ CTmin , resulting in negative values of cold tolerance
(TC) (Figure 4). Here, the overwintering individuals have to seek out microhabitats that provide a
more benign microclimate, wherein they can endure cold periods [68,70,71]. However, if endured
winter temperatures sink under the lethal temperatures of the bug species, colonization of such regionsInsects 2020, 11, 197 12 of 17
is not possible. This might explain the absence of, for instance, the Mediterranean Orsillus maculatus in
colder regions of Europe, whereas Orsillus depressus thrives in these regions [43].
Heat tolerance (TH) in all species exceeded mean maximum temperatures of the warmest month
(BIO5) in all locations (Table 2; by up to 25.9 ◦ C in Oxycarenus lavaterae in Graz/AT), which coincides
with the findings of Sunday et al. [24] in several ectotherms. As all individuals were sampled during
the cold season (winter), an immediate acclimation to high temperatures is unlikely. However,
as bioclimatic parameters were the climatological normal from 1970 to 2000, absolute maximum
temperatures were likely to be higher at some times, but not to the extent that they make permanent
populations impossible.
The climate variability hypothesis states that a positive relationship exists between the breadth of
thermal tolerance (TTB, the degree of eurythermy) and the level of climatic variability experienced by
taxa with increasing latitude, especially in terrestrial ectotherms [16,72]. However, on the basis of our
results, we could not make a clear decision because there was no correlation with BIO7 (BIO5 − BIO6),
the bioclimatic variable we assumed to characterize best the climatic variability, but there was a weak
correlation with BIO4 (temperature seasonality) (Table 4). One reason for the ambiguity could be the
small latitudinal range covered in this study and the resulting small climatic variability.
The presence of a phylogenetic signal, that is, when related species share similar thermal
responses, may indicate constraints of their thermal niches, which dictate the environments in
which they can persist [73], or it may indicate similar selection pressures and similar environmental
effects [73–75]. In our assessed seed bug species, kinship seems to have played a lesser, or at least
no unambiguous, role in the adaptation to high environmental temperatures, and no role in low
temperature adaptation (Table 5). This concurs with the findings of Teets and Hahn [76] on CTmin of
Drosophila. Concerning CTmax , it concurs with findings of Ayrinhac et al. [77] and Hoffmann et al. [78]
regarding the upper thermal limits in Drosophila, of Terblanche et al. [79] in Glossina pallidipes, of
Vorhees et al. [39] in Culex tarsalis, and of Hamblin et al. [80] in a variety of bee species. In other words,
our results suggest that despite phylogenetic relatedness, the seed bugs differ in their CTmax because
of adaptation to differing thermal environments, indicated by the comprehensive significant effects of
bioclimatic variables on CTmax (Figure 2, Tables 3 and 4).
In the face of global warming and the current “Mediterranaziation” of the Heteroptera fauna [81,82]
in regions of previously unsuitable climatological (i.e., “too cold”) conditions, we suggest that seed bugs
will not experience troubles to disperse towards the north. Temperature-induced longer (reproductive)
seasons and shortened diapause may result in an increase of generations per year or/and increased
overwintering success [83–85]. Although winter mortality may vary depending on parameters such
as gender, microhabitat choice, as well as size and coloration [86–88], temperature seems to be the
main factor. That which might hinder the true bugs’ dispersion could be the minimum environmental
temperatures, which still can reach quite low values in Europe despite higher annual temperatures.
Yukawa et al. [89] suggested the northward range expansion of Nezara viridula in Japan to be due
to global warming, because the monthly mean temperature for January in the newly invaded areas
exceeded the limit temperature of 5 ◦ C, below which winter mortality increases by 15%–16.5% per
1 ◦ C decrease in mean winter temperature [87,90,91]. Concerning the ability to invade colder areas in
reaction to global temperature increase, we suggest a similar dispersion capacity of European seed
bugs than predicted for Nezara viridula in Kyushu in Southern Japan [89].
5. Conclusions
Physiological traits such as lower and upper thermal limits play an important role in seed
bug survival, reproduction, dispersion, and colonization under given environmental conditions.
We suggest that their wide thermal breath and adaptive capacity have promoted their prosperity and
dispersion. In this respect, there seems to be ample potential in the bugs for thriving and further
proliferation, as well as invasion to new, hitherto unexploited areas of settlement, especially in the face
of global warming.Insects 2020, 11, 197 13 of 17
Supplementary Materials: The following are available online at http://www.mdpi.com/2075-4450/11/3/197/s1,
Figure S1: Theoretical cladogram. Figure S2: Correlation of CTmin and CTmax with fresh body mass. Figure S3:
Correlation of physiological parameters with bioclimatic variables. Table S1: Species, sample date, sample location,
KCC, and bioclimatic parameters of the true bugs assessed. Table S2: Statistical results.
Author Contributions: Experiment design, H.K. (Helmut Kovac), H.K. (Helmut Käfer), and A.S.; conduction
of experiments, H.K. (Helmut Kovac) and H.K. (Helmut Käfer); study leading, H.K. (Helmut Kovac) and A.S.;
data analysis, H.K. (Helmut Käfer), H.K. (Helmut Kovac), B.E., A.K.D.S., and A.S.; provision of animal samples,
H.K. (Helmut Käfer), H.K. (Helmut Kovac), N.S., and A.B.; writing, H.K. (Helmut Käfer), H.K. (Helmut Kovac),
and A.S. All authors participated in discussing the results and checking the paper. All authors have read and
agreed to the published version of the manuscript.
Funding: The research was funded by the Austrian Science Fund (FWF): P25042-B16, P30350-B25.
Acknowledgments: We greatly appreciate the extensive help of Thomas Frieß (Ökoteam - Institut für Tierökologie
und Naturraumplanung OG, Graz) in the identification of certain bug species, as well as for his valuable hints
on distribution and ecology. Furthermore, we want to thank Iacopo Petrocelli for his help in acquiring bug
samples, and Christine Malej and Oliver Olipitz for their help in data evaluation. We thank the reviewers for their
particularly helpful comments in improving the manuscript.
Conflicts of Interest: The authors declare no conflict of interest. The funders had no role in the design of the
study; in the collection, analyses, or interpretation of data; in the writing of the manuscript; or in the decision to
publish the results.
Abbreviations
KCC Köppen–Geiger climate classification (climate, precipitation, temperature)
Bsk arid, summer dry, cold arid
Cfa warm temperate, fully humid, hot summer
Cfb warm temperate, fully humid, warm summer
Csa warm temperate, summer dry, hot summer
Bioclimatic variables (mean values 1970–2000)
BIO1 annual mean temperature
BIO2 mean diurnal range (mean of monthly (max temp − min temp))
BIO3 isothermality (BIO2/BIO7 × 100)
BIO4 temperature seasonality (standard deviation × 100)
BIO5 max temperature of warmest month
BIO6 min temperature of coldest month
BIO7 temperature annual range (BIO5 − BIO6)
BIO12 annual precipitation
Physiological parameters
CTmin critical thermal minimum
CTmax critical thermal maximum
TTB thermal tolerance breadth (CTmax − CTmin )
TC cold tolerance (BIO6 − CTmin )
TH heat tolerance (CTmax − BIO5)
References
1. Henry, T.J. Biodiversity of Heteroptera. In Insect Biodiversity; Foottit, R.G., Adler, P.H., Eds.; John Wiley &
Sons, Ltd.: Chichester, UK, 2017; pp. 279–335, ISBN 9781118945568.
2. Weber, N.A. A survey of the insects and related arthropods of arctic Alaska. Part I. Trans. Am. Entomol.
Soc. (1890-) 1950, 76, 147–206.
3. Makarova, O.L.; Makarov, K.V. True bugs (Heteroptera) from the Arctic Dolgii Island, the Barents sea.
Entomol. Rev. 2006, 86, 423–432. [CrossRef]
4. Schuh, R.T.; Weirauch, C. True Bugs of the World (Hemiptera, Heteroptera). Classification and Natural History,
2nd ed.; Siri Scientific Press: Manchester, UK, 2020; ISBN 978-0-9957496-9-6.Insects 2020, 11, 197 14 of 17
5. Morrison, R. Invasive Insects: The Top 4 “Most Wanted” List. Available online: https://entomologytoday.org/
2018/06/21/invasive-insects-the-top-4-most-wanted-list/ (accessed on 26 August 2019).
6. Aukema, B. Fauna Europaea: Hemiptera, Heteroptera, Pentatomorpha, Lygaeoidea: Fauna Europaea Version
2017.06. Available online: https://fauna-eu.org (accessed on 29 November 2019).
7. Rabitsch, W.; Adlbauer, K. Erstnachweis und bekannte Verbreitung von Oxycarenus lavaterae (Fabricius, 1787)
in Österreich (Heteroptera: Lygaeidae). Beitr. Entomofaunist. 2001, 2, 49–54.
8. Hoffmann, H.-J. Oxycarenus lavaterae (Fabricius, 1787) nun auch im Norden Frankreichs, und im SW
Deutschlands. In Heteropteron: Mitteilungsblatt der Arbeitsgruppe Mitteleuropäischer Heteropterologen;
Hoffmann, H.C., Ed.; Arbeitsgruppe Mitteleuropäischer Heteropterologen, Hrsg.: Köln, Germany, 2005;
pp. 25–26.
9. Kalushkov, P.; Simov, N.; Tzankova, R. Biology and Acclimatization of Oxycarenus lavaterae (Heteroptera:
Lygaeidae) A new invasive Mediterranean Species in Bulgarian Fauna. In Proceedings of the International
Conference “Alien Arthropods in South East Europe—Crossroad of Three Continents”, Sofia, Bulgaria,
19–21 September 2007; University of Forestry: Sofia, Bulgaria, 2007; pp. 44–47.
10. Schneider, A.; Dorow, W.H. Erstnachweis von Oxycarenus lavaterae (Fabricius, 1787) für Hessen. In Heteropteron:
Mitteilungsblatt der Arbeitsgruppe Mitteleuropäischer Heteropterologen; Hoffmann, H.C., Ed.; Arbeitsgruppe
Mitteleuropäischer Heteropterologen, Hrsg.: Köln, Germany, 2016; pp. 23–24.
11. Musolin, D.L.; Fujisaki, K. Changes in ranges: Trends in distribution of true bugs (Heteroptera) under
conditions of the current climate warning. Russ. Entomol. J. 2006, 15, 175–179.
12. Taylor, F. Ecology and evolution of physiological time in insects. Am. Nat. 1981, 117, 1–23. [CrossRef]
13. Chown, S.L.; Nicolson, S.W. Insect Physiological Ecology: Mechanisms and Patterns; Oxford University Press:
New York, NY, USA, 2004; ISBN 978-0198515494.
14. Dixon, A.F.G.; Honěk, A.; Keil, P.; Kotela, M.A.A.; Šizling, A.L.; Jarošík, V. Relationship between the minimum
and maximum temperature thresholds for development in insects. Funct. Ecol. 2009, 23, 257–264. [CrossRef]
15. Bale, J.S. Insects at low temperature: A predictable relationship? Funct. Ecol. 1991, 5, 291. [CrossRef]
16. Stevens, G.C. The latitudinal gradient in geographical range: How so many species coexist in the tropics.
Am. Nat. 1989, 133, 240–256. [CrossRef]
17. Chown, S.L. Physiological variation in insects: Hierarchical levels and implications. J. Insect Physiol. 2001, 47,
649–660. [CrossRef]
18. Sunday, J.M.; Bates, A.E.; Dulvy, N.K. Global analysis of thermal tolerance and latitude in ectotherms.
Proc. Biol. Sci. 2011, 278, 1823–1830. [CrossRef]
19. Gaston, K.J.; Chown, S.L. Elevation and climatic colerance: A test using dung beetles. Oikos 1999, 86, 584.
[CrossRef]
20. Addo-Bediako, A.; Chown, S.L.; Gaston, K.J. Thermal tolerance, climatic variability and latitude.
Proc. Biol. Sci. 2000, 267, 739–745. [CrossRef]
21. Sheldon, K.S.; Tewksbury, J.J. The impact of seasonality in temperature on thermal tolerance and elevational
range size. Ecology 2014, 95, 2134–2143. [CrossRef] [PubMed]
22. Sunday, J.; Bennett, J.M.; Calosi, P.; Clusella-Trullas, S.; Gravel, S.; Hargreaves, A.L.; Leiva, F.P.;
Verberk, W.C.E.P.; Olalla-Tárraga, M.Á.; Morales-Castilla, I. Thermal tolerance patterns across latitude
and elevation. Philos. Trans. R. Soc. Lond. B Biol. Sci. 2019, 374, 20190036. [CrossRef] [PubMed]
23. Oyen, K.J.; Giri, S.; Dillon, M.E. Altitudinal variation in bumble bee (Bombus) critical thermal limits.
J. Therm. Biol. 2016, 59, 52–57. [CrossRef]
24. Sunday, J.M.; Bates, A.E.; Kearney, M.R.; Colwell, R.K.; Dulvy, N.K.; Longino, J.T.; Huey, R.B. Thermal-safety
margins and the necessity of thermoregulatory behavior across latitude and elevation. Proc. Natl. Acad.
Sci. USA 2014, 111, 5610–5615. [CrossRef]
25. Winwood-Smith, H.S.; Alton, L.A.; Franklin, C.E.; White, C.R. Does greater thermal plasticity facilitate range
expansion of an invasive terrestrial anuran into higher latitudes? Conserv. Physiol. 2015, 3, cov010. [CrossRef]
26. Ducatez, S.; Baguette, M.; Trochet, A.; Chaput-Bardy, A.; Legrand, D.; Stevens, V.; Fréville, H. Flight endurance
and heating rate vary with both latitude and habitat connectivity in a butterfly species. Oikos 2013, 122,
601–611. [CrossRef]
27. Alford, L.; Blackburn, T.M.; Bale, J.S. Effect of latitude and acclimation on the lethal temperatures of the
peach-potato aphid Myzus persicae. Agric. Forest Entomol. 2012, 14, 69–79. [CrossRef]Insects 2020, 11, 197 15 of 17
28. Buckley, L.B.; Huey, R.B. Temperature extremes: Geographic patterns, recent changes, and implications for
organismal vulnerabilities. Glob. Chang. Biol. 2016, 22, 3829–3842. [CrossRef]
29. Potter, K.A.; Arthur Woods, H.; Pincebourde, S. Microclimatic challenges in global change biology.
Glob. Chang. Biol. 2013, 19, 2932–2939. [CrossRef]
30. Deutsch, C.A.; Tewksbury, J.J.; Huey, R.B.; Sheldon, K.S.; Ghalambor, C.K.; Haak, D.C.; Martin, P.R. Impacts
of climate warming on terrestrial ectotherms across latitude. Proc. Natl. Acad. Sci. USA 2008, 105, 6668–6672.
[CrossRef] [PubMed]
31. Hoffmann, A.A. Physiological climatic limits in Drosophila: Patterns and implications. J. Exp. Biol. 2010, 213,
870–880. [CrossRef] [PubMed]
32. Pearson, O.P.; Bradford, D.F. Thermoregulation of lizards and toads at high altitudes in Peru. Copeia 1976,
1976, 155–170. [CrossRef]
33. Pincebourde, S.; Casas, J. Narrow safety margin in the phyllosphere during thermal extremes. Proc. Natl.
Acad. Sci. USA 2019, 116, 5588–5596. [CrossRef]
34. Hadley, N.F. Water relations of the desert scorpion, Hadrurus arizonensis. J. Exp. Biol. 1970, 53, 547–558.
35. Hadley, N.F.; Quinlan, M.C.; Kennedy, M.L. Evaporative cooling in the desert cicada. J. Exp. Biol. 1991, 159,
269–283.
36. Buckley, L.B.; Miller, E.F.; Kingsolver, J.G. Ectotherm thermal stress and specialization across altitude and
latitude. Integr. Comp. Biol. 2013, 53, 571–581. [CrossRef]
37. Kearney, M.R.; Shine, R.; Porter, W.P. The potential for behavioral thermoregulation to buffer “cold-blooded”
animals against climate warming. Proc. Natl. Acad. Sci. USA 2009, 106, 3835–3840. [CrossRef]
38. Woods, H.A.; Dillon, M.E.; Pincebourde, S. The roles of microclimatic diversity and of behavior in mediating
the responses of ectotherms to climate change. J. Therm. Biol. 2015, 54, 86–97. [CrossRef]
39. Vorhees, A.S.; Gray, E.M.; Bradley, T.J. Thermal resistance and performance correlate with climate in
populations of a widespread mosquito. Physiol. Biochem. Zool. 2013, 86, 73–81. [CrossRef] [PubMed]
40. Hazell, S.P.; Pedersen, B.P.; Worland, M.R.; Blackburn, T.M.; Bale, J.S. A method for the rapid measurement
of thermal tolerance traits in studies of small insects. Physiol. Entomol. 2008, 33, 389–394. [CrossRef]
41. Klok, C.J.; Chown, S.L. Critical thermal limits, temperature tolerance and water balance of a sub-Antarctic
caterpillar, Pringleophaga marioni (Lepidoptera: Tineidae). J. Insect Physiol. 1997, 43, 685–694. [CrossRef]
42. Lutterschmidt, W.I.; Hutchison, V.H. The critical thermal maximum: Data to support the onset of spasms as
the definitive end point. Can. J. Zool. 1997, 75, 1553–1560. [CrossRef]
43. Aukema, B.; Rieger, C. Catalogue of the Heteroptera of the Palaearctic Region: Pentatomomorpha I; Netherlands
Entomological Society: Amsterdam, The Netherlands, 2001; Volume 4, ISBN 90-71912-21-3.
44. Andersen, J.L.; Manenti, T.; Sørensen, J.G.; MacMillan, H.A.; Loeschcke, V.; Overgaard, J. How to assess
Drosophila cold tolerance: Chill coma temperature and lower lethal temperature are the best predictors of
cold distribution limits. Funct. Ecol. 2015, 29, 55–65. [CrossRef]
45. Chown, S.L.; Jumbam, K.R.; Sørensen, J.G.; Terblanche, J.S. Phenotypic variance, plasticity and heritability
estimates of critical thermal limits depend on methodological context. Funct. Ecol. 2009, 23, 133–140.
[CrossRef]
46. Terblanche, J.S.; Deere, J.A.; Clusella-Trullas, S.; Janion, C.; Chown, S.L. Critical thermal limits depend on
methodological context. Proc. R. Soc. Lond. B 2007, 274, 2935–2942. [CrossRef] [PubMed]
47. Kovac, H.; Käfer, H.; Stabentheiner, A. The respiratory metabolism of Polistes biglumis, a paper wasp from
mountainous regions. Insects 2020, 11, 165. [CrossRef]
48. Kottek, M.; Grieser, J.; Beck, C.; Rudolf, B.; Rubel, F. World Map of the Köppen-Geiger climate classification
updated. Meteorol. Z. 2006, 15, 259–263. [CrossRef]
49. Fick, S.E.; Hijmans, R.J. WorldClim 2: New 1-km spatial resolution climate surfaces for global land areas.
Int. J. Climatol. 2017, 37, 4302–4315. [CrossRef]
50. Freckleton, R.P. The seven deadly sins of comparative analysis. J. Evol. Biol. 2009, 22, 1367–1375. [CrossRef]
[PubMed]
51. Gordon, E.R.L.; McFrederick, Q.; Weirauch, C. Phylogenetic evidence for ancient and persistent environmental
symbiont reacquisition in Largidae (Hemiptera: Heteroptera). Appl. Environ. Microbiol. 2016, 82, 7123–7133.
[CrossRef] [PubMed]
52. Maddison, W.P.; Maddison, D.R. Mesquite: A Modular System for Evolutionary Analysis, Version 3.6. Available
online: http://www.mesquiteproject.org (accessed on 24 September 2019).Insects 2020, 11, 197 16 of 17
53. Erregger, B.; Kovac, H.; Stabentheiner, A.; Hartbauer, M.; Römer, H.; Schmidt, A.K.D. Cranking up the heat:
Relationships between energetically costly song features and the increase in thorax temperature in male
crickets and katydids. J. Exp. Biol. 2017, 220, 2635–2644. [CrossRef]
54. Pagel, M. Inferring the historical patterns of biological evolution. Nature 1999, 401, 877–884. [CrossRef]
[PubMed]
55. R Core Team. R: A Language and Environment for Statistical Computing; R Foundation for Statistical Computing.
Available online: http://www.R-project.org/ (accessed on 24 September 2019).
56. Orme, D.; Freckleton, R.P.; Thomas, G.H.; Petzoldt, T.; Fritz, S.A.; Isaac, N. CAPER: Comparative analyses of
phylogenetics and evolution in R. Methods Ecol. Evol. 2013, 3, 145–151.
57. Kellermann, V.; Overgaard, J.; Hoffmann, A.A.; Flojgaard, C.; Svenning, J.-C.; Loeschcke, V. Upper thermal
limits of Drosophila are linked to species distributions and strongly constrained phylogenetically. Proc. Natl.
Acad. Sci. USA 2012, 109, 16228–16233. [CrossRef]
58. Gallego, B.; Verdú, J.R.; Carrascal, L.M.; Lobo, J.M. A protocol for analysing thermal stress in insects using
infrared thermography. J. Therm. Biol. 2016. [CrossRef]
59. Nyamukondiwa, C.; Chidawanyika, F.; Machekano, H.; Mutamiswa, R.; Sands, B.; Mgidiswa, N.; Wall, R.
Climate variability differentially impacts thermal fitness traits in three coprophagic beetle species. PLoS ONE
2018, 13, e0198610. [CrossRef]
60. Baudier, K.M.; Mudd, A.E.; Erickson, S.C.; O’Donnell, S. Microhabitat and body size effects on heat tolerance:
Implications for responses to climate change (army ants: Formicidae, Ecitoninae). J. Anim. Ecol. 2015, 84,
1322–1330. [CrossRef]
61. Ribeiro, P.L.; Camacho, A.; Navas, C.A. Considerations for assessing maximum critical temperatures in small
ectothermic animals: Insights from leaf-cutting Ants. PLoS ONE 2012, 7, e32083. [CrossRef]
62. Verble-Pearson, R.M.; Gifford, M.E.; Yanoviak, S.P. Variation in thermal tolerance of North American ants.
J. Therm. Biol. 2015, 48, 65–68. [CrossRef] [PubMed]
63. Hemmings, Z.; Andrew, N.R. Effects of microclimate and species identity on body temperature and thermal
tolerance of ants (Hymenoptera: Formicidae). Austral Entomol. 2017, 56, 104–114. [CrossRef]
64. Janowiecki, M.; Clifton, E.; Avalos, A.; Vargo, E.L. Upper thermal tolerance of tropical and temperate termite
species (Isoptera: Rhinotermitidae, Termitidae): A test of the climate variability hypothesis in termites.
Insectes Soc. 2019, 16, 1206. [CrossRef]
65. Hu, X.P.; Appel, A.G. Seasonal variation of critical thermal limits and temperature tolerance in formosan and
eastern subterranean termites (Isoptera: Rhinotermitidae). Environ. Entomol. 2004, 33, 197–205. [CrossRef]
66. Raschmanová, N.; Šustr, V.; Kováč, L’.; Parimuchová, A.; Devetter, M. Testing the climatic variability
hypothesis in edaphic and subterranean Collembola (Hexapoda). J. Therm. Biol. 2018, 78, 391–400. [CrossRef]
67. Chown, S.L.; Addo-Bediako, A.; Gaston, K.J. Physiological variation in insects: Large-scale patterns and
their implications. Comp. Biochem. Physiol. B 2002, 131, 587–602. [CrossRef]
68. Rozsypal, J.; Koštál, V. Supercooling and freezing as eco-physiological alternatives rather than mutually
exclusive strategies: A case study in Pyrrhocoris apterus. J. Insect Physiol. 2018, 111, 53–62. [CrossRef]
69. Mumladze, L.; Asanidze, Z.; Walther, F.; Hausdorf, B. Beyond elevation: Testing the climatic variability
hypothesis vs. Rapoport’s rule in vascular plant and snail species in the Caucasus. Biol. J. Linn. Soc. 2017,
121, 753–763. [CrossRef]
70. Koštál, V.; Šimek, P. Overwintering strategy in Pyrrhocoris apterus (Heteroptera): The relations between
life-cycle, chill tolerance and physiological adjustments. J. Insect Physiol. 2000, 46, 1321–1329. [CrossRef]
71. Honek, A.; Martinkova, Z. Behavioural thermoregulation hastens spring mating activity in Pyrrhocoris apterus
(Heteroptera: Pyrrhocoridae). J. Therm. Biol. 2019, 84, 185–189. [CrossRef]
72. Baudier, K.M.; D’Amelio, C.L.; Malhotra, R.; O’Connor, M.P.; O’Donnell, S. Extreme insolation: Climatic
variation shapes the evolution of thermal tolerance at multiple Scales. Am. Nat. 2018, 192, 347–359. [CrossRef]
73. Hoffmann, A.A.; Chown, S.L.; Clusella-Trullas, S.; Fox, C. Upper thermal limits in terrestrial ectotherms:
How constrained are they? Funct. Ecol. 2013, 27, 934–949. [CrossRef]
74. Hansen, T.F.; Pienaar, J.; Orzack, S.H. A comparative method for studying adaptation to a randomly evolving
environment. Evolution 2008, 62, 1965–1977. [CrossRef]
75. Losos, J.B. Phylogenetic niche conservatism, phylogenetic signal and the relationship between phylogenetic
relatedness and ecological similarity among species. Ecol. Lett. 2008, 11, 995–1003. [CrossRef]Insects 2020, 11, 197 17 of 17
76. Teets, N.M.; Hahn, D.A. Genetic variation in the shape of cold-survival curves in a single fly population
suggests potential for selection from climate variability. J. Evol. Biol. 2018, 31, 543–555. [CrossRef]
77. Ayrinhac, A.; Debat, V.; Gibert, P.; Kister, A.-G.; Legout, H.; Moreteau, B.; Vergilino, R.; David, J.R. Cold
adaptation in geographical populations of Drosophila melanogaster: Phenotypic plasticity is more important
than genetic variability. Funct. Ecol. 2004, 18, 700–706. [CrossRef]
78. Hoffmann, A.A.; Shirriffs, J.; Scott, M. Relative importance of plastic vs genetic factors in adaptive
differentiation: Geographical variation for stress resistance in Drosophila melanogaster from eastern Australia.
Funct. Ecol. 2005, 19, 222–227. [CrossRef]
79. Terblanche, J.S.; Klok, C.J.; Krafsur, E.S.; Chown, S.L. Phenotypic Plasticity and Geographic Variation in
Thermal Tolerance and Water Loss of the Tsetse Glossina pallidipes (Diptera: Glossinidae): Implications for
Distribution Modelling. Am. J. Trop. Med. Hyg. 2006, 74, 786–794. [CrossRef]
80. Hamblin, A.L.; Youngsteadt, E.; López-Uribe, M.M.; Frank, S.D. Physiological thermal limits predict
differential responses of bees to urban heat-island effects. Biol. Lett. 2017, 13. [CrossRef]
81. Rabitsch, W. The times they are a-changin’: Driving forces of recent additions to the Heteroptera fauna
of Austria. In Advances in Heteroptera Research. Festschrift in Honor of 80th Anniversary of Michail Josifov;
Grozeva, S., Simov, N., Eds.; Pensoft Publishers: Sofia, Moscow, 2008; pp. 309–326, ISBN 9789546423115.
82. Musolin, D.L.; Saulich, A.K. Responses of insects to the current climate changes: From physiology and
behavior to range shifts. Entmol. Rev. 2012, 92, 715–740. [CrossRef]
83. Musolin, D.L. Insects in a warmer world: Ecological, physiological and life-history responses of true bugs
(Heteroptera) to climate change. Glob. Chang. Biol. 2007, 13, 1565–1585. [CrossRef]
84. Musolin, D.L.; Fujisaki, K.; Numata, H. Photoperiodic control of diapause termination, colour change and
postdiapause reproduction in the southern green stink bug, Nezara viridula. Physiol. Entomol. 2007, 32,
64–72. [CrossRef]
85. Saulich, A.K.; Musolin, D.L. Diapause in the seasonal cycle of stink bugs (Heteroptera, Pentatomidae) from
the Temperate Zone. Entmol. Rev. 2012, 92, 1–26. [CrossRef]
86. Kiritani, K. Factors affecting the winter mortality in the southern green stink bug, Nezara viridula L.
Ann. Entomol. Soc. Fr. 1966, 2, 199–207.
87. Kiritani, K. The impact of global warming and land-use change on the pest status of rice and fruit bugs
(Heteroptera) in Japan. Glob. Chang. Biol. 2007, 13, 1586–1595. [CrossRef]
88. Kiritani, K.; Hókyo, N.; Kimura, K. Differential Winter Mortality Relative to Sex in the Population of the
Southern Green Stink Bug, Nezara viridula (Pentatomidae, Hemiptera). Jpn. J. Appl. Entomol. Zool. 1962, 6,
242–246. [CrossRef]
89. Yukawa, J.; Kiritani, K.; Gyoutoku, N.; Uechi, N.; Yamaguchi, D.; Kamitani, S. Distribution range shift of two
allied species, Nezara viridula and N. antennata (Hemiptera: Pentatomidae), in Japan, possibly due to global
warming. Appl. Entomol. Zool. 2007, 42, 205–215. [CrossRef]
90. Yukawa, J.; Kiritani, K.; Kawasawa, T.; Higashiura, Y.; Sawamura, N.; Nakada, K.; Gyotoku, N.; Tanaka, A.;
Kamitani, S.; Matsuo, K.; et al. Northward range expansion by Nezara viridula (Hemiptera: Pentatomidae)
in Shikoku and Chugoku Districts, Japan, possibly due to global warming. Appl. Entomol. Zool. 2009, 44,
429–437. [CrossRef]
91. Kiritani, K. Different effects of climate change on the population dynamics of insects. Appl. Entomol. Zool.
2013, 48, 97–104. [CrossRef]
© 2020 by the authors. Licensee MDPI, Basel, Switzerland. This article is an open access
article distributed under the terms and conditions of the Creative Commons Attribution
(CC BY) license (http://creativecommons.org/licenses/by/4.0/).You can also read