2020 ISP Appendix 7. Future Power System Security - July 2020 - AEMO
←
→
Page content transcription
If your browser does not render page correctly, please read the page content below

2020 ISP
Appendix 7.
Future Power
System
Security
July 2020
Important notice

PURPOSE
This is Appendix 7 to the Final 2020 Integrated System Plan (ISP), available at https://aemo.com.au/energy-
systems/major-publications/integrated-system-plan-isp.
AEMO publishes this 2020 ISP pursuant to its functions under section 49(2) of the National Electricity Law
(which defines AEMO’s functions as National Transmission Planner) and its broader functions under the
National Electricity Rules to maintain and improve power system security. In addition, AEMO has had regard
to the National Electricity Amendment (Integrated System Planning) Rule 2020 which commenced on 1 July
2020 during the development of the 2020 ISP.

DISCLAIMER
This document or the information in it may be subsequently updated or amended. This document does not
constitute legal or business advice, and should not be relied on as a substitute for obtaining detailed advice
about the National Electricity Law, the National Electricity Rules, or any other applicable laws, procedures or
policies. AEMO has made every effort to ensure the quality of the information in this document but cannot
guarantee its accuracy or completeness.
Accordingly, to the maximum extent permitted by law, AEMO and its officers, employees and consultants
involved in the preparation of this document:
      •   make no representation or warranty, express or implied, as to the currency, accuracy, reliability or
          completeness of the information in this document; and
      •   are not liable (whether by reason of negligence or otherwise) for any statements or representations
          in this document, or any omissions from it, or for any use or reliance on the information in it.

VERSION CONTROL

Version         Release date              Changes

1.0             30/7/2020                 Initial release

© 2020 Australian Energy Market Operator Limited. The material in this publication may be used in
accordance with the copyright permissions on AEMO’s website.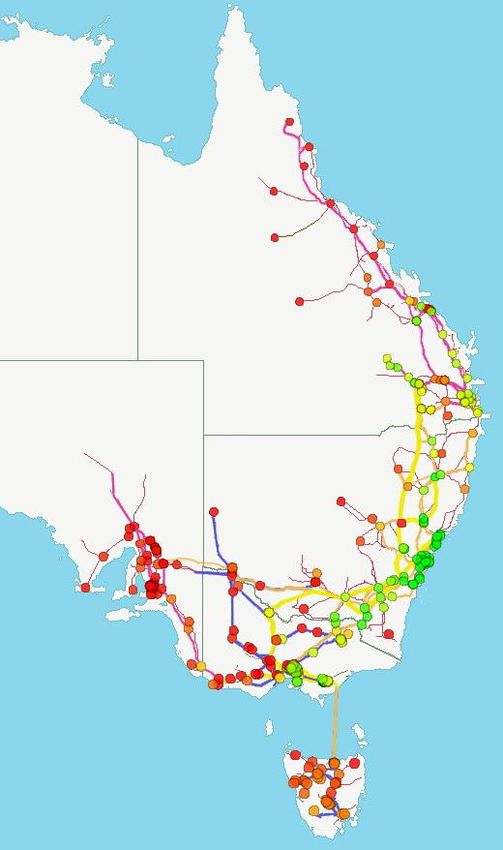
Contents
Summary                                                                                    7

A7.1.     Introduction                                                                     8

A7.2.     Renewable Integration Study                                                      11
A7.2.1    Key system security challenges from Stage 1 of the Renewable Integration Study   11

A7.3.     System strength outlook                                                          13
A7.3.1    Importance of system strength, and roles and responsibilities                    13
A7.3.2    NEM-wide system strength outlook                                                 14
A7.3.3    New South Wales system strength outlook                                          17
A7.3.4    Queensland system strength outlook                                               21
A7.3.5    South Australia system strength outlook                                          25
A7.3.6    Tasmania system strength outlook                                                 28
A7.3.7    Victoria system strength outlook                                                 31

A7.4.     Inertia outlook                                                                  36
A7.4.1    Importance of inertia, and roles and responsibilities                            36
A7.4.2    NEM mainland inertia outlook                                                     37
A7.4.3    New South Wales inertia outlook                                                  38
A7.4.4    Queensland inertia outlook                                                       39
A7.4.5    South Australia inertia outlook                                                  40
A7.4.6    Tasmania inertia outlook                                                         42
A7.4.7    Victoria inertia outlook                                                         42

A7.5.     Renewable Energy Zone opportunities                                              44
A7.5.1    Introduction to system strength investments                                      44
A7.5.2    Assessing costs for system strength investment options                           45
A7.5.3    System strength remediation costs in the ISP                                     46

A7.6.     South Australia in transition                                                    47
A7.6.1    Introduction                                                                     47
A7.6.2    Project EnergyConnect                                                            48
A7.6.3    Current South Australian power system requirements                               48
A7.6.4    Emerging South Australian system security needs                                  51
A7.6.5    Summary of planning assumptions                                                  53
A7.6.6    Conclusion                                                                       57

© AEMO 2020 | 2020 ISP Appendix 7. Future Power System Security                             3

Tables
Table 1      Recommended RIS actions feeding into the ISP                                           12
Table 2      New South Wales projected system strength – Central scenario                           18
Table 3      New South Wales projected system strength – Step Change scenario                       18
Table 4      Queensland projected system strength – Central scenario                                22
Table 5      Queensland projected system strength – Step Change scenario                            22
Table 6      South Australian projected system strength – Step Change and Central scenario          26
Table 7      Tasmanian projected system strength – Step Change and Central scenarios                29
Table 8      Victorian projected system strength – Central scenario                                 33
Table 9      Victorian projected system strength – Step Change scenario                             33
Table 10     REZ system strength remediation cost example                                           45
Table 11     Planning assumptions for the ISP                                                       54

Figures
Figure 1     NEM-wide system strength outlook 2020-21 (left), 2029-30 (centre),2034-35 (right)
             Central scenario                                                                       16
Figure 2     New South Wales system strength (fault level) post contingent requirements             17
Figure 3     Projected Armidale 330 kV fault level duration curves, Central and Step Change
             scenarios                                                                              19
Figure 4     Projected Sydney West 330 kV fault level duration curves, Central and Step Change
             scenarios                                                                              19
Figure 5     Projected Wellington 330 kV fault level duration curves, Central and Step Change
             scenarios                                                                              20
Figure 6     Projected Newcastle 330 kV fault level duration curves, Central and Step Change
             scenarios                                                                              20
Figure 7     Projected Darlington Point 330 kV fault level duration curves, Central and Step
             Change scenarios                                                                       21
Figure 8     Queensland system strength (fault level) post contingent requirements                  21
Figure 9     Projected Western Downs 275 kV fault level duration curves, Central and Step
             Change scenarios                                                                       23
Figure 10    Projected Greenbank 275 kV fault level duration curves, Central and Step Change
             scenarios                                                                              23
Figure 11    Projected Ross 275 kV fault level duration curves, Central and Step Change scenarios   24
Figure 12    Projected Gin Gin 275 kV fault level duration curves, Central and Step Change
             scenarios                                                                              24

© AEMO 2020 | 2020 ISP Appendix 7. Future Power System Security                                      4
Figure 13 Projected Lilyvale 132 kV fault level duration curves, Central and Step Change
scenarios 25
Figure 14 South Australia system strength (fault level) post-contingent requirements 25
Figure 15 Projected Davenport 275 kV fault level duration curves, Central and Step Change
scenarios 27
Figure 16 Projected Para 275 kV fault level duration curves, Central and Step Change scenarios 27
Figure 17 Projected Robertstown 275 kV fault level duration curves, Central and Step Change
scenarios 28
Figure 18 Tasmanian system strength (fault level) system normal requirements 28
Figure 19 Projected George Town 220 kV fault level duration curves, Central and Step Change
scenarios 30
Figure 20 Projected Risdon 110 kV fault level duration curves, Central and Step Change
scenarios 30
Figure 21 Projected Waddamana 220 kV fault level duration curves, Central and Step Change
scenarios 31
Figure 22 Projected Burnie 110 kV post-contingent fault level duration curves, Central and Step
Change scenarios 31
Figure 23 Victorian system strength (fault level) post-contingent requirements 32
Figure 24 Projected Thomastown 220 kV fault level duration curves, Central and Step Change
scenarios 34
Figure 25 Projected Moorabool 220 kV fault level duration curves, Central and Step Change
scenarios 34
Figure 26 Projected Dederang 220 kV fault level duration curves, Central and Step Change
scenarios 35
Figure 27 Projected Hazelwood 500 kV fault level duration curves, Central and Step Change
scenarios 35
Figure 28 NEM mainland inertia outlook (Tasmania excluded), Central and Step Change
scenarios 38
Figure 29 Projected inertia in the New South Wales grid, Central and Step Change scenarios 39
Figure 30 Projected inertia in the Queensland grid, Central and Step Change scenarios 40
Figure 31 Projected inertia in the South Australia grid, Central and Step Change scenarios 41
Figure 32 Projected inertia in the Tasmania grid, Central and Step Change scenarios 42
Figure 33 Projected inertia in the Victoria grid, Central and Step Change scenarios 43
Figure 34 Projection of FFR required to efficiently operate South Australia during island
conditions 51
© AEMO 2020 | 2020 ISP Appendix 7. Future Power System Security 52020 ISP Appendices
Appendix 1. Stakeholder Engagement Appendix 6. Future Power System Operability
Stakeholder engagement program and timelines Power system operability models and input
Consultation on Draft 2020 ISP NEM-wide operability outlook
Appendix 2. Cost Benefit Analysis Regional risks and insights
Understanding the cost benefit analysis Appendix 7. Future Power System Security
Determining the least-cost development path Renewable Integration Study
for each scenario System strength outlook
Assessing benefits of candidate development Inertia outlook
paths under each scenario REZ opportunities
Testing the resilience of candidate development South Australia in transition
paths to events that may occur Appendix 8. Resilience and Climate Change
Appendix 3. Network Investments Resilience in the 2020 ISP
Network investments in the optimal Forecasting climate impacts on energy systems
development path Planning for a climate-resilient network
Committed ISP projects Next steps
Actionable ISP projects Appendix 9. ISP Methodology
Future ISP projects recommended with
Overview of ISP methodology
preparatory activities
Inputs
Other future ISP projects
Engineering assessment
Addressing network congestion
Market modelling
Alternatives considered Model outputs
Appendix 4. Energy Outlook Appendix 10. Sector Coupling
Future energy supplies for a resilient power
Hydrogen
system
EVs
Unlocking VRE through REZs Gas
Managing variable energy supplies through Energy efficiency
energy storages and firming technologies
Bioenergy
Development outlooks across scenarios
NEM emission intensity with the least-cost
optimal development path
Appendix 5. Renewable Energy Zones
Integrating large volumes of VRE
REZ framework and design principles
ISP REZ development
REZ scorecards
© AEMO 2020 | 2020 ISP Appendix 7. Future Power System Security 6Summary
This Future Power System Security appendix reviews the requirements for system security services such as
inertia, system strength, voltage control, and frequency control within the ISP optimal development path.
Focus is also given to detailing how these aspects are managed for the for South Australian region, as well as
how to optimise these services into the future as part of REZ development.
• Power system security relies on many services that have historically been provided by thermal
synchronous generation. New technologies and approaches to these services are required as the
power system continues to transform and becomes increasingly dominated by small- and large-scale
inverter-based resources (IBR).
• AEMO has performed engineering studies of the power system to identify future power system
security requirements. The areas considered are voltage control, transient stability, system strength,
frequency management, power system inertia, and dispatchability.
• The ISP recommends network investments that efficiently provide a range of power system security
services. The design of REZs can deliver economies of scale by incorporating services for delivering
system strength, inertia, and voltage control.
• The ISP looks out to 2042, outlining a dynamic whole-of-system roadmap for nationally significant and
essential investments to ensure the efficient, secure and reliable operation of the power system, and
incorporates the work of AEMO’s Renewable Integration Study (RIS)1. The ISP assumes that RIS
recommendations are ultimately implemented, while focusing on medium- and long-term solutions
that go far beyond the RIS horizon.
• This ISP finds:
– Many areas are already displaying low system strength issues, but by 2029-30 the retirement of
thermal generators and high penetration of inverter-based devices would lead to lowering of
system strength in South West Victoria, Northern New South Wales, and Central Queensland.
Investments to system strength will be required, and new resources will need to provide for this
within their designs.
– Demonstrable improvements in system strength are expected in areas where new transmission is
proposed as part of the optimal development path, for example in REZs in Northern New South
Wales.
– If a NEM minimum inertia level is considered, then by 2034-35 a shortfall of over 19 GWs could
occur due to synchronous plant retirements and other remediating investments will be needed.
This requirement should be assessed in conjunction with other system security requirements such
as system strength in order to minimise total investments needed.
• Near-term, detailed assessments incorporating the latest minimum demand forecasts will be
conducted as part of the 2020 System Strength, Inertia and Network Support and Control Ancillary
Services (NSCAS) reports due to assess requirements and declaration of any new shortfalls by the end
of 2020.
1
AEMO. Renewable Integration Study: Stage 1 Report, at https://www.aemo.com.au/-/media/files/major-publications/ris/2020/renewable-integration-study-
stage-1.pdf.
© AEMO 2020 | 2020 ISP Appendix 7. Future Power System Security 7A7.1. Introduction
This appendix is part of the 2020 ISP, providing more detail on the Power System Security requirements
across various scenarios in the 2020 ISP (see 2020 ISP Section D3).
There are system security considerations beyond just ensuring sufficient capacity from generation and
transmission networks2, and these must be considered to ensure power system developments are
operationally adequate and also secure and reliable.
As conventional synchronous generation retires, the suite of services such as system strength, inertia,
frequency control, and reactive power support, will need to continue to be closely monitored and studied, as
well as the efficacy of existing protection and control schemes. Coordination and locational optimisation for
the acquisition of these services will be an important consideration as the power system transitions to higher
levels of inverter-based resources within REZs.
Most of the system strength and inertia in the NEM today is provided incidentally
System strength and inertia are critical requirements for a stable and secure power system. A minimum level
of each is required for the power system to operate in a stable manner, and for recovery following a system
disturbance. The majority of system strength and inertia in the NEM today is provided by power stations that
are approaching the end of their technical life, and many are expected to retire in the next 20 years of this
ISP. The services they provide depend upon a range of factors including the level of interconnection of the
system, protection equipment, and IBR capability. The projected closure or mothballing of these power
stations within the planning horizon of this ISP signals an urgent need for the market to provide additional
security services either through investment in new assets, retrofitting of existing assets, or contracting for
service provision from potential providers.
The timing of regional shortfalls is closely linked to the timing of thermal power station closures
and minimum demand projections which are highly uncertain
To meet regional system strength requirements, this ISP projects the need for significant further investment
such as large synchronous condensers to be required to replace the regional services currently provided by
thermal power stations. The timing and scale of regional system strength shortfalls depends on the timing of
exits of thermal power stations (including any generation outages) and the minimum demands in each region
(driven by increasing consumer-based IBR such as distributed PV). AEMO is currently reviewing minimum
demand projections based on the latest trends and policy information. A steeper decline in the projection of
minimum demand is anticipated and could bring forward the timing and increase the scale of these shortfalls.
AEMO will report further on this in the 2020 Inertia Report and 2020 System Strength Report.
System strength remediation will become increasingly common over the next few years
In parallel with emerging regional system strength and inertia shortfalls to replace the services provided by
thermal generators, IBR such as wind farms and solar PV connecting to weaker areas of the grid will also need
to offset their impact on system strength through remediation (referred to as “do no harm”).
In recent years, many new generator connections have increasingly been required to provide system strength
remediation. Moving forward just a few years, most connections in the NEM are anticipated to need to fund
solutions that remediate their system strength impact through the mid-2020s and beyond. Today, this
2
AEMO. Power System Requirements, at https://www.aemo.com.au/-/media/Files/Electricity/NEM/Security_and_Reliability/Power-system-requirements.pdf.
© AEMO 2020 | 2020 ISP Appendix 7. Future Power System Security 8remediation is most typically in the form of synchronous condensers for small remediation requirements.
Without remediation, and when the regional system strength is not sufficient, increasing numbers of
generators would be constrained down or even off the system, so it is important to plan investments to
address this increasing need in the most efficient manner.
Advanced grid forming controls on inverters (once demonstrated) may be able to reduce these do-no-harm
requirements, or even form part of the solution. Other solutions such as generator contracting or conversion
of generators to synchronous condensers will be viable if economical. It is critical that these developments be
promoted and facilitated through market and policy reforms.
Strategic investments can play an important role in realising efficient and robust outcomes
It is important that consideration also be given to all needs and the relative benefits of differing technologies
in meeting some, part, or many of the services needed, if not now, then in the future. For example, solutions
to address inertia, frequency control, system strength and reactive control must be considered together, not
independently. Some available technologies address multiple needs, which may be preferable as the
investment choice in the near term, if efficient and economic. Alternative technologies that address needs are
also developing and may be more economic in the future.
The development of inverter and control systems providing grid forming services could provide alternative
options in part to addressing the requirements, and need to be considered when deciding on strategy for
future investment – for example, decide now on technology solutions that best meet needs now, and assess
alternatives in the future for future needs; or invest now in assets that provide a range of services for needs
now and potential future needs.
For example, the inclusion of high-inertia flywheels on synchronous condensers which could be delivered by
TNSPs to meet fault level requirements at key nodes could also provide the majority of the inertia required
across the NEM in the coming 20 years. The cost of these flywheels is a small percentage of the cost for a
synchronous condenser if it is part of the initial design and construction, whereas adding high-inertia
flywheels after a synchronous condenser is already commissioned is often impractical or cost-prohibitive. If
not included in the original plant, alternatives would be needed if inertia becomes a future additional
requirement.
The four large synchronous condensers being installed in South Australia (see Appendix 3) are being fitted
with high-inertia flywheels. This is a good example of a robust strategic investment that provides a wide
range of system security services both for current needs and expected future requirements. ElectraNet
estimated that the cost of adding flywheels represented only 3% of the total capital works3.
The design of emerging REZs can benefit from ElectraNet’s experience. Economies of scale can be realised by
incorporating centralised synchronous condensers to deliver system strength, inertia, and voltage control to
REZs. It is clear that a centralised synchronous condenser solution is currently more economic than a series of
small solutions on a project-by-project basis. However, realising a coordinated and centralised solution is yet
to be demonstrated under the existing regulatory framework, one that allocates responsibility for system
strength across multiple parties who are in direct competition and at different stages of project development
and financing.
As the NEM transitions to a grid increasingly dominated by IBR, AEMO is also placing an increasing focus on
management of active power control and management of ramping events due to wind and solar (including
DER) variability. This is increasingly affecting power system security safeguards such as under frequency load
shedding schemes, and in some cases over frequency load shedding schemes.
3
ElectraNet. Addressing the System Strength Gap in South Australia, at https://www.aer.gov.au/system/files/ElectraNet%20-%20System%20Strength%20
Economic%20Evaluation%20Report%20-%2018%20February%202018.PDF.
© AEMO 2020 | 2020 ISP Appendix 7. Future Power System Security 9The impact of reducing minimum demands Periods of minimum demand place the greatest pressures on synchronous generation to decommit. As the amount of synchronous generation online reduces, the need for remediation of system services increases. Existing schemes to arrest under-frequency and over-frequency events can also be less effective under these conditions. Intervention already occurs in South Australia and Tasmania to ensure system strength and inertia requirements are maintained, and in Victoria to reduce high voltages on the 500 kV network. When assessing options to address shortfalls, longer-term forecasts in minimum demand are key inputs to projecting the timing and scale of shortfalls, and where co-ordination or optimisation of solutions to address all the system services is warranted to deliver efficient outcomes for consumers. For example, it can be optimal to address a voltage control issue with a higher-cost dynamic reactive support option like a synchronous condenser instead of cheaper static reactive support such as a capacitor or reactor, if system strength shortfalls are also expected to materialise within a short period. Revised minimum demand forecasts currently being finalised for the 2020 ESOO are anticipated to be lower than the minimum demands that were used in current system strength and inertia projections in this ISP. The revised minimum demand forecasts include the short term impact of COVID-19 and the latest trends in distributed PV sales, above those forecast in 2019. The projected decline in minimum demand will bring forward the timing and increase the scale of the identified shortfalls. Due to the significance, once these revised forecasts are finalised, the system strength and inertia implications will be incorporated in the NSCAS shortfall outlook report, and the combined System Strength and Inertia Shortfall Outlook report, both due to for release late in 2020. These reports will revise the projections outlined in this ISP. The Appendix is set out in the following sections: • A7.2 Renewable integration study (RIS) – gives an overview of the interactions between the recent RIS study outcomes, and how these have fed into the ISP studies and results. • A7.3 System strength outlook – AEMO has defined minimum three phase fault level requirements that need to be maintained at specific fault level nodes across the NEM to ensure the network is operated in a stable and secure manner. Projections and anticipated shortfalls of system strength are detailed, as well as the drivers of these shortfalls. • A7.4 Inertia outlook – AEMO has defined minimum and secure inertia levels that need to be available in each NEM region in the event of that region operating as an island, to ensure the network is operated in a stable and secure manner. Projections and anticipated shortfalls of inertia are detailed, as well as the drivers and potential remediation of the shortfalls. The adequacy of the existing inertia framework is highlighted with reference to the recent RIS. • A7.5 REZ opportunities – when assessing REZ network solutions there is also a need for consideration of system strength mitigation and associated costs. An example for a large-scale REZ with different network options and remediation strategies is presented. Results highlight the benefits of a coordinated approach to investments in transmission and system strength to minimise overall costs and reduce costs for consumers. • A7.6 South Australia in transition – provides details on the growing system security challenges being experienced in the South Australian region as the penetration levels of distributed PV and IBR grow, and explores AEMO’s planning assumptions relating to the South Australian region. © AEMO 2020 | 2020 ISP Appendix 7. Future Power System Security 10
A7.2. Renewable
  Integration Study

AEMO’s RIS takes a deeper review into the specific system implications and challenges associated with the
integration of large amounts of variable inverter-based renewable generation and decentralised energy on
the power system, as part of a multi-year plan to maintain system security in a future NEM with a high share
of renewable resources.
The RIS Stage 1 report published in April 20204 is a complementary publication to the 2020 ISP; the Draft
2020 ISP established the core inputs for the RIS Stage 1 analysis, and the RIS Stage 1 report supplied insights
into the 2020 ISP. AEMO envisages an ongoing feedback loop between the RIS and the ISP analysis and
publications.
The majority of RIS Stage 1 insights were related to operational and short-term measures to ensure the
security of the power system out to 2025, based on the technical limits of the power system to integrate
renewables (not the economic limits). The RIS concluded that, in the coming five-year period:
• The NEM power system will continue its significant transformation to world-leading levels of renewable
  generation. This will test the boundaries of system security and current operational experience.
• If the recommended actions are taken to address the regional and NEM-wide challenges identified,
  including the required network upgrades as identified in the ISP, the NEM could be operated securely with
  up to 75% instantaneous penetration of wind and solar. The RIS did not examine the economics of the
  requirements, rather focused on what is needed, and concluded that, technically, this and even higher
  levels were possible if the appropriate investments were made – inherently reliant upon suitable reform of
  the market to be realised.
• If, however, the recommended actions are not taken, the identified operational limits will constrain the
  maximum instantaneous penetration of wind and solar to between 50% and 60% in the NEM.
The 2020 ISP outlines a dynamic whole-of-system roadmap for nationally significant and essential
investments to ensure the efficient, secure and reliable operation of the power system. The ISP assumes the
RIS recommendations are ultimately implemented, while also focusing on medium and long-term solutions
that go beyond the RIS horizon.

A7.2.1                Key system security challenges from Stage 1 of the
                      Renewable Integration Study
The RIS Stage 1 report identified a number of key challenges and explored system limits that impact wind and
solar instantaneous penetration in the NEM power system, specifically:
• Limits that affect how much wind and solar PV generation can operate at any one time, and what the
  limits are NEM-wide and for individual regions.

4
    See Stage 1 report and appendices, with other RIS information and documents, at https://aemo.com.au/energy-systems/major-publications/renewable-
     integration-study-ris.

© AEMO 2020 | 2020 ISP Appendix 7. Future Power System Security                                                                                        11
• How close NEM regions are to these limits now, and how close they are expected to be by 2025.
• Actions that can overcome these barriers so the system can operate securely with higher penetrations of
wind and solar generation.
While it identified recommended actions that would be required to meet the system’s technical needs, it did
not investigate the economics of proposed actions or all the specific mechanisms that could be implemented.
The RIS Stage 1 report has fed into the ISP and into the ESB’s Post 20255 work and regulatory processes that
the AEMC is progressing6.
Recommended actions relating to system strength and inertia are shown in Table 1 below.
Table 1 Recommended RIS actions feeding into the ISP
RIS action ISP section
Investigate the introduction of a system inertia The outcomes from consideration of a NEM minimum inertia level
safety net for the mainland NEM, under system net are explored further in Section A7.4.2.
intact conditions
Improving the transparency of system strength System strength outcomes are demonstrated in a number of ways
across the grid in the ISP:
• Expected available fault levels across the NEM (Figure 1).
• Expected TNSP fault level node fault levels (Section A7.3.2).
• Available fault levels and remediation amounts in identified REZs
(see REZ scorecards in Appendix 5).
• Publishing of results on an interactive map.
Promoting the development of scale-efficient Appendix 5 discusses the development of REZs in the NEM.
renewable energy zones (REZs) that are designed
for the connection of IBR
Presenting evidence that coordinated system Section A7.5 demonstrates the need to co-ordinate network
strength services can deliver positive net market upgrades and system strength remediation in order to be able to
benefits develop a least-cost solution.
Outlining an efficient strategy for the coordinated This will be explored further in the 2020 Inertia Report and 2020
delivery of system strength services System Strength Report, expected for publication by the end of
2020. This will ensure incorporation of anticipated updates to
minimum demand forecasts, and the exploration of additional
sensitivities.
5
COAG. Post 2025. At http://www.coagenergycouncil.gov.au/energy-security-board/post-2025.
6
AEMC. System Services Rule Changes, at https://www.aemc.gov.au/rule-changes/synchronous-services-markets.
© AEMO 2020 | 2020 ISP Appendix 7. Future Power System Security 12A7.3. System strength
outlook
System strength is a measure of the ability of a power system to maintain and control the voltage waveform
under normal conditions and to return to a steady state condition following a system disturbance 7.
Traditionally synchronous machines have provided, and continue to provide a source of system strength,
while IBR generally require a level of system strength to be provided at the location they connect to in order
to be able to operate.
Results from the both the Central and Step Change scenarios have been assessed. System strength
projections have been provided for the fault level nodes for each of the regions.
AEMO will also publish standalone 2020 System Strength and Inertia Reports by the end of 2020. These
reports will consider a wider range of sensitivities than considered in this ISP, as well as assessing system
strength requirements and shortfall assessments for the next 10-year period.
This section:
• Notes the importance of system strength and the roles and responsibilities for its treatment (A7.3.1).
• Provides a NEM-wide system strength outlook (A7.3.2).
• Details the system strength outlook for each region (A7.3.3 to A7.3.7).
A7.3.1 Importance of system strength, and roles and
responsibilities
The increasing integration of IBR across the NEM has implications for the engineering design of the future
transmission system. As clusters of IBR connect in close proximity, generators will need to offset their impact
on system strength, and TNSPs will need to ensure a basic level of fault current across their networks.
Key areas of system strength are discussed in detail in AEMO’s white paper System Strength Explained8, and
include steady state voltage management, voltage dips, fault ride-through, power quality and operation of
protection9.
In the NEM, the division of responsibilities for the provision of system strength is as follows:
• AEMO is required to determine the fault level requirements across the NEM and identify whether a fault
level shortfall is likely to exist now or in the future. The System Strength Requirements Methodology 10
defines the process AEMO must apply to determine the system strength requirement at each node.
7
A system disturbance is an unplanned contingency on the power system, such as a high-voltage network fault (i.e. short-circuit) or an unplanned generator
or large load disconnection.
8
AEMO. System strength in the NEM explained, at https://aemo.com.au/-/media/files/electricity/nem/system-strength-explained.pdf.
9
Protection maloperation can result in additional generation tripping during power system disturbances, loss of load due to maloperation of network
equipment, and public safety risks if faults are not cleared.
10
AEMO. System Strength Requirements Methodology, at http://www.aemo.com.au/-/media/Files/Electricity/NEM/Security_and_Reliability/System-Security-
Market-Frameworks-Review/2018/System_Strength_Requirements_Methodology_PUBLISHED.pdf.
© AEMO 2020 | 2020 ISP Appendix 7. Future Power System Security 13• The local TNSP is required to provide system strength services to meet the minimum three phase fault
levels at relevant fault level nodes if AEMO has declared a shortfall.
• A connecting generator is required to implement or fund system strength remediation, such that its
connection (or altered connection) does not have an adverse impact on system strength, assessed in
accordance with AEMO’s system strength impact assessment guidelines.
Regional system strength requirements
As covered in Section A7.3.2, AEMO has published guidelines with regards to system strength and mitigation
requirements for new generation connections11. TNSPs are also required to maintain minimum fault levels at
specified nodes within their networks. Should a shortfall be identified by AEMO, the TNSP is responsible for
ensuring that system strength services are available to maintain the fault levels determined by AEMO. AEMO
has published methodologies and assessments relating to TNSP responsibilities in maintaining minimum fault
levels at specific fault level nodes12.
As IBR continue to displace conventional generation, it will become increasingly important for TNSPs to
coordinate system strength solutions. REZs that are strategically designed with system strength in mind will
benefit from economies of scale to achieve optimal investment outcomes.
Local system strength remediation
Because some types of generation, including most solar and wind generators currently being developed and
built, have not been designed to provide inherent contribution to system strength, REZs can be susceptible to
low system strength conditions. Low system strength can impact the stability and dynamics of generating
systems’ control systems and the ability of the power system to remain in stable operation. Appendix 5
provides detail on REZs that are most susceptible to low system strength.
Based on projections in this ISP, many renewable developments contemplated in the 2020s are likely to
require some level of system strength remediation for their connection, and from the 2030s onwards, most
renewable developments would be expected to require system strength remediation. In addition, as existing
thermal power stations exit, the inherent system strength (and a range of other system services) that the
synchronous generators provided needs to be replaced.
Section A7.5 details outcomes highlighting that, when developing REZs:
• System strength planning can benefit from economies of scale.
• Coordinated solutions to providing system strength, to which generators contribute, are expected to be
more economic than multiple small-scale solutions developed at each wind or solar farm 13.
A7.3.2 NEM-wide system strength outlook
The initial system strength requirements determined by AEMO in 2018 are currently under review, with
detailed electromagnetic transient (EMT) studies now being utilised for all regions to refine the fault level
requirements. Updates to some regions have been progressively published relating to where outcomes have
highlighted shortfalls.
To date, AEMO has published14 fault level shortfalls for:
AEMO. System Strength Impact Assessment Guidelines, at http://aemo.com.au/Electricity/National-Electricity-Market-NEM/Security-and-reliability/System-
11
Strength-Impact-Assessment-Guidelines.
12
AEMO. System Strength Requirements Methodology, 2018 System Strength Requirements & Fault Level Shortfalls, at http://aemo.com.au/Electricity/National-
Electricity-Market-NEM/Security-and-reliability/System-Security-Market-Frameworks-Review.
13
Section 4.3.2 of AEMO’s 2017 Victorian Annual Planning Report also previously included a worked example that demonstrated the benefits of system
strength planning, at https://www.aemo.com.au/-/media/Files/Electricity/NEM/Planning_and_Forecasting/VAPR/2017/2017-VICTORIAN-ANNUAL-
PLANNING-REPORT.pdf.
14
AEMO. Notices of shortfalls in inertia and fault level, at https://www.aemo.com.au/energy-systems/electricity/national-electricity-market-nem/system-
operations/system-security-market-frameworks-review.
© AEMO 2020 | 2020 ISP Appendix 7. Future Power System Security 14• South Australia (Davenport 275 kV fault level node). • Tasmania (George Town, Burnie, Waddamana and Risdon 220 kV fault level nodes). • Queensland (Ross 275 kV fault level node). • Victoria (Red Cliffs 220 kV fault level node). Fault level requirements shown in these ISP projections are based on these latest studies, noting that these updated fault level requirements are still under review. This ISP examined the projected outcomes from the Central and Step Change scenarios, because these project a higher IBR uptake and are expected to have greater likelihood of future system strength shortfalls. In the 2020 System Strength and Inertia report, AEMO will update projections of system strength assessments with revised minimum demand forecasts that are currently being prepared for the 2020 ESOO. The 2020 System Strength and Inertia report will focus on the immediate 5-10 year outlook and review a wider range of sensitivities to assess the risks of potential system strength shortfalls in this period, and may declare additional system strength shortfalls to be addressed by TNSPs. Results shown allow quantification of potential shortfalls, timings, and locations. Where new pumped hydro or other synchronous machines have been part of the optimal market modelling outcomes, generic contributions from these units have been derived and included in results. Future fault level node definitions and fault level requirements Projections of fault levels have been assessed using the latest fault level node and minimum fault level requirements. It is noted that these have been defined for the existing power system and locations of generation. As the generation and transmission systems develop, both the fault level nodes and fault level requirements will change. For example, where there are significant coal-fired generation retirements in a generation centre that is currently synchronous, it may be more appropriate to change the fault level nodes and their requirements than to try to maintain historic fault levels at the old fault level nodes. It is also anticipated that fault level node definitions will need to shift to where large clusters of new generation are being built, for example, closer to major REZs. AEMO needs to undertake detailed system strength studies prior to the projected generation retirements to more accurately determine system strength mitigation options, or options to allow operation of the network at lower fault levels. This work must provide outcomes sufficiently ahead to enable the requisite economic assessments and procurement of equipment. Procurement of system strength mitigation such as large synchronous condensers is expected to take at least 18 months to two years; there is a risk of being caught out by early generation retirements or failures, as these are aspects not easily forecast. In some locations, network upgrades may also be required to facilitate integration of synchronous condensers due to (local) increases in fault level. Other technical solutions such as grid forming inverters associated with battery energy storage systems (BESS) are anticipated to be able to provide system services in the future and reduce the need for synchronous machines to provide fault current and inertia. Fault level requirements and potential remediation options will need to adapt to take new technologies into account. Results from the Step Change scenario also highlight the need to appreciate the risks associated with early coal unit retirements. © AEMO 2020 | 2020 ISP Appendix 7. Future Power System Security 15
Available fault levels
For this ISP, AEMO used the Available Fault Level calculation methodology15 to perform high level system
strength impact assessments (see Figure 1), and the more comprehensive System Strength Requirements
Methodology16 for determining system strength requirements at fault level nodes (see the following sections).
Snapshot periods from the market modelling outputs with low levels of synchronous generation online have
been analysed across the NEM for particular years.
Figure 1 demonstrates areas that already have low system strength, and projects where system strength is
expected to decrease unless investments are made.
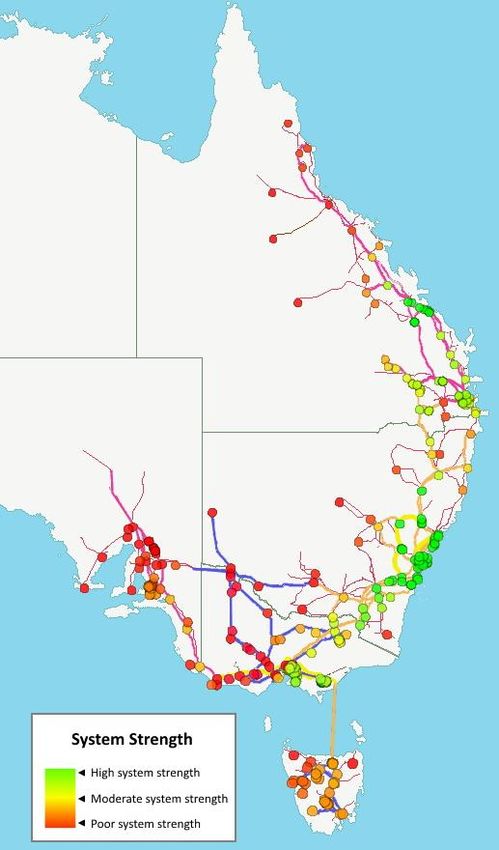
Figure 1 NEM-wide system strength outlook 2020-21 (left), 2029-30 (centre), 2034-35 (right), Central
scenario
Note: For system strength analysis, the timing of VNI West was modelled as 2034-35, however the actual timing of this augmentation is
subject to decision rules and could be as early as 2027-28.
In Figure 1:
• Results for 2020-21 show areas with existing low system strength such as Western Victoria, South West
New South Wales, Northern Queensland, and Tasmania.
• In 2029-30:
– The 330 kV transmission lines, as well as the synchronous condensers associated with Project
EnergyConnect, will improve the system strength outlook around central South Australia, western
Victoria, and south-west New South Wales. The upgrades being undertaken in the Western Victoria
Transmission Network Project will also improve the system strength outlook in western Victoria,
demonstrating the importance of taking into account network upgrades for system strength
assessments.
15
AEMO. System Strength Impact Assessment Guidelines, at https://www.aemo.com.au/-/media/Files/Electricity/NEM/Security_and_Reliability/System-
Security-Market-Frameworks-Review/2018/System_Strength_Impact_Assessment_Guidelines_PUBLISHED.pdf.
16
AEMO. System Strength Requirements Methodology, 2018 System Strength Requirements & Fault Level Shortfalls, at http://aemo.com.au/Electricity/National-
Electricity-Market-NEM/Security-and-reliability/System-Security-Market-Frameworks-Review.
© AEMO 2020 | 2020 ISP Appendix 7. Future Power System Security 16– High levels of new IBR are projected in the optimal development path, and these are expected to be
required to include system strength remediation due to low system strength emerging or worsening in
south-west Victoria, northern New South Wales and central Queensland.
• In 2034-35:
– Retirement of thermal power stations such as Vales and Eraring will significantly reduce available
system strength, including in central New South Wales.
– Improvements in system strength are expected as a result of new transmission that is delivered as part
of the optimal development path, for example, in REZs in northern New South Wales, and the second
QNI interconnector. As projected additional IBR connect to these areas later in the timeframe, and
additional coal plant retires, the available system strength will reduce.
A7.3.3 New South Wales system strength outlook
AEMO has determined the following fault level nodes for New South Wales. They represent a metropolitan
load centre, a synchronous generation centre, areas with high IBR, and areas electrically remote from
synchronous generation. The System Strength Requirements Methodology17 outlines the process for
determining the system strength requirement at each node.
Figure 2 New South Wales system strength (fault level) post contingent requirements
Armidale 330 kV
3,000 MVA
Newcastle 330 kV
7,100 MVA
Wellington 330 kV
1,850 MVA
Sydney West 330 kV
8,050 MVA
Darlington Point 330 kV
600 MVA
The ISP system strength assessments for New South Wales are outlined in Table 2 and Table 3. Fault level
requirements shown are based on draft EMT studies that are ongoing. The ISP studies have found that:
• The proposed Project EnergyConnect (see Section 3) is projected to improve system strength in South
West New South Wales, as the network upgrade includes synchronous condensers at Buronga and close
to Darlington Point.
17
AEMO. System Strength Requirements Methodology, 2018 System Strength Requirements & Fault Level Shortfalls, at http://aemo.com.au/Electricity/National-
Electricity-Market-NEM/Security-and-reliability/System-Security-Market-Frameworks-Review.
© AEMO 2020 | 2020 ISP Appendix 7. Future Power System Security 17• Following the exit of Vales Point, Mt Piper and Eraring Power Stations, there are projected shortfalls at the
Sydney West and Newcastle fault level nodes.
Table 2 New South Wales projected system strength – Central scenario
Fault level node Duration Current requirements met Comment
curve
Currently Up to 2025 Up to 2035
Armidale 330 kV Figure 3 Yes Yes Yes Increases following transmission
network upgrades to QNI
Sydney West 330 kV Figure 4 Yes Yes 1,600 MVA Results from Vales Point closure in
potential 2030, and Eraring in 2033
shortfall †
Wellington 330 kV Figure 5 Yes Yes Yes
Newcastle 330 kV Figure 6 Yes Yes 1,900 MVA Results from Vales Point closure in
potential 2030, and Eraring in 2033
shortfall †
Darlington Pt 330 kV Figure 7 Yes Yes Yes
† Although AEMO projects that a shortfall may arise before 2035, a fault level shortfall is not formally declared at this stage.
Table 3 New South Wales projected system strength – Step Change scenario
Fault level node Duration Current requirements met Comment
curve
Currently Up to 2025 Up to 2035
Armidale 330 kV Figure 3 Yes Yes Yes Increases following transmission network
upgrades to QNI
Sydney West 330 kV Figure 4 Yes Yes 2,700 MVA Results from Vales Point closure in 2026,
potential Mt Piper in 2032 and Eraring in 2033
shortfall †
Wellington 330 kV Figure 5 Yes Yes 100 MVA Remediation at Sydney West and
potential Newcastle nodes will also resolve this
shortfall † shortfall.
Newcastle 330 kV Figure 6 Yes Yes 2,700 MVA Results from Vales Point closure in 2026,
potential Mt Piper in 2032 and Eraring in 2033
shortfall †
Darlington Pt 330 kV Figure 7 Yes Yes Yes
† Although AEMO projects that a shortfall may arise before 2035, a fault level shortfall is not formally declared at this stage.
The following figures show the projected fault level duration curves for each fault level node in New South
Wales against the minimum fault level requirement, highlighting:
• A forecast step increase at Darlington Point when Project EnergyConnect is commissioned in 2023-24,
because of the new synchronous condensers associated with the upgrade. TransGrid’s preferred route for
Project EnergyConnect is now anticipated to be a direct path from Buronga to Wagga Wagga, rather than
via the existing Darlington Point substation18. While an increase in fault level is still expected at the
18
TransGrid. Transmission Annual Planning Report, at https://www.transgrid.com.au/what-we-do/Business-Planning/transmission-annual-
planning/Documents/2020%20Transmission%20Annual%20Planning%20Report.pdf.
© AEMO 2020 | 2020 ISP Appendix 7. Future Power System Security 18Darlington Point substation, it will not be as high as the projections shown. Further analysis will be included in the 2020 System Strength and Inertia Report. • A projected step increase at Armidale when the projected QNI Medium and North West New South Wales REZ upgrades are commissioned. • A forecast trend of decreasing system strength across New South Wales due to the retirement of synchronous generation and the transition to IBR. • Large shortfalls at the Newcastle and Sydney West 330 kV buses by 2035 in the Step Change scenario due to accelerated coal unit retirements. Figure 3 Projected Armidale 330 kV fault level duration curves, Central and Step Change scenarios Figure 4 Projected Sydney West 330 kV fault level duration curves, Central and Step Change scenarios © AEMO 2020 | 2020 ISP Appendix 7. Future Power System Security 19
Figure 5     Projected Wellington 330 kV fault level duration curves, Central and Step Change scenarios

Figure 6     Projected Newcastle 330 kV fault level duration curves, Central and Step Change scenarios

© AEMO 2020 | 2020 ISP Appendix 7. Future Power System Security                                           20
Figure 7           Projected Darlington Point 330 kV fault level duration curves, Central and Step Change scenarios

A7.3.4                 Queensland system strength outlook
AEMO has determined the following fault level nodes for Queensland. Together they represent a
metropolitan load centre, a synchronous generation centre, areas with high IBR, and areas electrically remote
from synchronous generation. The System Strength Requirements Methodology19 outlines the process for
determining the system strength requirement at each node.

Figure 8           Queensland system strength (fault level) post contingent requirements

19
     AEMO. System Strength Requirements Methodology, 2018 System Strength Requirements & Fault Level Shortfalls, at http://aemo.com.au/Electricity/National-
     Electricity-Market-NEM/Security-and-reliability/System-Security-Market-Frameworks-Review.

© AEMO 2020 | 2020 ISP Appendix 7. Future Power System Security                                                                                          21
The ISP system strength assessments for Queensland are in Table 4 and Table 5. These studies are based on
the fault level requirements published as part of the Ross shortfall declaration20. Powerlink is currently in the
process of finalising the system strength services in order to meet the declared gap at Ross.
These studies have found that across Queensland, there is a projected trend of decreasing system strength
due to the retirement of synchronous generation and the transition to IBR, particularly in the Step Change
scenario, which projects Callide B retiring in 2029, three Gladstone units retiring by 2025, all Tarong units in
2026 and Tarong North in 2027.
Table 4 Queensland projected system strength – Central scenario
Fault level node Duration Current requirements met Comment
curve
Currently Up to 2025 Up to 2035
Western Downs 275 kV Figure 9 Yes Yes Yes
Greenbank 275 kV Figure 10 Yes Yes Yes
Ross 275 kV Figure 11 Shortfall Shortfall Shortfall Existing shortfall. Powerlink currently
finalising system strength services to
meet the current gap.
Gin Gin 275 kV Figure 12 Yes Yes Yes
Lilyvale 132 kV Figure 13 Yes Yes Yes
Table 5 Queensland projected system strength – Step Change scenario
Fault level node Duration Current requirements met Comment
curve
Currently Up to 2025 Up to 2035
Western Downs 275 kV Figure 9 Yes Yes Yes
Greenbank 275 kV Figure 10 Yes Yes 400 MVA Results from Tarong units retiring in
potential shortfall 2026 and Tarong North in 2027
†
Ross 275 kV Figure 11 Shortfall Shortfall Shortfall Existing shortfall. Powerlink currently
finalising system strength services to
meet the current gap.
Gin Gin 275 kV Figure 12 Yes 70 MVA 350 MVA Results from three Gladstone units
potential potential shortfall retiring by 2025, and Callide B in 2029
shortfall† †
Lilyvale 132 kV Figure 13 Yes Yes 100 MVA Results from three Gladstone units
potential shortfall retiring in 2025, and Callide B in 2029
†
† Although AEMO projects that a shortfall may arise before 2025 or 2035, a fault level shortfall is not formally declared at this stage.
The following figures show the projected fault level duration curves for each fault level node in Queensland,
highlighting:
20
AEMO. 2020 Notice of Queensland system strength requirements and Ross node fault level shortfall, at https://www.aemo.com.au/-/media/files/
electricity/nem/security_and_reliability/system-security-market-frameworks-review/2020/2020-notice-of-queensland-system-strength-requirements-and-
ross-node-fault-level-shortfall.pdf?la=en&hash=398E515E24B7022406B6B391F269CBBB.
© AEMO 2020 | 2020 ISP Appendix 7. Future Power System Security 22• A forecast step increase at Western Downs following the commissioning of the QNI medium upgrade in 2031-32. • Reductions at Greenbank, Gin Gin and Lilyvale due to the retirement of synchronous generators, in the Step Change scenario. • The existing shortfall declared for the Ross node persists across the study timeframes. Figure 9 Projected Western Downs 275 kV fault level duration curves, Central and Step Change scenarios Figure 10 Projected Greenbank 275 kV fault level duration curves, Central and Step Change scenarios © AEMO 2020 | 2020 ISP Appendix 7. Future Power System Security 23
Figure 11    Projected Ross 275 kV fault level duration curves, Central and Step Change scenarios

Figure 12    Projected Gin Gin 275 kV fault level duration curves, Central and Step Change scenarios

© AEMO 2020 | 2020 ISP Appendix 7. Future Power System Security                                        24
Figure 13          Projected Lilyvale 132 kV fault level duration curves, Central and Step Change scenarios

A7.3.5                 South Australia system strength outlook
AEMO has determined the following fault level nodes for South Australia. They represent a metropolitan load
centre, a synchronous generation centre, areas with high IBR, and areas electrically remote from synchronous
generation. The System Strength Requirements Methodology21 outlines the process for determining the
system strength requirement at each node.

Figure 14          South Australia system strength (fault level) post-contingent requirements

21
     AEMO. System Strength Requirements Methodology, 2018 System Strength Requirements & Fault Level Shortfalls, at http://aemo.com.au/Electricity/National-
     Electricity-Market-NEM/Security-and-reliability/System-Security-Market-Frameworks-Review.

© AEMO 2020 | 2020 ISP Appendix 7. Future Power System Security                                                                                          25
The ISP system strength assessments for South Australia are in Table 6. These are based on draft EMT studies
relating to fault level requirements once the new synchronous condensers are installed. This analysis is
ongoing, but the studies have found that the new synchronous condensers at Davenport and Robertstown in
2020-21 are projected to address the current fault level shortfall.
AEMO is currently intervening in the market to ensure the system strength requirements in South Australia 22
will be met on a day-to-day basis until the synchronous condensers are installed.
Table 6 South Australian projected system strength – Step Change and Central scenario
Fault level node Duration Current requirements met Comment
curve
Currently Up to 2025 Up to 2035
Davenport 275 kV Figure 15 Shortfall Yes Yes The current shortfall will be
resolved when synchronous
condensers are installed at
Davenport and Robertstown
(see section A7.6).
Para 275 kV Figure 16 Shortfall Yes Yes The current shortfall will be
resolved when synchronous
condensers are installed at
Davenport and Robertstown
Robertstown 275 kV Figure 17 Shortfall Yes Yes The current shortfall will be
resolved when synchronous
condensers are installed at
Davenport and Robertstown
The following figures show the projected fault level duration curves for each fault level node in South
Australia, highlighting a forecast step increase across South Australia when the new synchronous condensers
are commissioned in 2020-21, and also at Robertstown when Project EnergyConnect is commissioned in
2024-25. The projected system strength shows that requirements are expected to be met in the future.
22
AEMO. Limits Advice, at https://www.aemo.com.au/-/media/Files/Electricity/NEM/Security_and_Reliability/Congestion-Information/2019/Transfer-Limit-
Advice-System-Strength.pdf.
© AEMO 2020 | 2020 ISP Appendix 7. Future Power System Security 26Figure 15 Projected Davenport 275 kV fault level duration curves, Central and Step Change scenarios Figure 16 Projected Para 275 kV fault level duration curves, Central and Step Change scenarios © AEMO 2020 | 2020 ISP Appendix 7. Future Power System Security 27
Figure 17         Projected Robertstown 275 kV fault level duration curves, Central and Step Change scenarios

A7.3.6                 Tasmania system strength outlook
AEMO has determined the following fault level nodes for Tasmania. They represent a metropolitan load
centre, a synchronous generation centre, areas with high IBR, and areas electrically remote from synchronous
generation. The System Strength Requirements Methodology23 outlines the process for determining the
system strength requirement at each node.

Figure 18         Tasmanian system strength (fault level) system normal requirements

23
     AEMO. System Strength Requirements Methodology, 2018 System Strength Requirements & Fault Level Shortfalls, at http://aemo.com.au/Electricity/National-
     Electricity-Market-NEM/Security-and-reliability/System-Security-Market-Frameworks-Review.

© AEMO 2020 | 2020 ISP Appendix 7. Future Power System Security                                                                                          28
You can also read