Technical report Air Cargo Market Analysis
←
→
Page content transcription
If your browser does not render page correctly, please read the page content below

Air Cargo Market Analysis
Central Florida Regional Freight Study

                  technical
                    report

                prepared for

                MetroPlan Orlando

                FDOT District 5, Lake-Sumter MPO, Space Coast TPO,
                and Volusia TPO

                prepared by

                Aviation Analytics

                Cambridge Systematics

July 16, 2012                                        www.camsys.com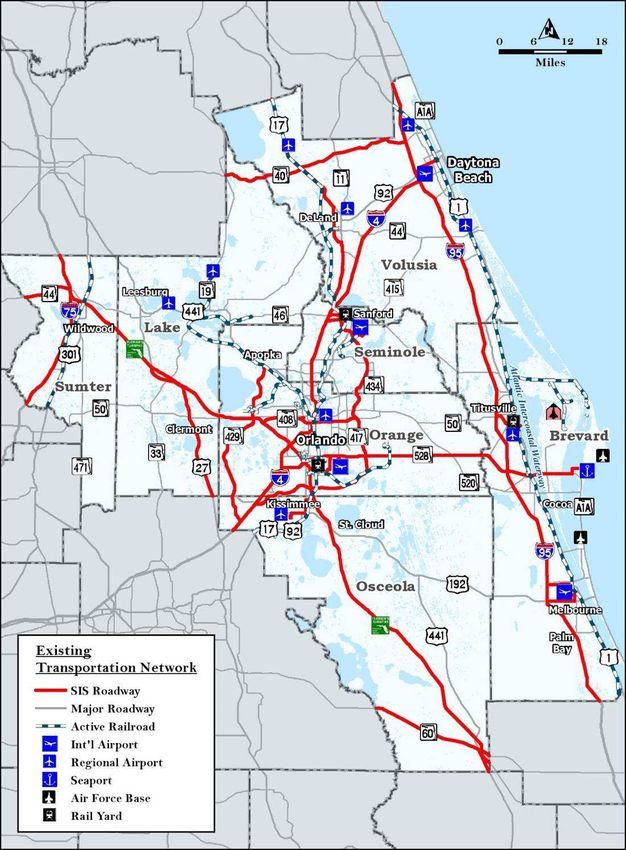
Air Cargo Market Analysis

Central Florida Regional Freight Study

prepared for

MetroPlan Orlando
DOT District 5, Lake-Sumter MPO, Space Coast TPO and Volusia TPO

prepared by

Aviation Analytics

with

Cambridge Systematics

date

March 2013

Air Cargo Market Analysis

Table of Contents
                  1.0    Introduction ............................................................................................................ 1

                  2.0    Air Cargo Profile .................................................................................................... 2
                         2.1 Air Cargo Airports......................................................................................... 2
                         2.2     Air Cargo Service Providers ......................................................................... 4
                                 Integrated Express Carriers .......................................................................... 4
                                 All-Cargo Carriers ......................................................................................... 5
                                 Commercial Service Passenger Carriers ..................................................... 5
                                 Freight Forwarders ........................................................................................ 6
                         2.3     Regional Air Cargo Facilities and Activity ................................................ 8
                                 Air Cargo Facilities ........................................................................................ 8
                                 Air Cargo Activity ......................................................................................... 9
                         2.4     Air Cargo Commodities.............................................................................. 10
                         2.5     Regional Air Cargo Airport Overview ..................................................... 12
                                 Orlando International Airport ................................................................... 12
                                     2.1.1 Access .............................................................................................. 14
                                     2.1.2 Service Levels ................................................................................. 15
                                 Orlando-Sanford International Airport .................................................... 16
                                     2.2.1 Access .............................................................................................. 16
                                  2.2.2 Service Levels ................................................................................. 17
                                 Melbourne International Airport............................................................... 18
                                     Access ....................................................................................................... 18
                                     Service Levels .......................................................................................... 19
                                 Daytona Beach International Airport ....................................................... 20
                                     Access ....................................................................................................... 20
                                     Service Levels .......................................................................................... 21
                         2.6     Challenges..................................................................................................... 22
                                 Capacity and Operational Issues ............................................................... 22

                  3.0    Air Cargo Forecast.................................................................................................. 1
                         3.1 Overview......................................................................................................... 1
                         3.2     Air Cargo Forecast Factors ........................................................................... 1
                         3.3     Volume Forecasts by Airport ....................................................................... 2
                                 Orlando International Airport ..................................................................... 2

Cambridge Systematics, Inc.                                                                                                                          i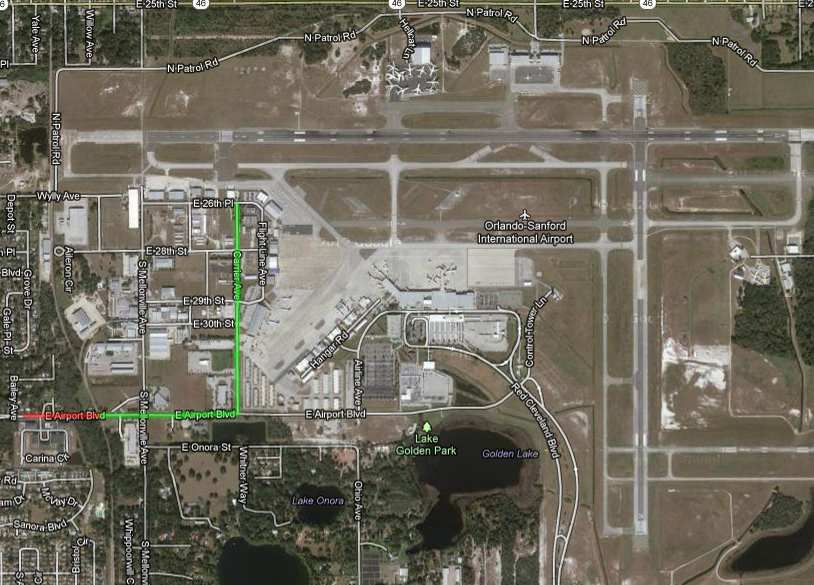
Air Cargo Market Analysis

                               Orlando Sanford International Airport ...................................................... 3
                               Melbourne International Airport................................................................. 4
                               Daytona Beach International Airport ......................................................... 5
                        3.4    Regional Forecast Summary......................................................................... 5
                               Forecast Summary by Market ...................................................................... 6
                               Forecast by Direction..................................................................................... 7
                               Forecast by Commodity ................................................................................ 7

                  4.0   Market Opportunities ............................................................................................ i
                        4.1 Opportunity Overview .................................................................................. i
                        4.2    Introduction of New Markets ....................................................................... i
                        4.3    Increased Belly Space Capacity ................................................................... ii
                        4.4    Reduction of Cargo Leakage ........................................................................ ii
                        4.5    Utilization of GA Airports ........................................................................... iii

ii                                                                                                        Cambridge Systematics, Inc.
Air Cargo Market Analysis

List of Tables
                  Table 2.1      Dedicated Air Cargo Facilities by Airport ............................................... 8
                  Table 2.2      Customs/Foreign Trade Capabilities....................................................... 8
                  Table 2.3      Air Cargo Service Providers by Airport .................................................. 9
                  Table 2.4      2011 Air Cargo Tons by Airport and Market .......................................... 9
                  Table 2.5      2011 Air Cargo Tons by Direction .......................................................... 10
                  Table 2.6      2011 Domestic Air Cargo Tons by Commodity .................................... 10
                  Table 2.7      2011 International Air Cargo Tons by Commodity.............................. 11
                  Table 2.8      2011 MCO Air Cargo Tons by Carrier and Direction .......................... 15
                  Table 2.9      2011 MCO Air Cargo Tons by Carrier Type and Direction ................ 16
                  Table 2.10 2011 SFB Air Cargo Tons by Carrier and Direction ............................. 18
                  Table 2.11 2011 MCO Air Cargo Tons by Carrier and Direction .......................... 20
                  Table 2.12 2011 DAB Air Cargo Tons by Carrier and Direction ........................... 21
                  Table 3.1      Boeing Air Cargo Growth Factors (AAGR)............................................. 2
                  Table 3.2      MCO Forecast Summary by Market (in tons) ......................................... 3
                  Table 3.3      SFB Forecast Summary by Market (in tons) ............................................ 4
                  Table 3.4      MLB Forecast Summary by Market (in tons) .......................................... 4
                  Table 3.5      DAB Forecast Summary by Market (in tons) .......................................... 5
                  Table 3.6      Regional Forecast Summary by Airport (in tons)................................... 6
                  Table 3.7      Regional Air Cargo Market Share by Airport (in tons) ......................... 6
                  Table 3.8      Regional Forecast Summary by Market & Direction (in tons).............. 6
                  Table 3.9      Regional Forecast Summary by Market (in tons) ................................... 7
                  Table 3.10 Regional Forecast by Direction (in tons) .................................................. 7
                  Table 3.11 Domestic Air Cargo Forecast by Commodity (in tons) ......................... 8
                  Table 3.12 International Air Cargo Forecast by Commodity (in tons) ................... 8

Cambridge Systematics, Inc.                                                                                                 iii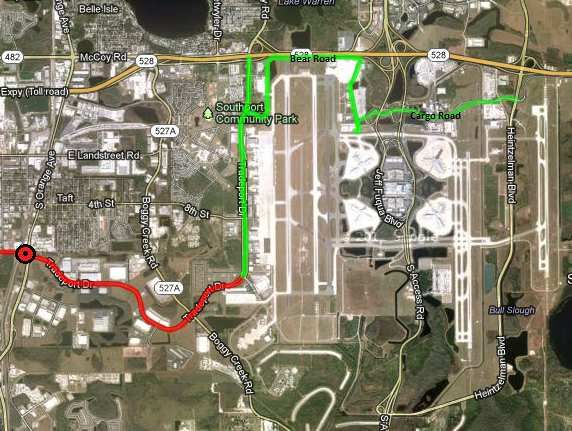
Air Cargo Market Analysis

List of Figures
                  Figure 2.1 Central Florida Freight Study Freight Transportation Network .......... 2
                  Figure 2.2 MCO Air Cargo Facility Location ........................................................... 13
                  Figure 2.3 MCO Air Cargo Access Routes ............................................................... 14
                  Figure 2.4 SFB Air Cargo Access Routes .................................................................. 17
                  Figure 2.5 MLB Air Cargo Access Routes ................................................................ 19
                  Figure 2.6 DAB Air Cargo Access Routes ................................................................ 21

iv                                                                                               Cambridge Systematics, Inc.
Air Cargo Market Analysis

    1.0 Introduction
                  The air cargo element of the Regional Freight and Goods Movement Study will
                  catalogue existing regional air cargo infrastructure, operations, carriers, markets,
                  and shippers in order to form a baseline from which an air cargo activity forecast
                  is conducted. Particular interest is paid to the market split (international versus
                  domestic, and integrated express carrier versus belly freight) in order to identify
                  the differing drivers of future regional air cargo activity. In total, this document
                  will provide an overview of current and projected air cargo activity in the study
                  area through an examination of the following topics:
                  •    Identification of current and potential air cargo airports;

                  •    Overview of air cargo service providers (carriers and forwarders);

                  •    Overview of existing infrastructure, access, and service levels;

                  •    Review of capacity and operational issues;

                  •    Baseline air cargo volume by airport, market, commodity type, and direction;

                  •    Air cargo forecast by airport, market, commodity type, and direction;

                  •    Market opportunity analysis.
                  Information and data for this element of the Study has been pulled from multiple
                  sources, including:
                  •    Interviews and meetings with airport management, air carriers, freight
                       forwarders, and drayage operators;

                  •    Florida Statewide Air Cargo System Plan;

                  •    Orlando International Airport Master Plan;

                  •    FAA Form 5010 airport data;

                  •    Bureau of Transportation Statistics (BTS) T-100 carrier data;

                  •    Boeing World Air Cargo Forecast 2012;

                  •    USA Trade Online, Harmonized System (HS) Port-level Database.

Cambridge Systematics, Inc.                                                                              1
Air Cargo Market Analysis
2.0 Air Cargo Profile
2.1 AIR CARGO AIRPORTS
The Central Florida study area is served by four commercial service airports with
reported air cargo activity, including both dedicated all-cargo carrier operations,
as well as commercial passenger carrier belly cargo. These airports include:
• Orlando International Airport (MCO)
• Orlando-Sanford International Airport (SFB)
• Melbourne International Airport (MLB)
• Daytona Beach International Airport (DAB)
Orlando International is a designated Florida Strategic Intermodal System (SIS)
airport, while Orlando-Sanford International is classified as an Emerging SIS
airport. In total, these four airports provide scheduled service to over 115
domestic and 43 international cities with direct, non-stop flights.
In addition to these four commercial service airports, there are several General
Aviation (GA) airports that serve private and corporate aviation demand within
the region. Unique among these is Leesburg International Airport (LEE), located
approximately one-hour (drive-time) to the northwest of Orlando. Unlike other
typical GA airports, Leesburg International Airport offers U.S. Customs and
Border Protection inspections, with a U.S. Customs Officer on duty daily from
8:30am until 5:00pm. This capability allows LEE to handle both international and
domestic air cargo, should demand warrant it. Currently, the Airport does not
have any air cargo activity, and will not be addressed in detail in the Air Cargo
Profile and Forecast sections of this report (which catalogues current and
forecasted activity in the study area based on existing infrastructure and
operations). However, LEE’s future potential to host air cargo activity will be
addressed in the Market Opportunities section relating to potential regional air
cargo growth.
Figure 2.1 illustrates the Central Florida multimodal freight transportation
network, highlighting commercial service international airport locations, as well
as GA airport, seaport, rail yard, railroad, and highway assets.
Figure 2.1 Central Florida Freight Study Freight Transportation Network
2 Cambridge Systematics, Inc.Air Cargo Market Analysis
Source: FDOT
Cambridge Systematics, Inc. 3Air Cargo Market Analysis
2.2 AIR CARGO SERVICE PROVIDERS
Air cargo services within the study area are provided by a segmented group of
air carriers, both all-cargo and passenger carrier, that provide differing services
based upon wide ranging customer demands. The air carrier types include:
• Integrated express carriers;
• All-cargo carriers (scheduled and ad-hoc charter); and
• Commercial service passenger carriers.
The following sections will provide a brief overview of the air carrier types that
provide the region’s air cargo services, their approximate service levels, and
markets served.
Integrated Express Carriers
Integrated express carriers move customer materials door-to-door, providing
shipment pickup, transport (via air or truck), and delivery. Integrated express
operators within the study area include FedEx, UPS, and DHL, and to a certain
extent U.S. Postal Service (USPS). Express companies provide next day or second
day, document, and small package services to the customers they serve.
Integrated express carriers operate using a hub-and-spoke system similar to the
passenger airline system. The hub is the focal point of the integrated express
carrier network since it provides connections to each market in the integrator’s
system. Each day of operations, flights from around the U.S. arrive at the
carrier’s hub where packages are offloaded, sorted for each destination market,
and then reloaded onto the appropriate aircraft. Traditional integrated express
service focuses on the small-volume, infrequent shipper or higher volume
shippers moving product to multiple destinations. The small shipper “retail” air
cargo market includes individual, private and business-to-consumer (B-to-C)
shippers. However, integrated express carriers are well established in the
“wholesale” market (i.e., third party logistics), catering to larger freight
movements demanded by manufacturing and distribution operations.
All integrated express air movements within the study area are conducted at
MCO, and trucked or couriered to customers in surrounding counties. Each of
the integrated express carriers consolidates express air cargo from the study area,
which effectively constitutes the MCO catchment area for express air cargo. For
FedEx and UPS, this area has been identified as:
• North to Ocala.
• South to Lake Wales.
• East to Melbourne, Cocoa Beach, Daytona Beach.
• West to Lakeland.
4 Cambridge Systematics, Inc.Air Cargo Market Analysis
The DHL Worldwide Express catchment area for MCO is slightly larger due to
fewer aircraft in their network, thus requiring larger catchment areas for each
airport station (i.e., spoke) served. The DHL catchment area for MCO is as
follows:
• Northeast to Jacksonville.
• Southeast to Melbourne/Palm Bay.
• West to Tampa.
• South to Sebring.
All-Cargo Carriers
All-cargo carriers operate both scheduled and ad-hoc (i.e., charter) cargo-only
aircraft from one airport to another, and are highly reliant on the air freight
forwarding industry to market, broker and handle freight off-airport. Due to
their airport-to-airport service structure, scheduled all-cargo carriers are typically
concentrated in large, high volume market airports; unlike the integrated express
carriers, scheduled all-cargo carrier geographic coverage is limited. Note that
some all-cargo carriers that operate scheduled routes do so exclusively for the
integrated express carriers as either feeder routes, or in some cases, as trunk-line
routes (i.e., station-to-hub routes). This is the case with MCO all-cargo carrier
ABX Air, which operates a scheduled B767 to Cincinnati-Northern Kentucky
International Airport, under contract with DHL.
Ad-hoc charter activity consists of unscheduled all-cargo carrier operations that
move goods from airport-to-airport based strictly on shipper needs. Ad-hoc
shipments tend to be oversized freight, specialized or sensitive cargo (i.e.,
military equipment or high value technology), or emergency supply chain
shipments for just-in-time manufacturing operations. Within the study region,
MLB has the highest level of ad-hoc charter operations. These freight movements
include widebody charters (B747, AN225, C-5, and C-17 aircraft) driven by the
Department of Defense, State Department, Dyncorp, and local technology firms
(including GE, Northrop-Grumman, Rockwell Collins, Harris). These flights
averaged a once a month pace in 2011 and are expected to increase to 2 to 3 per
month through 2013.
Commercial Service Passenger Carriers
Commercial service passenger carriers are scheduled passenger airline operators
that use cargo space in the bellies of their aircraft to move cargo airport-to-
airport. An airline’s aircraft fleet is a significant factor in determining the size
and amount of cargo the airline can accommodate. A domestic airline with a fleet
of narrow-body and regional jets cannot accommodate large, bulky shipments.
However, airlines operating wide-body aircraft (typically on international or
transcontinental routes), such as the B747, B777, and A340, have containerized
lower decks (which allow speed in loading and offloading) and generally are
Cambridge Systematics, Inc. 5Air Cargo Market Analysis
capable of handling large, bulky shipments. Simply put, the larger the aircraft on
a route, the greater the capacity to move cargo; thus international routes
operating wide-body aircraft tend to move the majority of commercial passenger
carrier freight.
It is estimated that 50 percent of U.S. international air cargo traffic (inbound and
outbound) is moved in the bellies of passenger aircraft.1 Within the study area,
this percentage rises to over 98 percent due to the high level of international
wide-body capacity provided by passenger carriers out of MCO and SFB.2
Commercial passenger carrier capacity, primarily to European, and increasingly
Latin American destinations, drives the vast majority of the region’s
international air trade. Most scheduled international all-cargo flights operate
from integrated express carrier hubs (e.g., Memphis, Louisville, Cincinnati) or
are centered at large international gateways (e.g., Atlanta, Miami, New York).
Within the U.S. domestic air cargo market – a market dominated by the
integrated express carriers – commercial passenger carriers account for only an
estimated 15 to 20 percent of air cargo volume. Within the study area
this percentage is even lower; domestic air cargo traveling on commercial
passenger carriers equates to just over 11 percent of total domestic air cargo
tonnage within the region, with nearly all of that traffic handled at MCO.
The air cargo market share of commercial passenger carriers, particularly on
domestic routes, has declined significantly in the past decade due to multiple
factors. Chief among these are the security measures and restrictions brought
about by the September 11 terrorist attacks, and the subsequent requirement for
100 percent screening of all passenger carrier air cargo. These security
regulations led to secure shipper certification requirements that effectively
eliminated small and infrequent shippers from the passenger carrier cargo
market, and drove them to the integrated express carriers.
The increasing use of smaller 50- and 70-seat regional jets on longer routes also
served to limit the amount of belly space available on domestic routes, thus
reducing system capacity. The final factor in the decline of domestic passenger
carrier cargo was the awarding of USPS air contracts to FedEx, which effectively
pulled most U.S. mail off passenger carriers. These three factors have combined
to produce a shift of domestic air cargo away from passenger carrier capacity
toward integrated express carriers, and to a certain extent, time definite trucking.
Freight Forwarders
Freight forwarding companies act as brokers, or intermediaries, between the
shipper and the carrier (all-cargo, commercial passenger or ad-hoc charter). The
1 Florida Air Cargo System Plan, 2010, Recent IATA reports.
2 Bureau of Transportation Statistics T-100 data.
6 Cambridge Systematics, Inc.Air Cargo Market Analysis
air carrier will provide airport-to-airport service only, with the carrier’s
responsibility beginning once the cargo is tendered at the origin airport, and
ending once the cargo is offloaded at the destination airport. The forwarder will
coordinate all other aspects of the freight movement, including pickup at the
shipper’s facility, securing space on an aircraft, freight consolidation (if the
forwarder deems it necessary), customs and security clearance, destination
airport pickup, and final delivery to the receiver. From the perspective of the air
carrier, the freight forwarder is the shipper, not the actual owner of the freight
(i.e., the forwarder’s customer).
In addition to using air carriers to move freight from airport-to-airport
(commercial passenger carriers and all-cargo airlines), freight forwarders also
often rely on third-party less-than-truck load (LTL) motor carriers to move
consignment airport-to-airport. This is often referred to as road feeder service
(RFS). RFS from the study area is common to both Atlanta and Miami in order to
take advantage of the abundant capacity available at these gateway airports.
Nearly all major international freight forwarders have a presence in the study
area, with offices and warehouses centered around MCO. These international
forwarders include:
• DHL Global Forwarding.
• Hellman Worldwide.
• Panalpina.
• Kuehne & Nagel.
• DB Shenker.
• Expeditors.
• Ceva Logistics.
• AIT Worldwide Logistics.
The forwarders listed above are supplemented by multiple domestic, regional,
and niche forwarders. Forwarder market areas are defined by individual
customers rather than large population or industrial centers. They tend to view
their market area on a large regional basis versus a specific metro area, and thus
all the air transportation asset in a region are utilized based on cost, availability,
and origin-destination points. In the case of Orlando area forwarders, these air
assets include Atlanta-Hartsfield International Airport and Miami International
Airport. Widebody capacity at these airports is often used by Orlando-based
forwarders, and likewise, Atlanta and Miami freight may be trucked to MCO for
air transit if cost and capacity warrants.
Cambridge Systematics, Inc. 7Air Cargo Market Analysis
2.3 REGIONAL AIR CARGO FACILITIES AND ACTIVITY
The following sections provide an overview of the study area’s four active air
cargo airports, and include summaries of:
• Air cargo facility inventory.
• Air cargo activity synopsis (volume and direction).
• Air cargo commodity summary.
The specific activity at each airport will be discussed in individual airport
profiles presented later in this chapter.
Air Cargo Facilities
As detailed in Table 2.1, the region’s air cargo airports have 24 on-airport
buildings and warehouses dedicated to air cargo operations with over 800,700
square feet of space for sort and consolidation activity. These buildings boast 282
truck docks that facilitate the efficient pickup and delivery of air cargo. Adjacent
to these buildings, is over 316,500 square yards of dedicated air cargo ramp
space. With the recent shutdown and conversion of MCO’s perishable center
(refrigerated facility) to a warehouse, only SFB has perishable storage
capabilities.
Table 2.1 Dedicated Air Cargo Facilities by Airport
Air Cargo Air Cargo Air Cargo Refrigerated
Ramp ((Sq. Air Cargo Building Building Truck Storage
Airport Yards) Buildings (Sq. Feet) Docks (Sq. Feet)
Orlando International 237,450 20 630,440 253 -
Orlando-Sanford International 34,580 1 45,000 9 6,000
Melbourne International 44,500 2 120,000 19 -
Daytona Beach International - 1 5,300 1 -
Total 316,530 24 800,740 282 6,000
Source: Airport Provided Data, Florida Air Cargo System Plan.
Table 2.2 presents the U.S. Customs and USDA clearance services available at
each airport. All airports have onsite customs capabilities and Foreign Trade
Zones, while only MCO has onsite USDA inspection capabilities.
Table 2.2 Customs/Foreign Trade Capabilities
Foreign Trade Onsite U.S.
Airport Zone Customs Onsite USDA
Orlando International Yes Yes Yes
Orlando-Sanford International Yes Yes No
8 Cambridge Systematics, Inc.Air Cargo Market Analysis
Melbourne International Yes Yes No
Daytona Beach International Yes Yes No
Source: Airport Provided Data, Florida Air Cargo System Plan.
The air cargo service providers by type for each airport are presented in
Table 2.3. Only MCO offers air cargo capacity from each distinct type of carrier;
integrated express, all-cargo, ad-hoc/charter, domestic, and international
passenger carriers.
Table 2.3 Air Cargo Service Providers by Airport
Integrated Scheduled Charter All Domestic International
Airport Express All Cargo Cargo Passenger Passenger
Orlando International Yes Yes* Yes Yes Yes
Orlando-Sanford International No No No Yes Yes
Melbourne International No No Yes Yes No
Daytona Beach International No No No Yes No
Source: Airport Provided Data, BTS T-100 Data.
Note: *Scheduled all-cargo carriers operate contract routes for integrated express carriers.
Air Cargo Activity
Table 2.4 and Table 2.5 presents the 2011 air cargo tonnage by market (domestic
versus international) and direction (outbound versus inbound). As expected,
MCO air cargo volume constitutes the vast majority of tonnage moved at the
region’s airports. This is due to the operation of all three integrated express
operators at the Airport, coupled with the large amount of international
widebody capacity.
Table 2.4 2011 Air Cargo Tons by Airport and Market
Airport Domestic International Total Percent of Total
Orlando International 142,839 44,228 187,067 98.1%
Orlando-Sanford International - 3,022 3,022 1.6%
Melbourne International 99 430 529 0.3%
Daytona Beach International 108 - 109 0.1%
Total 143,046 47,680 190,726 100%
Percent of Total 75.0% 25.0% 100%
Source: Airport Provided Data, BTS T-100 Data.
As illustrated in Table 2.5, the study area, in total, is an inbound (or import)
market. Just over 57 percent of total air cargo traffic is inbound.
Cambridge Systematics, Inc. 9Air Cargo Market Analysis
Table 2.5 2011 Air Cargo Tons by Direction
Airport Outbound Inbound Total Percent of Total
Orlando International 79,512 107,555 187,067 98.1%
Orlando-Sanford International 1,319 1,703 3,022 1.6%
Melbourne International 303 226 529 0.3%
Daytona Beach International 59 49 108 0.1%
Total 81,193 109,534 190,727 100%
Percent of Total 42.6% 57.4% 100%
Source: Airport Provided Data, BTS T-100 Data.
2.4 AIR CARGO COMMODITIES
The following tables present the commodity types moved in and out of the study
area by market (domestic versus international). Table 2.6 details 2011 domestic
air cargo tonnage by commodity using STCC2 codes. Due to the heavy level of
domestic integrated express carrier traffic, it is not surprising that mail and
express traffic accounts for over 54 percent of total domestic air volume.
Table 2.6 2011 Domestic Air Cargo Tons by Commodity
Percent of
STCC2 Commodity Tons Total
43 Mail, Express or Other Contract Traffic 77,574 54.2%
46 Miscellaneous Mixed Shipments 16,385 11.5%
28 Chemicals or Allied Products 14,950 10.5%
35 Machinery, excluding Electrical 8,160 5.7%
37 Transportation Equipment 5,943 4.2%
36 Elec Machinery, Equip, Supplies 4,997 3.5%
27 Printed Matter 2,764 1.9%
1 Farm Products 2,494 1.7%
39 Misc Products of Manufacturing 2,206 1.5%
34 Fabricated Metal Products 2,071 1.4%
20 Food and Kindred Products 1,170 0.8%
26 Pulp, Paper or Allied Products 987 0.7%
32 Clay, Concrete, Glass, Stone Prod 869 0.6%
38 Instruments, Photo/Opt Goods, Etc 747 0.5%
23 Apparel or Fin Textile Products 696 0.5%
30 Rubber or Misc Rubber Prods 363 0.3%
9 Fresh Fish 307 0.2%
33 Primary Metal Products 160 0.1%
10 Cambridge Systematics, Inc.Air Cargo Market Analysis
25 Furniture or Fixtures 67 >0.1%
22 Textile Mill Products 61 >0.1%
24 Lumber or Wood Products 48 >0.1%
31 Leather or Leather Products 15 >0.1%
29 Petroleum or Coal Products 11 >0.1%
Total 143,046 100%
Source: TRANSEARCH, Cambridge Systematics.
International air cargo tonnage by commodity and direction is presented in
Table 2.7. This data was pulled from USA Trade Online, Harmonized System
(HS) Port-level Database provided by the U.S. Census Bureau, and presented in
NAICS codes (North American Industry Classification System). The top-five
international air trade commodities transiting the region’s airports (machinery,
fish, optic/medical instruments, vegetables, and electronics) account for nearly
52 percent of the total.
The total value of air imports into the region for 2011 is estimated to be $932.0
billion, while air exports are estimated at $833.2 billion. This equates to an
average value of $32,707 per import ton, and $43,437 per export ton. Additional
detail is included in the Current Year Commodity Flow Profile report. This
report identifies regional commodity flows for all freight modes, including air
cargo.
Table 2.7 2011 International Air Cargo Tons by Commodity
Percent of
NAICS Commodity Import Export Total Total
84 Machinery, Nuclear Reactors, Boilers, Etc.; Parts 7,037 3,517 10,554 22.1%
03 Fish, Crustaceans and Aquatic Invertebrates 4,154 111 4,265 8.9%
90 Optic, Photo Etc, Medic Or Surgical Instrments Etc 1,872 1,819 3,691 7.7%
07 Edible Vegetables and Certain Roots and Tubers 2,647 835 3,482 7.3%
85 Electric Machinery Etc; Sound Equip; Tv Equip 1,458 1,206 2,663 5.6%
04 Edible Animal Prods, Dairy Prods Nesoi 1 2,185 2,185 4.6%
87 Vehicles, Except Railway Or Tramway, and Parts 1,444 681 2,125 4.5%
06 Live Trees, Plants, Bulbs Etc.; Cut Flowers Etc. 57 1,924 1,981 4.2%
30 Pharmaceutical Products 1,185 509 1,694 3.6%
39 Plastics and Articles Thereof 620 806 1,427 3.0%
38 Miscellaneous Chemical Products 446 603 1,050 2.2%
73 Articles Of Iron Or Steel 512 444 956 2.0%
98 Special Classification Provisions, Nesoi 834 5 838 1.8%
27 Mineral Fuel; Bitumin Subst; Mineral Wax 447 198 645 1.4%
40 Rubber and Articles Thereof 489 126 614 1.3%
Cambridge Systematics, Inc. 11Air Cargo Market Analysis
Percent of
NAICS Commodity Import Export Total Total
29 Organic Chemicals 218 356 574 1.2%
33 Essential Oils Etc; Perfumery, Cosmetic Etc Preps 254 318 572 1.2%
94 Furniture; Bedding Etc; Lamps Nesoi Etc; 366 86 452 0.9%
62 Apparel Articles and Accessories, Not Knit Etc. 422 23 445 0.9%
49 Printed Books, Newspapers Etc; Manuscripts Etc 170 202 372 0.8%
69 Ceramic Products 306 62 368 0.8%
01 Live Animals 300 29 329 0.7%
83 Miscellaneous Articles Of Base Metal 175 145 319 0.7%
61 Apparel Articles and Accessories, Knit Or Crochet 183 131 314 0.7%
36 Explosives; Pyrotechnics; Matches; Pyro Alloys 297 5 303 0.6%
All Others 2,604 2,857 5,461 11.5%
Total 28,497 19,183 47,680 100.0%
Percent of Total 59.8% 40.2% 100.0%
Source: USA Trade Online, Harmonized System (HS) Port-level Database; Airport Analytics.
2.5 REGIONAL AIR CARGO AIRPORT OVERVIEW
The following sections provide a more detailed overview of the current air cargo
facilities, access, and service levels of each of the four commercial service airports
in the study area.
Orlando International Airport
There are four separate areas on the Airport which accommodate air cargo
activity. These areas are: the passenger airline cargo facility located off Cargo
Road and Bear Road on the north side of the Airport, the two areas on the west
side of Runway 36L along Tradeport Drive (which include UPS and DHL), and
the FedEx and USPS facilities located on the west side of the end of Runway 36L
on the south portion of Tradeport Drive. These areas along Tradeport Drive
constitute the Orlando Tradeport. Figure 2.2 illustrates the location of each of
these facilities.
12 Cambridge Systematics, Inc.Air Cargo Market Analysis
Figure 2.2 MCO Air Cargo Facility Location
Source: GOAA, Ricondo & Associates, Inc.
Orlando Tradeport, a 1,400 acre fully integrated cargo center located on Airport
property, is a master planned facility with design criteria geared toward
intermodal transportation capacity and direct airside access. The Tradeport
provides 140 acres of cargo ramp that can be accessed directly by truck (through-
the-fence access), or via truck dock through air cargo sort/staging facilities.
There is currently over 500,000 square feet of cargo warehouse space, with
aircraft parking available for up to 27 all-cargo wide body aircraft parked in two
rows. Additionally, Orlando Tradeport offers a 205-acre Foreign Trade Zone #42.
In total, the Airport has 14 cargo buildings with 253 truck docks, providing
access to 630,440 square feet of building space and 237,450 square yards of
dedicated air cargo ramp.
Cambridge Systematics, Inc. 13Air Cargo Market Analysis
2.1.1 Access
MCO is surrounded by SR 528 to the north, which connects to the Florida
Turnpike to the west and SR 417 to the east and south of the Airport. There are
several roadways providing access to the Airport’s air cargo areas from these
thoroughfares. Tradeport Drive is a north–south four lane road, on the western
most edge of Airport property that provides access to FedEx, UPS, DHL, and
several commercial passenger carrier cargo facilities. Jeff Fuqua Boulevard is the
main loop road to the passenger terminals, and connects to SR 436 at the junction
of the SR 528. Bear Road connects Jeff Fuqua Boulevard with Tradeport Drive
and parallels SR 528. As illustrated in Figure 2.3, Tradeport Drive, Cargo Road,
and Bear Road provide the primary access to MCO’s air cargo facilities.
Figure 2.3 MCO Air Cargo Access Routes
Source: Florida Air Cargo System Plan, FDOT, Cambridge Systematics.
Air carriers and freight forwarders that were consulted with as a part of this
Study typically rated access to MCO cargo facilities as very good to excellent,
particularly when compared to their experience with congestion at Miami
International and Atlanta-Hartsfield International. Primary issues arise once
drivers leave the immediate Airport environs, and these include:
• Westbound access to I-4 via Tradeport Drive and Taft Vineland Road: Taft
Vineland narrows from a four lane thoroughfare to a two lane roadway. In
addition, an at grade railroad crossing can hinder traffic flow.
14 Cambridge Systematics, Inc.Air Cargo Market Analysis
• SR 528 toll booth near the junction of SR 436 contributes to traffic congestion
at peak times. However, this toll booth is scheduled to be demolished in 2014.
• SR 417 does not have an interchange with the Florida Turnpike. An
interchange at this location is currently in the design phase.
2.1.2 Service Levels
In 2011, 27 separate airlines, providing direct service to 84 domestic destinations
and 34 international destinations, reported air cargo activity at MCO. Table 2.8
details the airline, airline type, and tonnage by direction with a summary by
airline type in Table 2.9.
Table 2.8 2011 MCO Air Cargo Tons by Carrier and Direction
Percent
Airline Airline Type Outbound Inbound Total of Total
FedEx All-Cargo Scheduled 29,574 36,590 66,164 35.4%
United Parcel Service All-Cargo Scheduled 14,880 25,517 40,397 21.6%
Virgin Atlantic International Passenger 6,997 12,580 19,577 10.5%
ABX Air (DHL) All-Cargo Scheduled 7,855 7,988 15,843 8.5%
TAM Brazilian Airlines International Passenger 4,268 5,060 9,328 5.0%
British Airways International Passenger 3,350 3,381 6,731 3.6%
Southwest Airlines Domestic Passenger 3,016 3,108 6,124 3.3%
Lufthansa Airlines International Passenger 1,592 3,024 4,616 2.5%
Delta Air Lines Domestic Passenger 1,761 2,577 4,338 2.3%
ASTAR (DHL) All-Cargo Scheduled/Charter 2,280 399 2,679 1.4%
Air France International Passenger 696 1,353 2,049 1.1%
Continental Airlines Domestic Passenger 508 1,470 1,978 1.1%
Aer Lingus International Passenger 545 1,237 1,782 1.0%
Air Transport International All-Cargo Charter 530 1,031 1,561 0.8%
U.S. Airways Domestic Passenger 363 569 932 0.5%
Mountain Air (FedEx) All-Cargo Schedule 359 319 678 0.4%
JetBlue Airways Domestic Passenger 166 366 532 0.3%
Evergreen International All-Cargo Charter 187 279 466 0.2%
Frontier Airlines Domestic Passenger 273 77 350 0.2%
United Airlines Domestic Passenger 47 181 228 0.1%
Alaska Airlines Domestic Passenger 45 158 203 0.1%
Air Canada International Passenger 115 30 145 0.1%
Sun Country Airlines Domestic Passenger 16 101 117 0.1%
National Air Cargo All-Cargo Charter 4 88 92 >0.1%
Cambridge Systematics, Inc. 15Air Cargo Market Analysis
Percent
Airline Airline Type Outbound Inbound Total of Total
Capital Cargo International All-Cargo Charter 62 29 91 >0.1%
American Airlines Domestic Passenger 5 35 40 >0.1%
Martinair Holland All-Cargo Charter 18 8 26 >0.1%
Total 79,512 107,555 187,067 100%
Source: Greater Orlando Aviation Authority, Airport Analytics
Table 2.9 2011 MCO Air Cargo Tons by Carrier Type and Direction
Percent of
Airline Type Outbound Inbound Total Total
All-Cargo Scheduled 54,948 70,813 125,761 67.2%
International Passenger 17,563 26,665 44,228 23.6%
Domestic Passenger 6,200 8,642 14,842 7.9%
All-Cargo Charter 801 1,435 2,236 1.2%
Total 79,512 107,555 187,067 100%
Source: Greater Orlando Aviation Authority, Airport Analytics
Orlando-Sanford International Airport
SFB has one dedicated 45,000 square foot air cargo building with nine truck
docks; it is 60 percent occupied. Within the air cargo building is a 6,000 square
foot refrigeration unit for the handling of perishables; it is the only permanent
on-airport perishable facility in the study region. The building can be expanded
by an additional 20,000 square feet, should demand warrant. There are 34,500
square yards of combined dedicated air cargo and multi-use ramp space that can
be used for air cargo operations. The Airport operates the cargo facility and
handles all cargo as a service for the carriers; the cargo facility does not make
money for the Airport.
2.2.1 Access
16 Cambridge Systematics, Inc.Air Cargo Market Analysis
The cargo facility is located on Carrier Avenue and is accessed primarily from
East Jeff Fuqua Boulevard, and does not interfere with any passenger terminal
vehicular traffic. Officials at SFB are satisfied with the current road configuration
and access to the cargo facility; they did not identify any current areas of
concern. As illustrated in Figure 2.4, East Jeff Fuqua Boulevard connects with
SR417 to the west.
Figure 2.4 SFB Air Cargo Access Routes
Source: Florida Air Cargo System Plan, FDOT, Cambridge Systematics.
Note: No access issues were identified in the Florida Air Cargo System Plan at this location
2.2.2 Service Levels
All cargo activity at SFB is handled by the international passenger carriers that
operate at the Airport. These carriers are charter operations and operate on a
seasonal basis, thus cargo volume is cyclical, mirroring passenger flows.
Seasonal peaks start in early July, and extend through October; there is limited
international traffic December through April. Marketability of cargo service
suffers due to peaks and ebbs of passenger service; the schedule inconsistency of
widebody flights makes it difficult for forwarders to plan regular moves from the
Airport.
Table 2.10 details the airline, airline type, and tonnage by direction. Note that all
traffic in 2011 was international traffic with over 99 percent of the Airport’s air
trade to-and-from Europe, and USA Jet providing ad-hoc service to Canadian
destinations.
Cambridge Systematics, Inc. 17Air Cargo Market Analysis
Table 2.10 2011 SFB Air Cargo Tons by Carrier and Direction
Percent of
Airline Airline Type Outbound Inbound Total Total
Britannia Airways Passenger Charter 512 1,169 1,681 51.4%
Thomas Cook Airlines Passenger Charter 757 496 1,252 45.5%
Icelandair Passenger Charter 51 21 71 2.7%
USA Jet Airlines All-Cargo Charter 18 18 0.4%
Total 1,319 1,703 3,022 100%
Source: Orlando-Sanford International Airport, BTS T-100 Data, Airport Analytics
Melbourne International Airport
There are two air cargo buildings at MLB totaling 120,000 square feet. The
smaller of the two is approximately 15,000 square feet with seven truck-docks
and is located on the air cargo ramp east of the passenger terminal. Delta Airlines
is the primary tenant of this building. The larger of the two is approximately
105,000 square-feet with 12 truck-docks and is also located to the northeast of the
passenger terminal. This building does not sit directly on the air cargo ramp; it is
connected to airside via an access road. MLB’s air cargo ramp is 44,500 square
yards and is located to the east of the terminal, south of the approach end of
Runway 27L.
Liberty Aerospace, Inc. (U.S. subsidiary of the European manufacturer of the
Liberty XL2 general aviation aircraft) leases approximately one third of MLB’s
larger air cargo building for its North American headquarters. The building is
also home to several trucking companies and a freight forwarder.
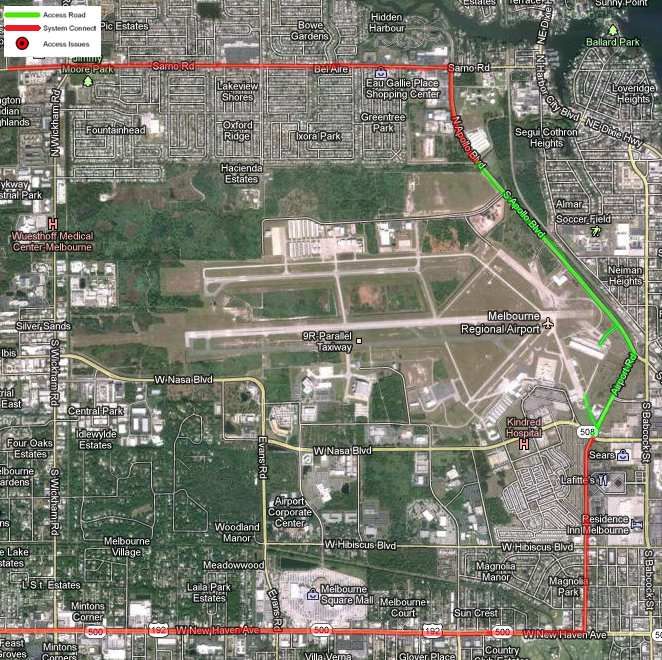
Access
The smaller air cargo building is located on Ed Foster Road accessed via Airport
Boulevard. The larger air cargo building is located on Air Cargo Place and is
accessed via Apollo Boulevard. Trucks arriving and departing to the south will
co-mingle with passenger traffic on Airport Boulevard until they reach NASA
Boulevard where passenger traffic will turn east to the Airport terminal entrance.
However, truck traffic is not considered heavy enough to cause congestion
issues. Traffic arriving and departing to the north will use Apollo Boulevard.
Airport management pointed out that much of the truck traffic to and from the
Airport is not air cargo related, but driven by the businesses operating on the
Airport. I-95 is approximately 5-miles to the west of the airport and is accessed
by U.S. 192 to the south, or Sarno Road to the north. Figure 2.5 illustrates the
primary access to MLB’s air cargo facilities.
18 Cambridge Systematics, Inc.Air Cargo Market Analysis
Figure 2.5 MLB Air Cargo Access Routes
Source: Florida Air Cargo System Plan, FDOT, Cambridge Systematics.
Note: No access issues were identified in the Florida Air Cargo System Plan at this location
Service Levels
MLB has limited scheduled cargo capacity (passenger carrier or all-cargo). Delta
operates an MD-80 narrowbody to Atlanta, and U.S. Airways operates regional
jets to Charlotte. Both aircraft types have limited belly capacity. There is,
however, a considerable amount of widebody ad-hoc charter activity (B747,
AN225, C-5, and C-17 aircraft) driven by DoD, State Department, and local
technology firms (including GE, Northrop-Grumman, Rockwell Collins, Harris).
B747 activity averages one flight every 2 months, but is ramping up to 2 per
month, while an AN225 (a Russian built and operated widebody cargo aircraft)
is operating at the Airport once every 2 months. Private cargo on Military aircraft
will occasionally use MLB versus nearby Patrick AFB due to operating
efficiencies at the Airport.
Cambridge Systematics, Inc. 19Air Cargo Market Analysis
Table 2.11 details the airline, airline type, and tonnage by direction. Note that
over 81 percent of MLB cargo is international due to all-cargo charter activity.
Table 2.11 2011 MCO Air Cargo Tons by Carrier and Direction
Percent of
Airline Airline Type Outbound Inbound Total Total
Delta Airlines Domestic Passenger 61 29 90 17.0%
U.S. Airways Domestic Passenger 0.1 9 9 1.7%
Kalitta Air All-Cargo Charter 148 188 336 63.5%
Antonov Company All-Cargo Charter 94 - 94 17.8%
Total 303 226 529 100%
Source: Melbourne International Airport, BTS T-100 Data, Airport Analytics
Daytona Beach International Airport
DAB has a 5,300 square foot cargo building, of which Delta currently occupies
2,300 square feet. The Airport does not have any dedicated ramp space for cargo
operations, but there is multi-use ramp space available for ad-hoc cargo
operations if needed.
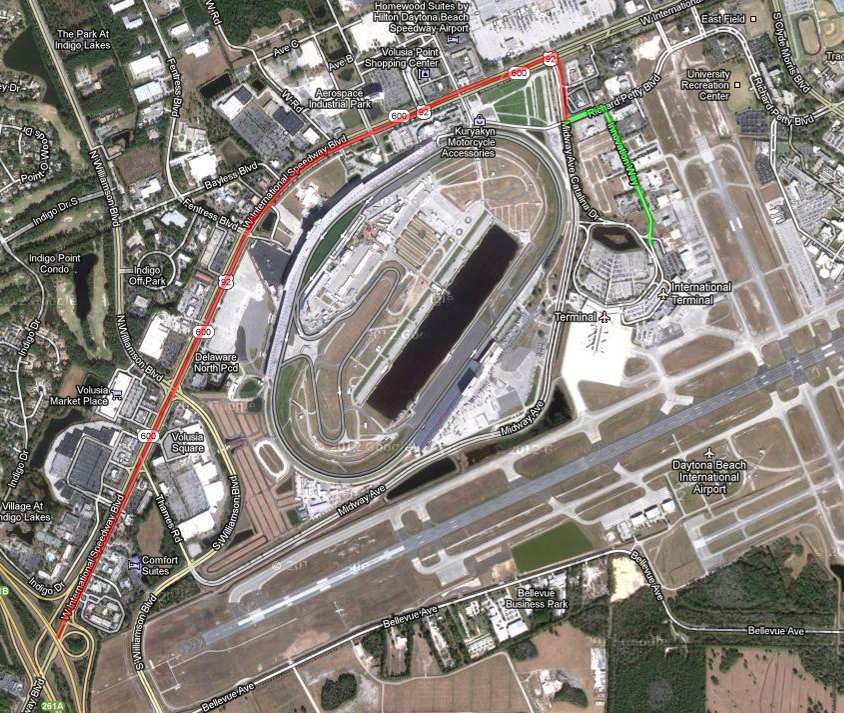
Access
The DAB cargo facility is accessed from Richard Petty Boulevard to Coral Sea
Avenue, and maintains a separate route from passenger traffic. As illustrated in
Figure 2.6, I-95 is located just to the west of the Airport and is connected via U.S.
92.
20 Cambridge Systematics, Inc.Air Cargo Market Analysis
Figure 2.6 DAB Air Cargo Access Routes
Source: Florida Air Cargo System Plan, FDOT, Cambridge Systematics.
Note: No access issues were identified in the Florida Air Cargo System Plan at this location
Service Levels
As detailed in Table 2.12, Delta Airlines moves over 95 percent of the Airport’s
air cargo, with U.S. Airways accounting for the rest. There is no reported all-
cargo charter activity.
Table 2.12 2011 DAB Air Cargo Tons by Carrier and Direction
Percent of
Airline Airline Type Outbound Inbound Total Total
Delta Airlines Domestic Passenger 58 45 103 95.20%
U.S. Airways Domestic Passenger 1 4.2 5 4.80%
Total 59 49 108 100%
Source: Daytona Beach International Airport, BTS T-100 Data, Airport Analytics
Cambridge Systematics, Inc. 21Air Cargo Market Analysis
2.6 CHALLENGES
Air cargo demand in the region is adequately met by current infrastructure and
capacity. Access to the airports is reported to be very good to excellent,
particularly when compared to competing gateway airports, Atlanta-Hartsfield
International and Miami International.
Capacity and Operational Issues
• Both MCO and SFB freight forwarders, as well as airport officials, report
excellent working relationships and responsiveness of the U.S. Customs
service. While direct service to Europe via MCO and SFB commercial
passenger carriers drives the region’s international traffic, capacity to Latin
American markets is minimal (though growing), and direct Asia/Pacific Rim
traffic is currently non-existent. MCO is currently targeting Asian and
Middle-Eastern markets for direct service, and is directly marketing to
several carriers, including: China Air, ANA, Japan Airlines, China Eastern,
Cathay Pacific, Air China, Qatar Airways, and Emirates.
• Freight Forwarder traffic originating or destined for the study area often
transit Atlanta-Hartsfield International and Miami International Airport
versus the region’s airports due to several factors, including:
– Greater range of destinations, frequency, and capacity at the competing
airports;
– Block space arrangements with carriers (i.e., guaranteed pre-purchased
space on aircraft);
– Greater concentration of support services; and
– Less seasonality/fluctuations of widebody capacity.
Despite the use of alternate gateways for study area air cargo, MCO forwarders
and cargo handlers report that the Airport’s available capacity is well utilized.
SFB reports that their capacity is underutilized, primarily due to the seasonal
nature of their operations. The primary themes encountered during consultation
with the regions’ airports, air cargo carriers, and forwarders include:
• I-4 congestion near tourist attractions and north to SFB.
• Westbound egress from Tradeport Drive constricts to two-lanes at Taft
Vineland Road prior to reaching the Florida Turnpike. Note that Orange
County has a current capital project for widening Taft-Vineland Road
between Orange Avenue and Orange Blossom Trail. The project is 95 percent
22 Cambridge Systematics, Inc.Air Cargo Market Analysis
designed and funded for right-of-way acquisition over the next five fiscal
years. Construction is estimated to be completed in 2020/2021.
• The TSA is discussing possible restriction of through the fence operations at
MCO (i.e., disallowing direct truck access to the aircraft ramp). This would
impact UPS operations and would mean a full unload, tug to cargo building,
and through the building reload of cargo onto drayage and courier trucks. A
full redesign/rebuild of the cargo building would be required, and cost time
and operational efficiency.
• New shipping and import/export regulations are increasingly burdensome
to freight forwarders and are hampering the efficiency of their operations.
• Security regulations and secure shipper requirements are driving smaller and
infrequent shippers from commercial passenger carriers to the integrated
express carriers.
• Outbound capacity to Latin American destinations (particularly Brazil) is
limited; tourists returning to Latin America purchase significant amounts of
consumer goods in Orlando that occupies much of the belly space on return
flights.
• Seasonality of widebody flights3, coinciding with tourist traffic, affects the
ability to market air cargo capacity, particularly out of SFB.
3 This relates to heavier traffic during the summer months, largely related to charter
services, and without those services, air traffic can drop off dramatically.
Cambridge Systematics, Inc. 23Air Cargo Market Analysis
3.0 Air Cargo Forecast
3.1 OVERVIEW
The primary objective of the air cargo volume forecast effort is to define the
magnitude of change that can be expected over this Study’s forecast period (2011
through 2040). Because of the cyclical nature of the economy, fuel price volatility,
and modal shifts, it is virtually impossible to predict with certainty year-to-year
fluctuations in activity when looking 30 years into the future. However, a trend
can be established that characterizes long-term growth potential based on macro-
level economic, population, and industry development trends. While a single
line is often used to express the anticipated growth, it is important to remember
that actual growth may fluctuate above and below this line. Forecasts serve only
as guidelines and planning must remain flexible to respond to unforeseen air
cargo demands within the region. It should also be noted that the air cargo
industry is in continuous change and evolution. For example, an air cargo
industry merger, proposed security regulations, or new carrier entrants to the
market during the planning period could have substantial volume and
operations implications in any given market area that could not be reasonably
predicted or reflected in a forecast exercise.
An individual forecast for each of the four commercial service airports within the
study is presented. Each forecast is conducted independently in order to account
for the differing levels of service, markets served, and carrier types at each
airport. The individual airport forecasts are then merged to present an aggregate
study region forecast for total air cargo volume.
3.2 AIR CARGO FORECAST FACTORS
Three separate air cargo growth forecasts were examined as the potential basis
for providing the individual airport forecasts. These forecasts, which provide
average annual growth rates (AAGR) for air cargo development over the forecast
period, consist of the following:
• Boeing World Air Cargo Forecast, 2012/2013
• FAA Aerospace Forecasts, Fiscal Years 2012-2032
• Airbus Global Market Forecast, 2012
Each of these forecasts identifies major air cargo trends for both domestic and
international markets, and present similar annual average growth rates over the
forecast period. However, of the three, the Boeing air cargo forecast is the most
Cambridge Systematics, Inc. 1Air Cargo Market Analysis
detailed in terms of market analysis and breakdown by world region and
market. For this reason, the Boeing forecast factors are used in this Study’s
projections of air cargo activity.
Data for the Boeing World Air Cargo Forecast is compiled from multiple sources,
including the Air Cargo Management Group, the Air Transport Association
(ATA), the Association of Asia-Pacific Airlines, (AAPA), the Association of
European Airlines (AEA), Boeing Foreign Trade Database (TRADE), Global
Insight, the International Air Transport Association (IATA), International Civil
Aviation Organization (ICAO), and U.S. Department of Transportation (DOT).
Table 3.1 details the air cargo volume growth rate for each world region as
presented in the Boeing World Air Cargo Forecast.
Table 3.1 Boeing Air Cargo Growth Factors (AAGR)
Outbound/ Inbound/
Market Pair
Export Import
Domestic/North America 2.2% 2.2%
US-Europe 3.3% 3.6%
US-Latin America 6.0% 5.6%
US-Asia 6.0% 5.7%
Source: Boeing World Air Cargo Forecast, 2012
3.3 VOLUME FORECASTS BY AIRPORT
The following sub-sections provide the 2011 through 2040 air cargo forecasts for
each of the commercial service airports within the study area. The market
specific AAGR (i.e., world region AAGR) provided by the Boeing World Air
Cargo Forecast is applied to the 2011 baseline air cargo at each airport, and is
projected forward to 2040.
Orlando International Airport
The 2011 through 2040 air cargo forecast for Orlando International Airport is
presented in Table 3.2. The air cargo volume forecast for MCO accounts for the
following Airport air cargo operations assumptions through the forecast period:
• MCO will continue to operate as the primary integrated express carrier airport
for the study area through the end of the planning period (FedEx, UPS, DHL).
• Number of integrated express cargo carriers will remain constant.
• MCO international traffic will continue to move exclusively via commercial
passenger belly-space.
• No new international markets will be added during forecast period; existing
markets will remain constant.
• Projections are unconstrained; airport infrastructure and services will remain
sufficient to meet demand.
2 Cambridge Systematics, Inc.Air Cargo Market Analysis
• Leakage levels to ATL and MIA will remain constant.
Table 3.2 MCO Forecast Summary by Market (in tons)
2011 2011 2011 2040 2040 2040 Growth
Cargo Market
Outbound Inbound Total Outbound Inbound Total 2011-2040
Domestic 61,949 80,890 142,839 116,442 152,045 268,487 88.0%
US-Europe 13,180 21,575 34,755 33,793 60,171 93,963 170%
US-Latin America 4,268 5,060 9,328 23,126 24,570 47,696 411.3%
US-Canada 115 30 145 216 56 273 88.0%
Total 79,512 107,555 187,067 173,577 236,841 410,418 119.4%
Source: Airport Records, BTS T-100 Data, Boeing World Air Cargo Forecast 2012, Airport Analytics
Air cargo volume at MCO is expected to grow 119 percent by the end of the
forecast period, with an Average Annual Growth Rate (AAGR) of 2.7 percent.
The inbound and outbound split is expected to remain constant with 2011 levels
of 42.5 percent of traffic outbound, and 57.5 percent of traffic inbound. As
expected, Latin America markets are projected to see the strongest volume gains
relative to their 2011 total.
Note that a separate air cargo forecast was conducted for the Orlando
International Airport Master Plan in 2012. The result of the 20-year master plan
forecast was compared to this Study’s forecast and it was found that both efforts
achieved similar results. The total tonnage projections provided in this Study for
MCO are 3.1 percent higher than those provided in the master plan.
Orlando Sanford International Airport
The 2011 through 2040 air cargo forecast for Orlando Sanford International
Airport is presented in Table 3.3. The air cargo volume forecast for SFB accounts
for the following air cargo operations assumptions through the forecast period:
• SFB will continue to operate as an international gateway for European air
cargo arriving via charter passenger aircraft.
• SFB-Latin America air cargo traffic will commence in 2013 and grow through
the forecast period due to the introduction of direct SFB-Sao Paulo, Brazil
flights in 2012.
• SFB will see limited domestic volume due to a lack of integrated express
carrier activity. SFB’s single domestic charter carrier, Allegiant, does not
offer air cargo service/capacity on its aircraft.
• No new international markets will be added during forecast period; existing
markets will remain constant.
• Projections are unconstrained; airport infrastructure and services will remain
sufficient to meet demand.
• Leakage levels to ATL and MIA will remain constant.
Cambridge Systematics, Inc. 3You can also read