Building a better market - Making the housebuilding market work for consumers Salima Ali - Social Market Foundation
←
→
Page content transcription
If your browser does not render page correctly, please read the page content below
Building a better market
Making the housebuilding market work for consumers

Salima Ali
SOCIAL MARKET FOUNDATION

FIRST PUBLISHED BY
The Social Market Foundation, March 2019
11 Tufton Street, London SW1P 3QB
Copyright © The Social Market Foundation, 2019
ISBN: 978-1-910683-58-3

The moral right of the author(s) has been asserted. All rights reserved. Without limiting the rights
under copyright reserved above, no part of this publication may be reproduced, stored or
introduced into a retrieval system, or transmitted, in any form or by any means (electronic,
mechanical, photocopying, recording, or otherwise), without the prior written permission of both
the copyright owner and the publisher of this book.

THE SOCIAL MARKET FOUNDATION
The Foundation’s main activity is to commission and publish original papers by
independent academic and other experts on key topics in the economic and social fields, with a
view to stimulating public discussion on the performance of markets and the social framework
within which they operate. The Foundation is a registered charity and a company limited by
guarantee. It is independent of any political party or group and is funded predominantly through
sponsorship of research and public policy debates. The views expressed in this publication are
those of the author, and these do not necessarily reflect the views of the sponsors or the Social
Market Foundation.

CHAIR                                              DIRECTOR
Mary Ann Sieghart                                  James Kirkup

TRUSTEES
Baroness Grender MBE
Nicola Horlick
Tom Ebbutt
Rt Hon Nicky Morgan MP
Rt Hon Dame Margaret Hodge MP
Peter Readman
Melville Rodrigues
Trevor Phillips OBE
Professor Tim Bale

                                                                                                  1
BUILDING A BETTER MARKET
CONTENTS
ACKNOWLEDGEMENTS ................................................................................................. 3
ABOUT THE AUTHORS ................................................................................................... 3
EXECUTIVE SUMMARY .................................................................................................. 4
CHAPTER 1: INTRODUCTION .......................................................................................... 7
CHAPTER 2: MARKET STRUCTURE ................................................................................. 8
CHAPTER 3: QUALITY OF NEW HOUSING ....................................................................... 17
CHAPTER 4: LOCATION OF NEW HOUSING DEVELOPMENTS .......................................... 19
CHAPTER 5: DESIGN OF NEW HOUSING ....................................................................... 22
CHAPTER 6: POLICY PROPOSALS ................................................................................ 24
APPENDIX .................................................................................................................. 27
END NOTES ................................................................................................................ 28
2SOCIAL MARKET FOUNDATION
ACKNOWLEDGEMENTS
The Social Market Foundation retains full editorial independence with respect to its research.
ABOUT THE AUTHORS
Salima Ali
Salima is a researcher at the SMF. Prior to joining the SMF, she worked on a range of areas within
financial regulation including mortgages, retail investments, and wholesale financial markets.
Salima holds a BSc in Economics from LSE.
3BUILDING A BETTER MARKET
EXECUTIVE SUMMARY
Buying a home is one of the most important purchases that a consumer will make in their lifetime,
and the market should work well to meet the needs of consumers. This report focuses on how to
improve the market in the interests of consumers. Currently, there are misaligned incentives
between housebuilders and consumers. Systems of redress do not provide sufficient protection
to consumers unhappy with the product they have purchased. Competition between suppliers
is limited because of barriers to entry to the market.
In this report we examine the market structure of the housebuilder market, including the level of
concentration and competition. We also look at the consequences on the outcomes for
consumers, focusing on the quality, size, design and location of new housing. The key findings
of the study are:
• At a national level, the housebuilder market is not highly concentrated. However, this
high-level picture masks a more concerning picture.
• Over the last 30 years, there has been an 80% reduction in the number of small
housebuilders. 1 The decline of small housebuilders, along with the consolidation of larger
housebuilders means the market has become more concentrated in recent years.
• The market concentration varies between regions. Looking at the concentration at a local
or regional level is important, because demand for housing is usually localised.
• Competition is weakened by a number of factors, including barriers to entry for small and
medium housebuilders and misaligned incentives between housebuilders and
consumers. It can be difficult for consumers to compare housebuilders due to asymmetric
information. A lack of competition and weak consumer power means housebuilders can
prioritise maximising profit rather than, for example, meeting consumer needs in terms of
quality.
• Consumer satisfaction in new housing is declining, whilst the number of new homes is
increasing. Only 46% of new buyers were very satisfied with the quality of their new-build
home in 2018, compared to 53% in 2012. 2
• There is a gap between consumer expectations of quality and the quality delivered by
housebuilders. 99% of new homeowners reported problems including snags or defects
since they moved in, and of these, 69% had over 5 problems.3
• It is difficult for consumers to access redress for problems with new homes. The system
is complex and difficult to navigate, and homebuyers are not well informed about what
their warranty covers.
• New homes are not always well connected to transport or amenities. Almost half of new
homes (46%) are not within reasonable walking distance of the nearest railway station.
The report outlines recommendations to make the market work better for consumers. The
Government created a new planning rulebook in 2018, which makes positive steps towards this
4SOCIAL MARKET FOUNDATION
goal. The areas we have considered include measures to improve competition in the market,
improving choices for consumers and ensuring that their needs are met. To realign the incentives
between housebuilders and consumers, we propose a reform to the redress system that will help
to protect consumers.
Steps to improve competition and choice in the market
• Introduce a detailed information package to be made available to prospective
homebuyers. By providing this information, consumers will be able to compare between
their options and make a more informed choice. This package should include:
o Measures on performance of each housebuilder: These should include customer
satisfaction measures, the number of defects in previous homes, number of
warranty claims – these measures should be consistent across the industry.
o Clear information on what the warranty covers. This should help to close the gap
between consumers expectations of what warranties cover, compared to what
they actually cover.
o Objective standards of marketing, including improved measures on transport
connectivity. There should be industry standards for marketing which ensure new
properties are depicted in an objective way, including comparisons to average
measures (e.g. average distance to railway stations). This would complement
existing regulations 1 that aim to prevent misleading advertising.
• Support entry and expansion of small and medium builders in the market, through
reviewing and adapting existing policies. The success of some existing government
initiatives has been limited, so these learnings should be incorporated to improve new
schemes.
o Monitor the increase in volume of small sites following the revised National
Planning Policy Framework (NPPF) requiring at least 10% of overall sites to be
small sites. Consider whether there is scope to increase this percentage over time.
o Introduce a requirement for a minimum proportion of overall sites to be reserved
for custom build homes. The Government has already expressed support of custom
build homes; introducing this requirement will ensure that more custom houses
are built.
Improving protection of consumers
• Improve the current warranty mechanism, which does not provide enough support for
consumers.
1
Consumer Protection from Unfair Trading Regulations 2008 (CPRs) and the Business Protection from
Misleading Marketing Regulations 2008 (BPRs)
5BUILDING A BETTER MARKET
o Allow homebuyers to withhold 5% of the price of the new-build home, which can
then be used by the housebuilder to fix any snagging issues. A similar scheme is
operating successfully in the Netherlands. 4
o Housebuilders should be obliged to provide compensation if repairs are delayed.
This will incentivise housebuilders to take more immediate action if there are
issues with the new home.
• Recent changes in planning policy encourage developers to engage with the local
community. We recommend that the government monitors take-up of this and considers
mandating this approach if it is not taken up widely. Given the importance of new housing
to local communities, this will encourage sustainable developments.
• Introduce compulsory licensing and certification of housebuilder firms (including those
that are subcontracted). This formal system will ensure that all companies have
appropriate standards which should improve quality across the industry.
6SOCIAL MARKET FOUNDATION
CHAPTER 1: INTRODUCTION
In this paper we take a closer look at the housebuilding market, from the structure of market to
the outcomes consumers are facing, such as location and quality of housing. The UK’s housing
market has a significant impact on individuals, as well as the wider economy. The 2017 housing
white paper labelled our housing market as “broken”, and identified the shortage of homes as
one of the key problems. 5 To reach the Government’s target to deliver 1 million net additions to
the housing stock by the end of 2020, the aim is to build 300,000 homes a year.
The housing market is very complex, and new homes are only part of the picture. However, this
report focuses on housebuilding, considering the impact of new homes on the lives of new
homebuyers. In this paper, we are looking at the following topics on new housing:
• Is the housebuilding market concentrated? Is it competitive? How has it changed over
time?
• Is there a problem with the quality of new-build housing?
• Where are new developments located? Are they well connected?
• Are new houses badly designed?
• Are consumers protected by the warranty system?
7BUILDING A BETTER MARKET
CHAPTER 2: MARKET STRUCTURE
We have assessed the level of concentration and competition of the housebuilding market. We
also compare the housebuilding market to other consumer markets.
The housebuilding market is not significantly concentrated, particularly compared to other
consumer markets such as electricity and gas. However, national measures of concentration are
only part of the picture. Consumers can only access housebuilders operating in the area they are
looking to purchase a house, so local market concentration has a big impact on consumer
outcomes. We also found that the housebuilding market is not very competitive, with the decline
of small housebuilders and a number of barriers to entry.
Measuring market concentration
We are using two different types of measures for market concentration.
• The CR1 ratio - the market share of the largest firm within a consumer market.
• The CR4 ratio - the market share of the four largest firms within a consumer market. If the
CR4 ratio is above 40%, the market is concentrated. 6
Another measure of market concentration is the Herfindahl-Hirschman Index (HHI), which is
calculated as the sum of the square of company market shares. We did not have sufficient data
to calculate this measure.
Although the level of market concentration and competitiveness can be linked, we should note
that markets which are not concentrated are not always competitive. A number of competition
issues exist in the housebuilding market, such as barriers to entry to smaller housebuilders.
There is also less flexibility compared to other markets, because demand tends to be more
location specific, and consumers cannot switch provider or end their contract.
We use the following categories for the size of housebuilders, as defined by HBF7 (although
these are approximate):
• “Small” housebuilders - 1-100 units completed per year
• “Medium” housebuilders - 101-1000 units completed per year
• “Large” or “National” housebuilders - Over 1000 units completed per year
Is the housebuilding market concentrated?
We have looked at the current level of concentration and trends over time, which enables us to
understand more about the competitive state of the market. The housebuilding market is not very
concentrated according to the CR1 and CR4 ratios, although the market has become more
concentrated since 2001.
In 2001, the biggest housebuilder had a market share of 6% in 2001 compared to nearly 10% in
2017. The four biggest housebuilders have increased their market share by 10% in the same
period, now accounting for nearly a third of all housing completions. The increase is partially
explained by consolidation in the housebuilding market over recent years. For example, Barratt
Developments became the largest housebuilder after the takeover of Wilson Bowden in 2007.
8SOCIAL MARKET FOUNDATION
Looking further back in time, the housebuilding market has evolved significantly; the proportion
of small and medium sized housebuilders rose between 1960 and 1980, but since the 1980s they
have declined. During the financial crisis, approximately one third of active companies stopped
building homes.8 In particular, smaller housebuilders found it difficult to access finance because
they were perceived to be higher risk.
Figure 1: Estimates of concentration in the housebuilding market, CR1 and CR4 ratios, 2001-2017
40%
35%
30%
25%
20%
15%
10%
5%
0%
2001 2002 2003 2004 2005 2006 2007 2008 2009 2010 2011 2012 2013 2014 2015 2016 2017
CR1 CR4
Source: SMF analysis of Top 25 Housebuilders, https://www.house-builder.co.uk/
How concentrated is the housebuilding market compared to other consumer markets?
The housebuilding market is less concentrated than other consumer markets that we have
looked at. The groceries market is the most concentrated, with the highest CR4 ratio at 70%,
compared to 32% in the housebuilder market. The new car market has the most similar levels of
concentration to the housebuilding market.
Comparing trends since 2000, most of consumer markets we looked at have become less
concentrated over time, most notably the gas and electricity markets. The personal current
account market and housebuilding market have increased in concentration over time.
When comparing the levels of concentration, it’s important to consider that the housebuilding
market is unique among consumer markets. For example, in comparison to gas providers,
consumers are only able to access the housebuilders that physically operate in the area they are
looking to buy a house and they cannot switch between housebuilders.
9BUILDING A BETTER MARKET
Figure 2: Estimates of concentration in consumer markets, CR1 and CR4 ratios, 2017/18
CR4 CR1
Housebuilding
Cars
Mortgages
Electricity
Gas
Groceries
Personal current accounts
Mobile telephony
Broadband
0% 10% 20% 30% 40% 50% 60% 70% 80% 90% 100%
Source: SMF analysis. Figures based on 2018 year-to-date data for the car, groceries, gas, electricity, broadband and
mobile markets. Mortgage market figure based on 2017 data. Personal current account market concentration assumed to
be unchanged from 2016, in light of Financial Conduct Authority research showing little change in the market share of the
largest six banks: https://www.fca.org.uk/publication/multi-firm-reviews/strategic-review-retail-banking-business-
models-progress-report.pdf
10SOCIAL MARKET FOUNDATION
Figure 3: Estimates of concentration in consumer markets, CR1 ratio, 2000-2017/18
60%
50%
40%
30%
20%
10%
0%
2000 2001 2002 2003 2004 2005 2006 2007 2008 2009 2010 2011 2012 2013 2014 2015 2016 2017 2018
Cars Groceries Broadband
Electricity Gas Personal current accounts
Mortgages Housebuilding
Source: SMF analysis. Time periods are not consistent across consumer markets, reflecting data limitations.
11BUILDING A BETTER MARKET
Figure 4: Estimates of concentration in consumer markets, CR4 ratio, 2000-2017/18
100%
90%
80%
70%
60%
50%
40%
30%
20%
10%
0%
2000 2001 2002 2003 2004 2005 2006 2007 2008 2009 2010 2011 2012 2013 2014 2015 2016 2017 2018
Cars Groceries Broadband
Electricity Gas Personal current accounts
Mortgages Housebuilding
Source: SMF analysis. Time periods are not consistent across consumer markets, reflecting data limitations.
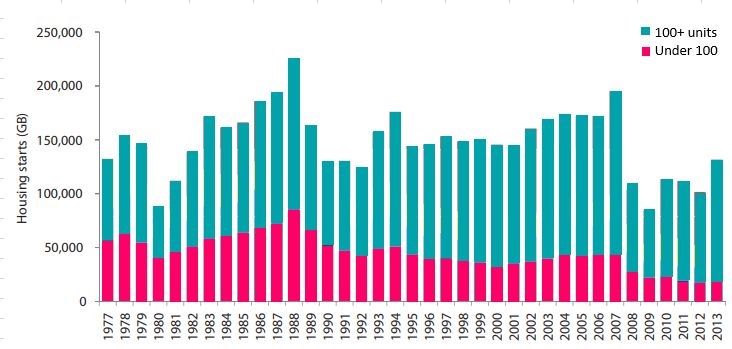
Figure 5: Housing starts by size of developer, 1977-2013
Source: DCLG, NHBC
The decline in small housebuilders helps to shed some light on why the market is becoming more
concentrated, in contrast to the trend of other consumer markets. Smaller housebuilders were
responsible for 40% of completions in 1988, compared to 12% of completions in 2014. Over the
last 30 years, there has been an 80% reduction in the number of small housebuilders. 9
12SOCIAL MARKET FOUNDATION
Having more smaller housebuilders in the market would be beneficial to increase competition,
and improve the diversity of offering to consumers. Smaller sites have also been found to have
quicker build out rates. 10 In addition, as compared with large housebuilders, small suppliers may
be more willing to develop small sites. More small housebuilders could therefore mean that the
amount of developable land increases.
Housebuilders’ profits are increasing
Another trend in the housebuilding market is the consistent increase in profits of large
housebuilders. Analysis of company reports between 2010 to 2015 showed that the biggest
housebuilders saw their profit before tax rise by over 400 percent. 11 Despite land and build
costs remaining similar over time, profits earned per plot are still increasing. The rate of growth
in profit is ten times the rate of increase in completions. 12
The introduction of help-to-buy in 2013 has led to a direct increase in houses being built by
20% on average.13 Meanwhile, new-build house prices have increased, along with developer
profits. This is somewhat concerning; if competition was working well, then an increase in
output would not lead to such inflated profit.
Certain housebuilders have been highlighted; Persimmon Homes had the biggest annual profit
of any UK housebuilder in 2018, at over £1bn. Almost half of their homes were sold through the
help-to-buy scheme. 14 The BBC has reported that the housing minister, James Brokenshire, is
“increasingly concerned” about the practices of Persimmon Homes, including poor quality
workmanship.15
Regional comparison
There are disparities between the number of housebuilders operating in different regions. Some
variation is expected due to regional differences, including population size and levels of demand
in certain areas. For example, the largest housebuilders focus on the South East, where high
demand has resulted in higher house prices 16.
However, to consider the impact on the individual consumer then a more detailed understanding
of what is available in each area is important. We carried out a case study to compare the number
of housebuilders between different counties in the UK. By searching on a property website, we
identified the housebuilders selling new-build properties in a sample of counties at a point in
time.
The range of developers operating varied from a low of 3 in Swansea and Cumbria, to a high of 21
in Surrey. In areas with few developers, potential homebuyers may have restricted options. This
results in little competition between housebuilders in an area, who would not be incentivised to
compete and deliver the best houses.
How competition works in the housebuilding market
In a well-functioning competitive market, supply-side firms are incentivised to compete by
consumers who shop around.
13BUILDING A BETTER MARKET
Firms who produce high quality products at competitive prices will attract more consumers.
Those who consistently produce low quality products are likely to exit the market as
consumers will not shop there.
New firms should be able to enter the market without facing barriers to entry, which will
create more competition for the existing firms.
The regulatory framework should work to protect consumers, implementing standards to
ensure good quality products and services.
Risks of asymmetric information
The new-build housing market functions differently from other consumer markets. Usually,
consumers will be able to base their purchasing decision on the product itself. However, with
new homes, there is an issue of asymmetric information. Potential homebuyers cannot assess
the quality of the home at the point of purchase. They will have to make a choice based on
perceived quality or standards, whether from marketing, recommendations from friends and
family, or other factors such as location. Once the consumer has decided to buy a home, the
housebuilder does not have the usual incentive to deliver on timing or the quality (that would
exist in some other consumer markets), as the consumer is not able to switch providers. Delays
are common in the housebuilding market; over 40% of new-build homes do not meet their
original deadline for completion. 17
The issue of asymmetric information also exists in other markets, and measures are often
introduced to help address these issues. For example, with products such as annuities, at the
point of purchase there could be uncertainty that providers will continue to make payments for
the length of the term. In cases like these, stringent regulation is in place to provide protection
to consumers.
“Speculative” model of housebuilding
The incentives in the housebuilding market operate somewhat differently than in other markets.
The market for land is inextricably linked to the market for new housing, and this results in
“speculative” housebuilding which is based on assumptions of risk, future value and future
profits.
At the first stage, there is competition between developers for land, for which they pay the
‘residual land value’. This involves predicting the value and costs of the development, including
profit for the developer. A key determinant of the future value of the new homes is the current
Residual land value = total value of a development – costs associated with development –
profit for housebuilder
14SOCIAL MARKET FOUNDATION
housing market. Larger housebuilders are able to finance a higher residual land value upfront, so
smaller housebuilders may find it difficult to compete at this stage.
Given this pricing structure, housebuilders aim to maximise value of the new homes, and
minimise costs of development. Taking a simple model of supply and demand, if the supply of
houses increases significantly, prices are expected to fall. It would be in the housebuilders
interests to restrict the amount of each type of house that are built, and release the completed
new homes to the market at a pace that meets consumer demand, and is not detrimental to prices
and hence future profits. If new sites had a greater variety of types of housing, then there is likely
to be more demand; the needs of different consumers would be met. However, larger sites tend
to have more homogeneous homes. 18
In terms of minimising costs, the information asymmetry means that housebuilders could
compromise on quality of materials to reduce costs. Unlike some other markets, this is not
observable to the consumers until a much later stage, at which point they cannot back out of the
contract.
Barriers to entry
The difficulty that smaller housebuilders face in accessing finance is acknowledged widely,
including by the government, as a barrier to entry to the housebuilder market. There have been
government initiatives to address this over the years, although these have not always been
successful. 19 The most recent is £1bn of British Business Bank (BBB) guarantees to encourage
activity of smaller builders. However, this does not support completely new entrants to the
market; to be eligible for this funding, the recipient has to have an existing track record.
Smaller housebuilders face barriers to increasing the output of new homes, including lack of
available land (in particular small sites) and lack of finance. 20 To address this, the revised NPPF
requires at least 10% of overall sites to be small sites. Although this is a positive step, the market
coverage of SMEs will still be limited even if this proportion is reached. The draft NPPF originally
had set 20% as the minimum, although after the consultation this was reduced as local
authorities were concerned that it was too high. 21
Another barrier is the practice of land banking, where developers buy up land but do not build on
it (or restrict the pace of development), whilst it rises in value. Little evidence has been found of
this happening, although larger sites do have lower build out rates.22 Build out rates could be
boosted if houses were more varied in type, design and tenure, to match consumer demand.
How do consumers make their choice?
Research has found that consumers often buy new-build houses for practical purposes, such as
certainty of entry date and price. Location, property type and internal and external design are also
considered to be important factors.23
Several housebuilder ratings surveys exist, although the independence of some of these have
been questioned due to ties with industry. 24 The New Homes Review (NHR) was launched in 2016
as an independent report from the consumer’s perspective, including factors such as quality,
value for money and satisfaction.
15BUILDING A BETTER MARKET
Custom build homes
Custom build homes are commissioned by the homebuyer to local builders, enabling consumers
to have more influence on the design and layout of the home. There are more custom-built homes
in most other countries; for example these account for 80% of homes in Austria, and around 60%
in France and Germany, compared to just 10% in the UK. 25 Research suggests that increasing
custom-build homes could make the market less reliant on the larger firms, and hence less
vulnerable to market shocks and price volatility. 26 The government has announced measures to
support custom-built homes, as there is evidence of increased demand for them and they tend
to be higher quality.27 Increasing the proportion of custom build homes would increase diversity
and lead to homes that are tailor-made to homebuyers’ requirements.
International comparison
The UK has lower rates of construction compared to other European countries, although
residential construction has declined across the EU since 2000, partially due to increasing land
prices. 28
In Germany, small and medium builders account for a higher proportion of new homes. Although
Germany are still falling short of their target amount, rates of housebuilding reach 250,000 per
year, compared to around 190,000 in the UK. 29 On the other hand, the housebuilding market in
Sweden is more concentrated than the UK, with the three biggest construction companies
accounting for nearly two-thirds of the market.30
Countries are also engaging in innovative homebuilding techniques. For example, in Sweden,
off-site techniques account for 30% of new dwellings. 31 Similar techniques are starting to be
used in the UK, for example there has been some development into “modular construction”,
although not at a large scale. 32
16SOCIAL MARKET FOUNDATION
CHAPTER 3: QUALITY OF NEW HOUSING
In 2016, the All-Party Parliamentary Group (APPG) carried out an inquiry into the quality and
workmanship of new housing. Media coverage has also shown homebuyers facing issues with
their new home. For example, recent reporting shows that in the past few years, at least hundreds
of new homes were built with mortar that does not meet industry standards, leading to a weak
structure and even cracking in some instances. 33 This Chapter asks: Is there a gap between the
quality of housing and consumers expectations?
Is there an issue with the quality of new housing?
The Commission of Inquiry into the quality and workmanship of new housing found that
consumers would like the quality of new-build properties to be improved, and highlighted the
imbalance in bargaining power for consumers. The inquiry was driven by the disparity between
customer demands of quality and industry delivery. 34
The main housing defects faced by homeowners include:
• Snagging issues: these are minor but common defects caused by poor workmanship
• Structural defects: these are usually covered by the 3-10 years in a warranty
• Non-structural latent defects: these are caused by poor workmanship, poor design or
inadequate materials
Market-wide issues such as poor competition, skills shortages and poor quality controls are
contributing factors to the shortcomings in quality of new homes. 35 The culture of housebuilders
that does not prioritise consumers is also an issue. In terms of the actual workmanship, builders
do not require a formal qualification or a formal license to practise. Nearly 80% of home owners
want a licensing scheme for construction to be introduced. 36
Consumer satisfaction
Although results of consumer surveys can be mixed, overall they convey an unsatisfactory picture
of the quality of new-build homes. Over the years, the Home Builders Federation (HBF) survey
has shown declining levels of consumer satisfaction. In 2012, 53% of new buyers were very
satisfied with the quality of their new-build home, compared to 46% in 2018. 37 Satisfaction levels
at nine months after completion are generally between 5% and 10% lower than those measured
at eight weeks (although the questions are not identical). 38
In 2017, research from Shelter and YouGov found that 51% of homeowners have experienced
major problems with their properties, including issues with construction, unfinished fittings and
faults with utilities. 39 The 2018 HBF survey found that 99% of new homeowners reported
problems including snags or defects since they moved in, compared with 91% in 2012. 40 Of these,
69% had over 5 problems and a quarter of new homebuyers had over 16 problems.
17BUILDING A BETTER MARKET
Figure 5: Percentage of homebuyers with problems with their new home, and number of problems
reported
Have you reported any problems with your home Approximately how many problems have you
(snags, defects) to your builder since you moved in? reported to your builder?
1%
31%
41%
28%
99%
Yes No 1-5 6-10 Over 10
Source: SMF analysis, HBF consumer satisfaction survey
Whilst the number of new home completions each year has been increasing, consumer
satisfaction appears to be decreasing. Taking all this into account, it appears that the market is
not operating to deliver good consumer outcomes. With the need for new homes to be built, it is
increasingly important that new housing reaches sufficient standards.
In many European countries more than half of new homes are custom built, and these homes tend
to be built to a higher quality. Self-builders tend to focus on the quality and meeting the
consumer’s needs, rather than just maximising profit. 41
Size of new homes
We have also looked at the size as another measure of quality of new homes. Studies have shown
that size of homes can affect both physical and mental health. 42 With the UK having the smallest
homes on average compared to Europe, are the size of new homes meeting consumer needs? 43
There are no mandatory minimum space standards for housing in England, compared to many
countries in Europe. In 2015 the government introduced a nationally described space standard,
as a recommended measure. In London, the GLA also adopted a standard for all new-build homes
in 2011.
Research has found that living rooms of newly built homes are nearly a third smaller than
equivalent homes built in the 1970s. 44 The size of private gardens, particularly back gardens,
have been found to decrease over time, as the proportion of flats has increased with shared plots
becoming more common. 45
A partial reason for this trend in size could reflect the change in types of homes, lifestyle and
other factors over time, However, nearly half of the public would support larger homes being built,
compared to nearly a quarter who would support developments of smaller ones. 46
18SOCIAL MARKET FOUNDATION
CHAPTER 4: LOCATION OF NEW HOUSING DEVELOPMENTS
The location of new developments has an impact on consumer lifestyles and whether
communities are sustainable. New homes may be attractive to prospective homebuyers if they
are cheaper to houses in more central locations, but poor transport links can lead to additional
costs and incur negative externalities affecting the wider community. Although the planning
system is intrinsically linked to location of new homes, we are focusing on how location can affect
consumer outcomes, rather than the planning system itself.
Why is location important?
New homebuyers should be able to access (whether through public transport, walking or cycling)
essential amenities which include: education, healthcare, supermarkets, employment, as well as
other communal facilities such as libraries and green spaces. Whilst we may expect new housing
to be built further from existing hubs that are already densely populated, it is still essential to
have investment into improving connections to nearby amenities.
If connectivity is poor, new homeowners may face higher motor costs, and spend more time
travelling particularly if roads are congested. Government policy encourages walking, cycling and
public transport over car use, both from an environmental and public health perspective.
We looked into whether new homes have access to local supermarkets and found that there is
not particular problem associated with new-builds. 2 Our findings were in line with wider findings
from previous SMF analysis, showing that a significant minority of new homes – as with older
homes – are located in areas with poor access to groceries.
Railway stations
We wanted to know whether new homes have good connectivity to railway stations. Research
has found that new developments seem to be built on the outskirts of towns, with cars being the
only viable option for transport.47 However, in 2016, the government announced a programme of
development of railways stations and surrounding land, to deliver up to 10,000 new homes.
Although the majority of new homes are built in urban areas, they are not always well connected.
We may expect connectivity to be poorer in the short term as new houses are built further from
town centres, there should be appropriate investment to address this. This would help to achieve
the long-term government aim to reduce car dependency and encourage alternative forms of
transport.
We have used the following measures for walking distance:
• Easy walking distance: under 1 km (approximately 10 minutes)
• Maximum reasonable walking distance 3: under 2km (approximately 20-25 minute walk)
2
See Annex 1 for methodology
3
From previous Planning Policy Guidance, 2km has often been used as an approximation for the maximum
reasonable walking distance
19BUILDING A BETTER MARKET
We found that nearly half of new homes are not built within reasonable walking distance of the
closest railway station. 46% of new homes are over 2km from the nearest railway station. Out of
these homes, over 60% are located in urban areas.
New homes which are located closer to the railway stations tend to be in urban areas, as shown
in Figure 7. The further away new homes are from the nearest railway stations, the more likely
they are to be in rural areas.
Figure 7: Distance of new homes to nearest railway station, by rural and urban areas
60000 100%
90%
50000
80%
Number of new homes
70%
40000
60%
30000 50%
40%
20000
30%
20%
10000
10%
0 0%
0-1 1-2 2-4 4-6 6-8 8-10 >10
Rural areas Urban areas New homes
Source: SMF analysis of HM Land Registry price paid data and Office of Rail and Regulation data on UK railway stations
Our analysis focuses on railway stations and does not include bus transport because of lack of
accessible data. Indeed, there may be bus routes providing better connectivity for some of these
areas further from rail stations. However, we still need to consider the means of transport for new
homebuyers, what the impact is on their day-to-day lives and in the long term.
Other research
Our findings are in line with other existing research. Generally, new towns have higher levels of
car dependency, with Milton Keynes being one of the most car dependent cities. 48 The revised
NPPF aims to tackle this trend, emphasising that new developments also need the infrastructure
to support walking, cycling and using public transport.
A recent field-based project by Transport for New Homes found that new developments do not
have satisfactory walking, cycling and public transport connections. Infrastructure investment
into surrounding areas are primarily for increasing road capacity. 49
Schools
We also looked at whether new houses are located near to primary schools. The average distance
of a child to travel to primary school is 1.6 miles. 50 Over 95% of new homes are at or below the
average distance from the closest primary school.
20SOCIAL MARKET FOUNDATION
We can see that new homes are located within a reasonable distance to primary schools.
However, distance is not the only important factor; the extent to which nearby schools are
oversubscribed must also be considered. Further research in this area is important.
21BUILDING A BETTER MARKET
CHAPTER 5: DESIGN OF NEW HOUSING
The design of housing is undoubtedly important to local communities, although what constitutes
‘good design’ does depend on personal preferences. The “Building Better, Building Beautiful”
Commission has been announced to promote better design and style of homes that are in line
with the preferences of local communities.
Why does the design of new homes matter?
Homogeneous types and tenures of homes have been identified as a significant cause of low
build out rates in the Letwin Review. Diversifying new homes, including design and style to match
the demand in a local area, could help to boost absorption rates and ultimately improve build out
rates. 51 New developments in the UK tend to be homogeneous, compared to countries like
Germany which have a more diverse mix of housebuilders who build a wider range of homes at
higher build out rates.52
Better design could help make more land available for development. Local communities value the
design of new housing and there could be resistance to new housing developments if it is not in
line with their preferences. A survey from 2013 found that 73% of people would support housing
developments if homes were better designed and in keeping with the local area. 53
Well-designed homes in a local area can also improve the wellbeing of the local community.
Research has found that beautiful architecture as well as green space can be beneficial to health
and happiness. 54 84% of people agree that a well-designed community improves people’s
happiness, and better quality buildings and public spaces improve people’s quality of life. 55
Are well designed homes valued more by consumers?
Although consumer preferences can differ, people prefer new homes and communities to be built
in a traditional style, although with support for modern styles if in line with the local area. 56 Survey
results showed that 47% of respondents agreed that new-buildings are intrusive rather than
sensitive to their local environment. 77% of respondents believe that “cost is too often an excuse
for badly designed, soulless new developments”. 57
Evidence shows that style of housing is highly valued; a study carried out in the Netherlands
showed there is a significant price premium for neo-traditional architecture. 58 In most of the UK,
homes built before 1919 have increased in price at a faster rate than modern homes.59
Why do we have badly designed homes?
Housebuilders may not have the incentive to design homes in the interests of the local
community under the current market model with limited competition and choice. With the aim to
maximise profit, they are incentivised to prioritise minimising costs rather than creating the most
suitable design for the area. Changes to the NPPF should help to address this, which now
requires councils and developers to work with local communities to provide input into the new
developments. This aims to develop sustainable communities, and to make the planning system
work better to incorporate this.60
Planning restrictions may prevent some elements of traditional architecture. For example, some
traditional Georgian homes break a number of different planning rules, such as staircase width.
22SOCIAL MARKET FOUNDATION
The NPPF encourages local planning authorities to set out policies for areas, including
establishing design principles within the local areas.
23BUILDING A BETTER MARKET
CHAPTER 6: POLICY PROPOSALS
This chapter outlines the policy proposals aimed to close the gap between consumer
expectations of new homes and what housebuilders deliver. An essential part of this is to align
incentives of housebuilders and consumers, which will balance out the current imbalance of
bargaining power. Improving the redress system will help to provide more support to consumers.
Recommendations
Recommendation 1
Improve the current redress system, which does not provide enough protection for
consumers. This will include:
a. Introducing a system where the homebuyer can withhold 5% of the price of the new-build
home, which can then be used by the housebuilder to fix any snagging issues. This will
encourage housebuilders to carry out repairs promptly, providing the homebuyer with
more bargaining power.
b. Housebuilders to provide compensation if repairs are delayed. This will incentivise
housebuilders to take prompt action if there are issues with the new home.
The new home warranty system in the UK can be difficult for consumers to navigate. A recent
Parliamentary consultation on how to strengthen consumer redress identified there are around
15 types of warranties, as well as several consumer codes of conduct and ombudsman schemes
operating in the property and housing market. 61
Nearly half of new homeowners do not have a correct understanding of what their warranty
covers. 62 The standard warranty for new homes in the UK lasts for 10 years, with the first two
years covering snags and defects, and the remaining 8 years covering issues relating to the
structure of the home.
The Consumer Code for Home Builders was introduced by the industry in 2010 to combat
snagging issues and improve redress. However, it appears not to provide homebuyers with the
safeguards they require or offer consumers a satisfactory form of redress. 63 The creation of a New
Homes Ombudsman was announced in October 2018, which was created to support homebuyers
who are facing problems with their new home, and hold developers to account.
International examples
Netherlands warranty system
In the Netherlands, the new homebuyer can make payments in instalments that correspond
with progress of the work. They also can reserve the last instalment, at a maximum of 5% of
the contract sum, to be used for the repair of any defects upon completion. 64 This amount is
kept with a civil-law notary as a deposit for up to three months after completion. The builder is
accountable for smaller hidden defects for up to five years, and structural issues for up to 20
years.
Other countries
France and Spain have a similar 10-year guarantee to the UK. However, in France, homeowners
can bring legal action against the housebuilder for up to 30 years if the property doesn’t meet
the specification in sale contract (compared to 6 years in England and Wales). In New Zealand,
24SOCIAL MARKET FOUNDATION
housebuilders are self-regulated and warranties appear to be less effective, and cases of poor
quality buildings appear to be similar to the UK. 65
Recommendation 2
Introduce a detailed information package to be made available to prospective homebuyers.
Consumers will be able to use this information to compare between their options and make a
more informed choice. This package should include:
a. Objective standards of marketing. There should be industry standards for marketing which
ensure new properties are depicted in an objective way. This should also include
comparisons to average measures (e.g. average distance to railway stations)
b. Measures on performance of each housebuilder: These should include customer
satisfaction measures, the number of defects in previous homes, number of warranty claims
– these measures will be consistent across the industry.
c. Clear information on what the warranty covers. This should help to close the gap between
consumers expectations of what warranties cover, compared to what they actually cover.
d. Improved measures on transport connectivity of areas across the UK. This will make it
easier for prospective homebuyers to make a decision on their house purchase based on
the location and connectivity.
Due to asymmetric information, it can be difficult for consumers to compare between the new
homes they are choosing. By introducing this package of information measures, this should help
to share the most relevant and accurate information. Although housebuilder ratings do exist,
including more specific measures such as the number of warranty claims will encourage
housebuilders to deliver a higher quality output in order to be more competitive. Including
averages will also make it easier to have a benchmark for comparison.
Recommendation 3
Supporting entry and expansion of small and medium builders in the market. This builds on
existing government initiatives to encourage smaller builders.
a. Monitor the increase in number of small sites following the revised NPPF requiring at least
10% of overall sites to be small sites. Consider whether there is scope to increase this
percentage over time.
b. Introduce a requirement for there to be a minimum proportion of overall sites to be for
custom build homes. The government has already expressed support of custom build
homes; introducing this requirement will ensure that more custom houses are built.
Over the years, the government has taken steps to encourage small and medium housebuilders
to operate in the market, in recognition of the value that they bring. Our proposals aim to monitor
these and take these further if necessary, to ensure that the desired outcome is achieved.
Increasing smaller housebuilders activity in the market will increase competition, and the choice
and diversity of offerings available to consumers.
25BUILDING A BETTER MARKET
Recommendation 4
The government should monitor the effect of planning framework rules that encourage
consultation of local communities on the design of new developments. They should consider
making this mandatory if there is not sufficient take up. Given the importance of new housing
to local communities, this will encourage sustainable developments.
We know that communities care about the homes that are being built in their local area. In the
revised NPPF, local authorities are advised to encourage developers to engage with the
community, but this is not compulsory. By monitoring the take up of this, and making this
mandatory if it is not taken up widely, it will ensure that communities have the opportunity to
provide input into this process. New developments should be built taking into consideration their
thoughts, concerns and preferences.
Recommendation 5
Introduce compulsory licensing and certification of housebuilder firms (including those that
are subcontracted). This formal system will ensure that all companies have appropriate
standards which should improve quality across the industry.
Currently, housebuilders are not required to have a formal qualification or license in order for
them to start building. 66 Introducing a licensing scheme has public support, including nearly 80%
of consumers who want this to be introduced. 67 Other countries including Germany and Denmark
have licensing schemes in place. 68 This policy could ensure that standards are brought back up,
and improve trust in the market.
26SOCIAL MARKET FOUNDATION
APPENDIX
Methodology for mapping exercise
We carried out a mapping exercise to understand whether new homes have access to local
grocery stores.
We used the government’s Interdepartmental Business Register (IDBR), and the Land Registry
dataset for homes built between 2017-2018. The IDBR data is a comprehensive data source for
UK businesses in all sectors. It covers 2.6 million businesses, other than very small businesses
(those without employees and with turnover below the tax threshold) and some non-profit
making organisations.
Both new homes and local amenities were plotted at the “middle layer super output area” (MSOA)
level for England and Wales, which are generated to have a similar population size. MSOAs
typically have a minimum population size of 5,000 and a mean of 7,200. We were not able to
include Scotland and Ireland in the analysis as we did not have comparable data.
Note there are some limitations to the IDBR data. The number of businesses in each area is
rounded to the nearest 5, therefore if there are 2 stores this will be shown as 0. MSOAs are also
different sized; in less densely populated places the MSOA will be larger, so it may be further to
travel to local stores.
Our findings showed that 16% of the areas with new homes would be classified as a food desert,
with two or fewer supermarkets or convenience stores. Previous SMF analysis has estimated that
18% of areas in England and Wales are food deserts 69, so it does not appear that new homes are
being built disproportionately more in areas that are food deserts.
Rural areas are more likely to have a restricted choice of food stores. 18% of areas with new
homes are in rural areas, and they make up 35% of the food deserts identified.
27BUILDING A BETTER MARKET
ENDNOTES
1
HBF, Reversing the decline of small housebuilders (2017)
2
HBF, National New Home Customer Satisfaction Survey (2018)
3
Ibid
4
http://cdn.loyensloeff.com/media/6947/building-in-the-netherlands.pdf
5
DCLG, Fixing our broken housing market (2017)
6
Lipczynski et al., Industrial Organization: Competition, Strategy, Policy, (2005, p. 215)
7
HBF, Reversing the decline of small housebuilders (2017)
8
Ibid
9
Ibid
10
RT Hon Sir Oliver Letwin MP, Independent Review of Build Out Rates draft analysis (2018)
11
Tom Archer and Ian Cole, Profits Before Volume? Major House Builders and the Crisis of Housing Supply,
Sheffield Hallam University Centre for Regional Economic and Social Research (2016)
12
Ibid
13
MHCLG, Evaluation of the Help to Buy Equity Loan Scheme 2017 (2018)
14
https://www.bbc.co.uk/news/business-47368308
15
https://www.bbc.co.uk/news/business-47356378
16
https://www.telegraph.co.uk/finance/property/11589947/Mapped-where-the-biggest-house-in-the-
UK-are-being-built.html
17
https://www.labc.co.uk/news/new-homes-review-reveals-delays-and-snags-biggest-issue-new-
builds?language_content_entity=en
18
RT Hon Sir Oliver Letwin MP, Independent Review of Build Out Rates draft analysis (2018)
19
IPPR, Think small, build big: lessons from SME building in Germany (2017)
20
FMB, Housebuilders’ Survey (2017)
21
MHCLG, Government response to the draft revised National Planning Policy Framework consultation (2018)
22
RT Hon Sir Oliver Letwin MP, Independent Review of Build Out Rates draft analysis (2018)
23
JRF, Preferences, Quality and Choice in New-Build Housing (2004)
24
https://www.theguardian.com/business/2017/feb/06/new-homes-warranty-nhbc-uk
https://www.independent.co.uk/news/uk/home-news/bovis-homebuyers-cash-property-newbuilds-
housing-developers-a8330766.html
25
National Self Build Association, Self-build as a Volume House Building Solution, 2008
26
KPMG and Shelter, Building the Homes We Need (2014)
27
DCLG, Fixing our broken housing market (2017)
28
Housing Europe, The State of Housing in the EU 2017 (2017)
29
IPPR, German Model Homes? (December 2016)
30
Hüfner and Lundsgaard, The Swedish Housing Market (2018). Last available figure for market share is
2003, but recent analysis shows that this is still similar.
31
Terner Center, Housing in Sweden: a Memo (2017)
32
https://www.theguardian.com/society/2018/nov/30/uk-housebuilding-revolution-65000-prefab-
homes-go-into-production
33
https://www.bbc.co.uk/news/business-46454844
34
APPG, ‘More Homes, Fewer Complaints’ (2016)
35
Ibid
36
https://www.fmb.org.uk/about-the-fmb/newsroom/nearly-80-of-builders-and-consumers-support-
licensing-construction/
37
HBF, National New Home Customer Satisfaction Survey (2018)
38
APPG, More Homes, Fewer Complaints (2016)
39
https://england.shelter.org.uk/media/press_releases/articles/rigged_housebuilding_system_means_
eight_in_ten_families_cannot_afford_new_home,_says_shelter
40
HBF, National New Home Customer Satisfaction Survey (2018)
41
National Self Build Association, Self-build as a Volume House Building Solution, 2008
42
Office of the Deputy Prime Minister, The Impact of Overcrowding on Health and Education (2004)
43
https://www.cam.ac.uk/research/news/study-finds-premise-behind-bedroom-tax-is-fundamentally-
flawed
44
https://www.theguardian.com/business/2018/apr/08/uk-living-rooms-have-shrunk-by-a-third-
survey-finds
45
MHCLG, English Housing Survey Floor Space in English Homes (2018)
28SOCIAL MARKET FOUNDATION
46
Shelter, Little boxes, fewer homes (2013)
47
Transport for New Homes, http://www.transportfornewhomes.org.uk/wp-
content/uploads/2018/07/transport-for-new-homes-summary-web.pdf (2018)
48
https://bettertransport.org.uk/sites/default/files/pdfs/Car_Dep_Scorecard_2014_LOW_RES.pdf
49
Transport for New Homes, http://www.transportfornewhomes.org.uk/wp-
content/uploads/2018/07/transport-for-new-homes-summary-web.pdf (2018)
50
DfT, National Travel Survey 2014: Travel to school (2014)
51
RT Hon Sir Oliver Letwin MP, Independent Review of Build Out Rates draft analysis (2018)
52
IPPR, German model homes? A comparison of the UK and German housing markets (2016)
53
Shelter, Little boxes, fewer homes (2013)
54
https://www.telegraph.co.uk/news/science/science-news/12065883/Beautiful-urban-architecture-
boosts-health-as-much-as-green-spaces.html
55
Policy Exchange, Building More, Building Beautiful (2018)
56
Ibid
57
Ibid
58
Amsterdam School of Real Estate, Edwin Buitelaar and Frans Schilder, The Economics of Style.
https://eres.architexturez.net/system/files/eres2015_113.content.pdf
59
Create Streets, A place to call home (2018)
60
https://www.gov.uk/government/news/james-brokenshire-building-better-and-beautiful-will-deliver-
more-homes
61
APPG, Better redress for homebuyers (2018)
62
https://hoa.org.uk/2017/05/new-build-warranties/
63
APPG, More Homes, Fewer Complaints 2016)
64
http://cdn.loyensloeff.com/media/6947/building-in-the-netherlands.pdf
65
https://www.theguardian.com/money/2017/mar/11/why-are-britains-new-homes-built-so-badly
66
https://www.fmb.org.uk/about-the-fmb/newsroom/nearly-80-of-builders-and-consumers-support-
licensing-construction/
67
https://www.fmb.org.uk/about-the-fmb/newsroom/nearly-80-of-builders-and-consumers-support-
licensing-construction/
68
FMB, Licence to build: A pathway to licensing UK construction (2018)
69
SMF, What are the barriers to eating healthily in the UK (2018)
29You can also read