INVESTOR PRESENTATION - Spartan Delta Corp. (SDE: TSXV) January 6, 2021 - Squarespace
←
→
Page content transcription
If your browser does not render page correctly, please read the page content below
INVESTOR PRESENTATION
Spartan Delta Corp. (SDE: TSXV)

January 6, 2021
SPARTAN DELTA CORPORATE STRATEGY
Building a Sustainable Energy Company for Global Investors
                                             DISCIPLINED CONSOLIDATOR
                                             Building towards > 100,000 BOE/d

WEST CENTRAL ALBERTA – Building Critical Mass                                                NEW CORE AREAS – Opportunity Driven
  ▪ Stable production base with
COMPANY OVERVIEW
Spartan Delta Corp.

Capitalization

Spartan Delta Corp.                       TSX-V        SDE

Share Price (1)                           $/sh         3.16

Market Capitalization (basic) (1)         $MM         190.3
Common Shares Outstanding (basic)         MM           60.2
Fully Diluted Shares Outstanding          MM           79.7
                                    (2)
Net Debt (as at Sept 30, 2020)            $MM          14.5
LMR (as at Sept 30, 2020)                  (x)         5.5
Dilutive Proceeds                         $MM          26.3
Insider Ownership (basic)                  %            26

2020 Guidance (3)

FY2020E Production                        boe/d   15,300 - 15,500
Q4E Production                            boe/d   26,000 - 26,200                                                                      Central Alberta
                                                                                                                                       •   Cretaceous Oil and Liquids-
FY2020E Capital Expenditure               $MM         18 - 21                                                                              Rich Gas Focus
                                                                                                                                       •   Additional consolidation
                                                                                                                                           opportunities
Q4E Capital Expenditure                   $MM         15 - 18
                                                                                                                                       •   Spirit River and Cardium
                                                                                                                                           drilling upside

                  January 6, 2021                                                                                                                                   3
                                                                    1.   Share price as at closing on January 5, 2021
                                                                    2.   See “Non-GAAP Measures” in Disclaimers
                                                                    3.   See “Forward Looking Statements” and “FOFI” in Disclaimers.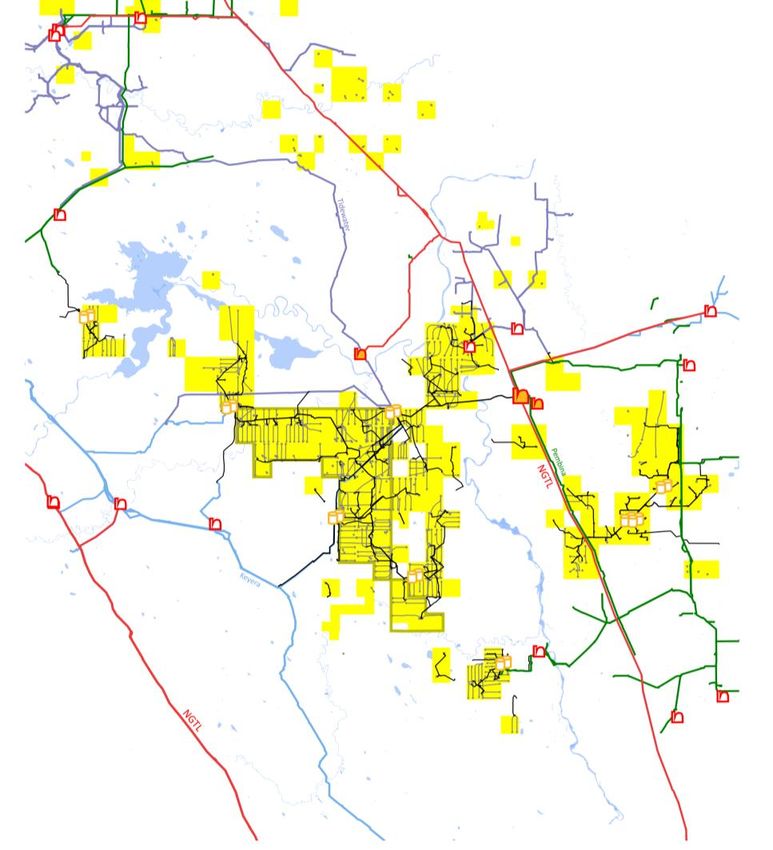
Q3 2020 HIGHLIGHTS
First Full Quarter of Operating Results Post Acquisition

Actuals                                         Q3

Crude Oil and Condensate (1)        %           5%

Natural Gas Liquids ("NGLs") (1)    %           26%

Natural Gas                         %           69%

Average Production                 boe/d       26,282

Operating expenses                 $/boe        6.10

Transportation                     $/boe        1.34

Royalties                           %           8.5%

Operating Netback                  $/boe        8.32

G&A                                $/boe        1.50

Interest                           $/boe        0.26
                                                                                                           12% reduction
Adjusted Funds Flow (2)            $MM          14.4                                                         in OPEX

Capital Expenditure                $MM          1.2

Well Count                           #           0

Free Funds Flow (2)                $MM          13.2

Exit Net Debt (Surplus) (2)        $MM          14.5

              January 6, 2021                                                                                              4
                                                       1.   See “Oil and Gas Advisories” in Disclaimers.
                                                       2.   See “Non-GAAP Measures” in Disclaimers.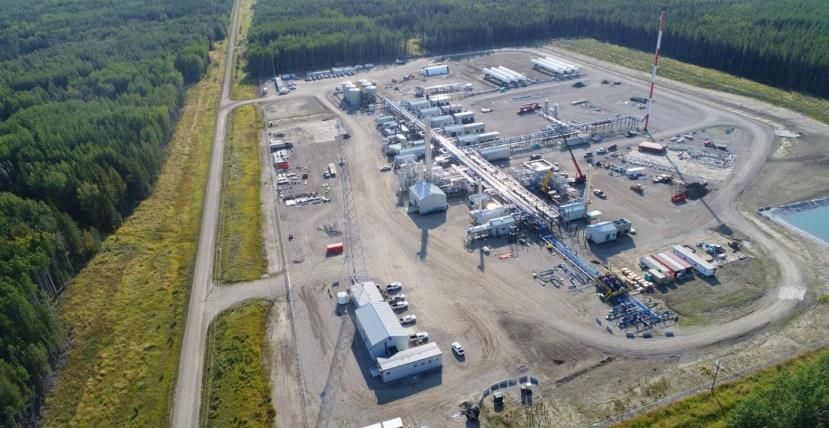
2021 GUIDANCE
 Poised to Deliver Organic Growth and Material Free Funds Flow Yield in 2021

Guidance (1)                                                                                                       New 2021 Guidance                                          Prior 2021 Guidance                                 Change (%)
                               (2)
Crude Oil and Condensate                                                 %                                                    5%                                                           5%                                             -
                                     (2)
Natural Gas Liquids ("NGLs")                                             %                                                   25%                                                          25%                                             -

Natural Gas                                                              %                                                   70%                                                          70%                                             -

Average Production                                                    boe/d                                          29,000 - 31,000                                             27,000 - 29,000                                         7%

Operating expenses                                                    $/boe                                                  5.10                                                         6.00                                         (15%)

Transportation                                                        $/boe                                                  1.45                                                         1.45                                            -

Royalties (2)                                                            %                                                   11%                                                          11%                                             -
                         (3)
Operating Netback                                                     $/boe                                                 11.05                                                        10.15                                           9%

G&A                                                                   $/boe                                                  1.40                                                         1.50                                          (7%)

Adjusted Funds Flow (3)                                                $MM                                                   92.5                                                          66                                           40%

Capital Expenditure (4)                                                $MM                                                    43                                                        40 - 43                                           -

Well Count                                                                #                                                    9                                                          8-9                                             -
                   (3)
Free Funds Flow                                                        $MM                                                   49.5                                                       23 - 26                                        102%

Exit Net Debt (Surplus)                                                $MM                                                  (34.5)                                                        (8.5)                                        306%

                  January 6, 2021                                                                                                                                                                                                                     5
                                           1.   See “Forward Looking Statements” and “FOFI” in Disclaimers.   3.   See “Non-GAAP Measures” in Disclaimers. Metrics based on a budget premise price deck of: C$2.75/GJ AECO gas, US$45/bbl WTI, 1.32USD/CAD FX,
                                           2.   See “Oil and Gas Advisories” in Disclaimers.                       US$2/bbl Edm. Condensate Differential (C$56.76/bbl), US$4/bbl Edm. Light Differential(C$54.12/bbl) & US$0.50/gal Conway Propane
                                                                                                              4.   Capital Expenditure estimate excludes A&D capital.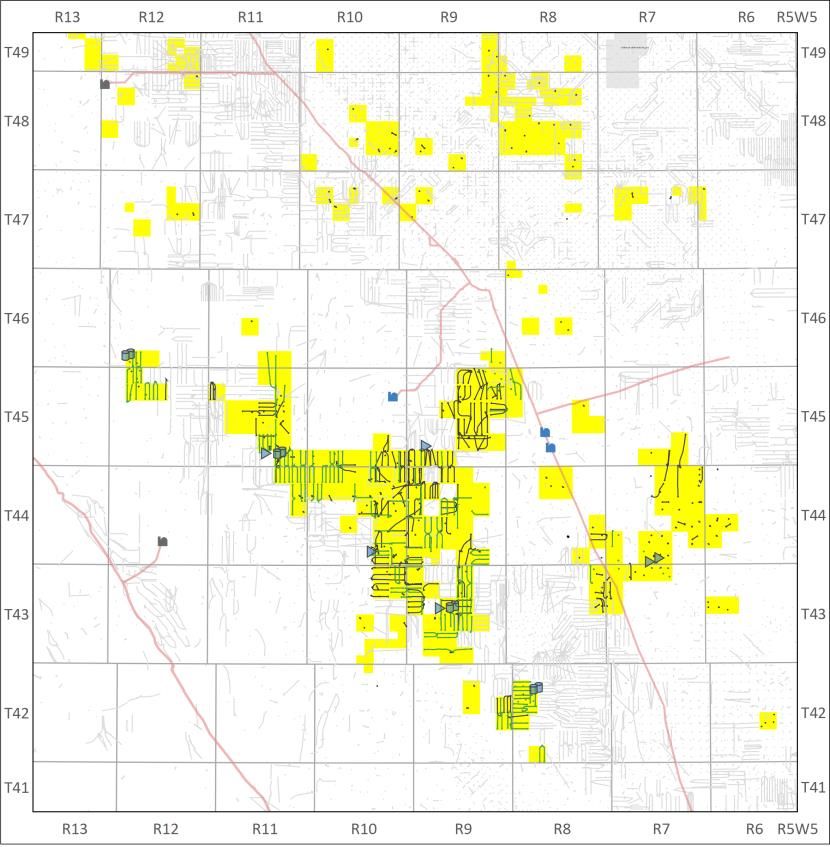
FUNDS FLOW SENSITIVITIES
Peer Leading Free Funds Flow Yield with Torque to Rising AECO and WTI Prices

▪   100% of unhedged natural gas production                                            2021 Adjusted Funds Flow ($MM) - Price Sensitivity
    priced at AECO                                                                      WTI (US$/bbl)                          $40     $45     $50     $55
                                                                     FX                              (US/C$)                    1.34    1.32    1.30    1.30
▪   Sustaining Capital Requirement: < $30                  Edm. Oil Diff                            (US$/bbl)                  $4.00   $4.00   $5.00   $6.00
    million                                        (2)
                                                         Edm. Cond Diff                             (US$/bbl)                  $2.00   $2.00   $3.00   $4.00
                                                                                                       $0.00                    $40     $45     $50     $55

                                                              AECO Gas Price (C$/GJ)
▪   Forecast 2021 Payout Ratio: ~46% (1)                                                              $2.00                    - $25   - $20   - $16   - $10
                                                                                                      $2.25                    - $17   - $12    - $8    - $2
▪   Locations on existing pads will be licensed
    to provide swift optionality for additional                                                       $2.50                    - $11    - $6    - $2   + $4
    wells into stronger pricing                                                                       $2.75                     - $5   $92.5   + $4    + $9
▪   Free Funds Flow will be put towards retiring                                                      $3.00                    + $0    + $5    + $10   + $15
    minimal remaining debt and provide                                                                $3.25                    + $8    + $13   + $17   + $22
    flexibility for future acquisitions

           January 6, 2021                                                                                                                                     6
                                                                        1.             See Budget Pricing assumptions on slide 29.
                                                                        2.             See “Non-GAAP Measures” in Disclaimers.
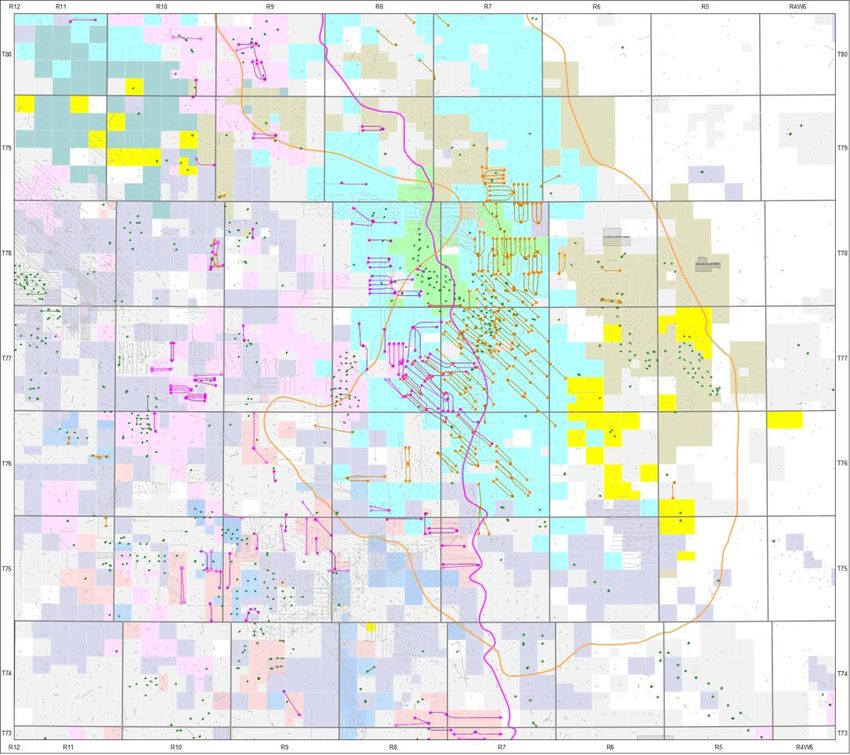
WEST CENTRAL ASSET SUMMARY
    Asset Quality Drives Top Tier Capital Efficiencies and Sustainable Free Funds Flow
▪       Spartan targets liquids rich Spirit River and liquids rich gas and oil
        Cardium

▪       Favorable subsurface properties:                                                                  Deep Basin
                                                                                                          Fairway

        ✓ Situated in the over-pressured deep basin fairway
        ✓ Considerably higher liquids yield than most Spirit River assets
                                                                                                                                                                       Pembina
▪       Multiple stacked targets in the Spirit River provide significant resource
        development opportunities, including maximizing recoveries and
        surface pad synergies
                                                                                                                                                       Cardium over-pressured limit
▪       10+ years of de-risked, highly economic Spirit River and Cardium
        locations across 190,000 gross (130,000 net) acres of land in West
        Central Alberta                                                                                                                                                                Spirit River over-pressured limit

                                                                                                                          Brazeau
    A                                                                                                A’
         100132304410W500                    100030404509W500                  100013304309W500
        Gamma   NPHI   DPHI                 Gamma   NPHI   DPHI                Gamma   NPHI   DPHI

                                                                                                                                                                       Alder Flats
                                Cardium                             Cardium

                                                                                                                                                   A
                                                                                                                                       Ferrier

                                                                                                                                                                  A’                                 Willesden Green

                                 Falher A                           Falher A

                                                                    Falher B                                                                                           Baptiste
                                 Falher B

                                 Wilrich
                                                                  Wilrich

                                                                                                                       Spartan Lands      O’Chiese First Nation              Spirit River Well          Cardium Well

                       January 6, 2021                                                                                                                                                                                 7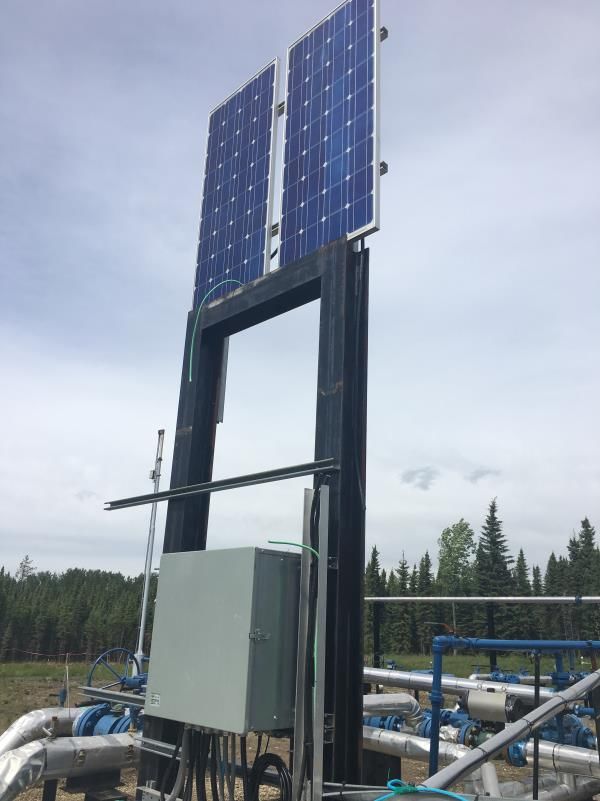
INFRASTRUCTURE ADVANTAGE
Built Out Infrastructure with Deep Cut Liquids Recovery
▪ Spartan’s infrastructure is already built out and significantly increases
capital efficiency as no material infrastructure spending is required in the
near term Tidewater BRC
185 mmscf/d Deep Cut
▪ Infrastructure footprint includes:
1. Working interest (WI) in four gas plants (1) (90 mmscf/d capacity) including
the Spartan operated 10-09 Deep Cut plant
SDE O’Chiese Nees-Ohpawganu’ck 10-09
2. Six compressor stations with ~219 mmscf/d capacity 230mmscf/d Deep Cut (25% WI)
3. Over 550 km of gathering lines
4. Connections to multiple third party deep cut plants with competitive fees
▪ Infrastructure value estimated at $200 MM net to Spartan (2) CVE Sand Creek
75 mmscf/d
(9.6% WI)
▪ Ownership provides lower costs and prioritized access SDE 5-5
1,000 bbl/d
▪ Approximately 80% of Spartan’s gas is processed at a deep cut gas plant. CVE Alder
75 mmscf/d
Having deep cut liquids recovery increased Spartan’s average realized price (20% WI)
by an estimated $1.45/boe or 9% in Q3 2020 (3) SDE 2-10
20 mmscf/d
SDE 13-5
74 mmscf/d
Spartan Realized Price Split SDE 9-3
45 mmscf/d SDE 5-3
Q3 Average Realized Price = $16.19/boe 20 mmscf/d
(excl. processing revenue & hedging) SDE 6-21
40 mmscf/d
SDE 8-4
Q3 Revenue Split 20 mmscf/d
NGL Revenue Split
Oil & Cond,
16%
OBE Crimson
SDE 4-29 60 mmscf/d
NGLs, 25% Shallow Cut Recovery, Deep Cut Recovery, 350 bbl/d
$2.61/boe, 16% $1.45/boe, 9%
Gas, 59%
Spartan Working Interest Gas Plant Spartan Wells Pembina HVP / LVP
Third Party Gas Plant Spartan Pipelines Tidewater Pipelines
Spartan Compressor Station / Battery NOVA NGTL Keyera Pipelines
January 6, 2021 8
1. Includes 100% WI gas processing facility in Rycroft
2. Internally estimated values based on SDE net WI and based on insured, CO&O or historical costs as representations for replacement value
3. Additional NGL revenue of 9% from deep cut recovery is net of the hypothetical increase in gas revenue in a shallow cut scenario. Calculation assumes -17deg LTS shallow cut with 41.9GJ/e3m3 heating value in shallow recovery scenario.
2020/21 WINTER DRILLING PROGRAM
Spirit River and Cardium Development Drilling

▪   Eight wells (net) to be drilled in ’20 / ’21 winter drilling
    program targeting Spirit River and Cardium horizons
▪   Two well pad drilled, completed, and on production as
    of mid-December 2020
▪   Three well pad in final stages of drilling                                                                                             Cardium ERH

▪   All wells from existing pads, flowing into Spartan
    operated infrastructure and are expected to deliver
    >100% IRR on current strip commodity pricing in less
    than twelve months
▪   Accelerating in the first quarter the drilling of two                                                                                                   Notikewin ERH
    wells previously scheduled for fall of 2021, including a       Falher B
    two-mile well into the Cardium formation                       1mi. & ERH

                     Spirit River Stack

                                                                                                                                  Falher B 1 mi.

                                                                     Spartan Working Interest Gas Plant                            Spirit River Producers               Pembina HVP / LVP
                                                                     Third Party Gas Plant                                         Spartan Pipelines                    Tidewater Pipelines
                                                                     Spartan Compressor Station / Battery                          NOVA NGTL                            Keyera Pipelines

              January 6, 2021                                                                                                                                                                 9
                                                                                1.   See Budget Pricing assumptions on slide 29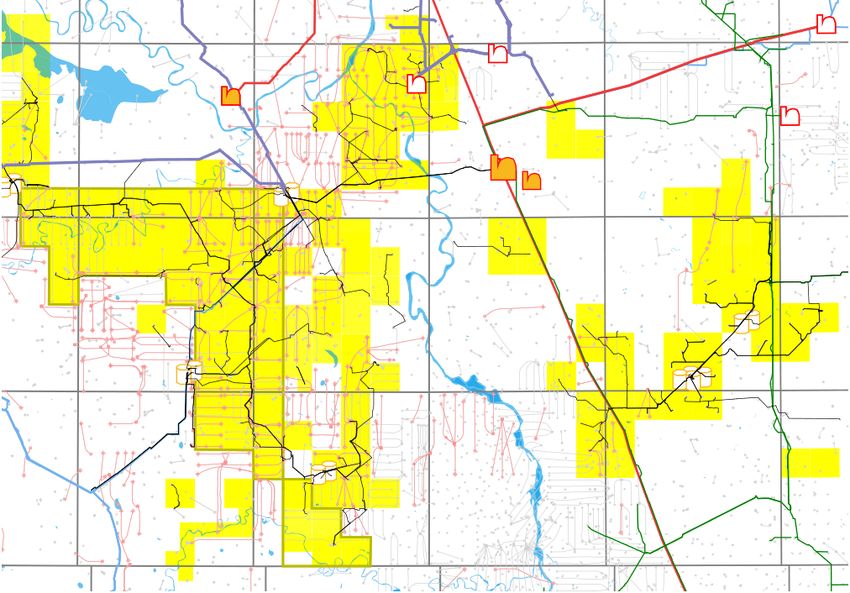
MARKETING & RISK MANAGMENT
Acquisition Value Protected with AECO Hedges

Commodity Exposure – 100% AECO:
▪   Spartan is uniquely positioned with 100% exposure to AECO pricing,
    and no economic burden of transport to underperforming markets

▪   Natural gas production is hedged approximately 33% in 2021

Natural Gas Fundamentals continue to be positive:
▪   Natural gas fired power generation continues to grow with July 2020
    breaking records

▪   Natural gas power generation is the largest component of the North
    American power stack and will continue to grow as coal is phased out

              Current Operating Capacity by Technology

                                                      Coal
                                                      Wind
                                                      Solar
                                                      Other
                                                      Nuclear
                                                      Natural Gas
          Source: ARM Energy

▪   Alberta gas egress coupled with increasing Western Canadian
    Sedimentary Basin gas demand paints an attractive story for AECO
    versus other markets

             January 6, 2021                                               10
INDIGENOUS PARTNERSHIP – O’CHIESE FIRST NATION
O’Chiese First Nation - Partners in Development
▪ O’Chiese First Nation is a joint venture partner in the production of oil and gas
resources that reside on O’Chiese First Nation lands
▪ Spartan has a prosperous relationship with the O'Chiese First Nation based on trust
and mutual respect
▪ Spartan and the O’Chiese together, have created an industry leading Abandonment
& Reclamation Program to protect Indigenous lands for future generations
▪ Spartan uses O’Chiese First Nation businesses and business partners to conduct
field operations
SDE O’Chiese Nees-Opawganu’ck 230mmscf/d Deep Cut Plant (10-9)
January 6, 2021 11SPARTAN SUSTAINABILITY
Environmental, Social & Governance
Canada is a world leader with respect to producing sustainable energy responsibly.
Environment:
▪ Spartan is committed to industry leading environmental practices:
• Spartan has ~400 solar panels, with solar power generation at nearly every pad site
within our core operating area
• Spartan will utilize multi-well drilling pads to minimize its environmental footprint
• Spartan has developed a proactive Abandonment & Reclamation Program with its
Indigenous partner, O’Chiese First Nation
Social:
▪ Spartan has implemented health and safety COVID-19 protocols into its operations and has had
zero incidents as a result
▪ Based on the WCB Industry 6300 for 2020, Spartan ranks 1 out of 256 employers in the Large
Business Experience Rating (ER) program (1)
Governance:
▪ Spartan is significantly aligned with shareholders with 26% Insider Ownership (basic)
▪ Diversity – 30% Female in Management Positions & 43% Female Workforce
Spartan Delta wellsite solar power generation
January 6, 2021 12
1. As per the Workers’ Compensation Board – Alberta Employer Report CardINVESTOR HIGHLIGHTS
Platform for Acquisitive Growth and Free Funds Flow Generation
Experienced team with a record of efficient capital discipline and value creation through consolidation
Sustainable, low decline production base (19%) – Sustaining capital payout ofAppendix January 6, 2021 14
ANALYST COVERAGE & CONTACT INFORMATION

Institution                        Analyst            EXECUTIVE OFFICE                         STOCK EXCHANGE LISTING

                                                      Spartan Delta Corp.                      The TSX Venture Exchange
ATB Capital Markets                Patrick O’Rourke                                            Trading Symbol: SDE.V
                                                      500, 207 – 9th Avenue SW
                                                      Calgary, Alberta T2P 1K3                 INVESTOR INFORMATION
BMO Capital Markets                Ray Kwan
                                                      P: 403 265 8011
                                                      W: www.spartandeltacorp.com              Visit our website
Cormark Securities                 Garett Ursu
                                                                                               W: www.spartandeltacorp.com
                                                      TRANSFER AGENT                           or contact
Desjardins Capital Markets         Chris MacCulloch                                            Investor Relations
                                                      Odyssey Trust Inc.                       E: IR@spartandeltacorp.com
                                                      1230 – 300 5th Avenue SW
Eight Capital                      Phil Skolnick      Calgary, Alberta T2P 3C4                 CORPORATE CALENDAR
                                                      P: 587 885 0960
Haywood Capital Markets            Darrell Bishop                                              March 12, 2021
                                                      AUDITORS                                 Year-end 2020 Results
National Bank Financial            Dan Payne
                                                      PricewaterhouseCoopers LLP
                                                      Calgary, Alberta
Peters & Co. Limited               Dan Grager
                                                      ENGINEERING CONSULTANTS
Raymond James                      Jeremy McCrea
                                                      McDaniel & Associates Consultants Ltd.
                                                      Calgary, Alberta
Scotia Capital                     Cameron Bean
                                                      LEGAL COUNSEL
Stifel - FirstEnergy               Cody Kwong
                                                      Stikeman Elliott LLP
TD Securities                      Dustin Besaw       Calgary, Alberta

                 January 6, 2021                                                                                          15
MANAGEMENT TEAM & BOARD OF DIRECTORS
MANAGEMENT TEAM
Richard McHardy
➢ Former President, CEO and co-founder of Spartan Energy, Spartan Oil and Spartan Exploration
Executive Chairman & Director
Fotis Kalantzis
➢ Former SVP and co-founder of Spartan Energy, Spartan Oil and Spartan Exploration
President, CEO & Director
Geri Greenall
➢ Former CFO and co-founder, Camber Capital Corp., former Portfolio Manager & Chief Compliance Officer, Canoe Financial
CFO
Thanos Natras
➢ Former Geoscience Manager, Spartan Energy, former VP Exploration, Arcan Resources
VP Exploration
Craig Martin
➢ Former Manager D&C, Spartan Energy and Spartan Oil
VP Operations
Randy Berg
➢ Former VP Land, Spartan Energy, former VP Business Development & Land, Renegade Petroleum
VP Land
Mark Hodgson
➢ Former VP Operations, Obsidian Energy, former VP New Ventures & Country Manager, Bankers Petroleum
VP Corporate Development
Brendan Paton
➢ Director, Canoe Point Energy, former Production Engineer, Shell Canada
Manager, Engineering
Ashley Hohm
➢ Former VP Finance, Kelt Exploration, former Manager Financial Reporting, Celtic Exploration
Controller
BOARD OF DIRECTORS
➢ Former Director of Spartan Energy, Spartan Oil, and Spartan Exploration former: President, Cypress Energy; Chairman &
Donald Archibald
CEO, Cequel Energy; President & CEO, Cyries Energy
➢ Former Director of Spartan Energy, Spartan Oil and Spartan Exploration former: Chairman, President & CEO, Big Horn
Reg Greenslade
Resources, Enterra Energy, Enterra Energy Trust, JED Oil; President & CEO, Tuscany International Drilling
➢ Founder and a principal of KO Capital Advisors former Vice Chairman and Co-Head Energy Investment Banking, GMP
Kevin Overstrom
FirstEnergy
➢ Former SVP, Corporate and Business Development, Crescent Point Energy Director of Southern Energy Corp., and Equinor
Tamara MacDonald
Canada
January 6, 2021 16RECENT TRANSACTION SUMMARY
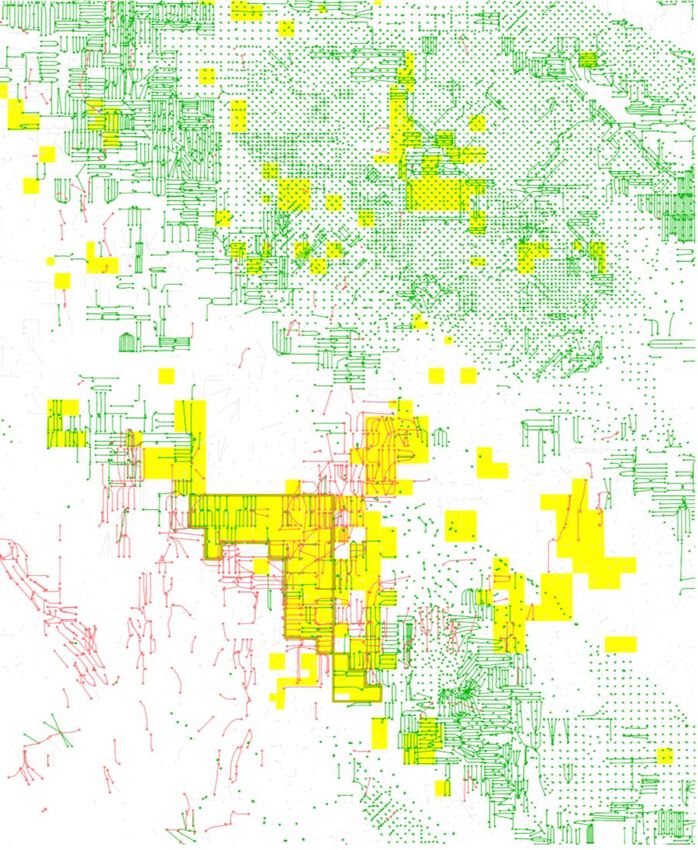
Acquisition of Substantially all Assets of Bellatrix Exploration Ltd. (“BXE”) from CCAA – June 2020
Asset Summary
▪ ~25,000 boe/d (30% liquids) of Spirit River and Cardium oil and gas production.
Drayton
▪ Decline rate of 19%; low maintenance capital required.(1) Valley
Pembina
▪ Proved reserves of 186 million boe with an inventory of 637 Spirit River and Cardium
locations.(2)
▪ Extensive infrastructure footprint with replacement value of ~$200 million net to
Spartan consisting of:
>90 mmcf/d of W.I. gas plant capacity
Alder Flats
>200 mmcf/d in W.I. compressor capacity and
>550 kms of gas gathering lines
▪ Clean asset base with an above average Liability Management Rating (“LMR”) in
Alberta. Brazeau
Ferrier
▪ Includes a successful Indigenous joint venture with the O’Chiese First Nation. Willesden Green
Deal Summary
▪ 2.0x NOI(1) acquisition multiple on strip pricing(3) and $4,352/flowing boe.
▪ $87.5MM cash and $21.3MM estimated assumed liabilities for all assets through a Baptiste
court monitored restructuring process. Deep Basin BXE Lands
WI Gas Plant
▪ This high-quality asset base, which was fatally burdened by its pre-CCAA capital and Gas Plant
BXE Comp/Battery
cost structure will be revitalized under Spartan’s management. BXE Cardium Wells
BXE Spirit River/Other Wells
Industry Wells (750)
▪ Restructured over $70 million per year out of the cost base through CCAA and
Spartan direct negotiations.
▪ Under current commodity prices, the assets generate positive free cash flow and
provide tremendous upside to improved prices.
January 6, 2021 17
1. See ‘Non-GAAP Measures’ in Disclaimers.
2. See ‘Reserves Disclosure’ ‘Drilling Locations / Inventory’ Disclaimer in Appendix.
3. As of May 25, 2020.ACQUISITION RESERVES & INVENTORY
Identified and Verified Greater Than 10 Years of Economic Drilling Inventory
(1)
Reserves Summary
Reserve Volumes Reserve Value (BTax) ▪ Bellatrix reserves evaluated by InSite Petroleum
Gas NGLs Oil Total Insite Dec 31, 2019 Consultants Ltd. (“InSite”) with the Dec 31, 2019
bcf mbbl mbbl mboe C$ MM NPV10 InSite price deck.
Proved Developed Producing 320 15,523 899 69,831 419 ▪ Reserves evaluated prior to the completion of the
Total Proved 842 42,004 3,119 185,536 990 CCAA restructuring and thus certain cost savings
Total Proved + Probable 1,215 60,601 4,956 267,983 1,419 achieved through that process are not captured in
the evaluation.
(2)
Inventory Summary
▪ Spartan has verified over 135 locations which are economic (>60% IRR) at
current strip pricing.
Zone Booked Unbooked Total % Crown
Cardium (3) 140 113 253 69% ▪ Spirit River includes Notikewin, Falher A, Falher B, Falher D/E and Wilrich.
Spirit River 156 227 383 58% ▪ Inventory ties into a variety of available infrastructure.
Total 296 340 637 62%
▪ Main near-term drilling planned for Falher B and Notikewin (Spirit River)
Other (4) 2 250 253 61%
and, if oil prices recover, Cardium oil.
▪ Best economics at current prices are on Falher B and Notikewin. Sample well
economics are shown below, full economics are shown in the appendix.
January 6, 2021 18
1. See ‘Reserves Disclosure’ in Appendix.
3. Inventory represents 1.0-mile laterals in both oil and gas prone areas except for 5.5 net 2.0-mile booked wells.
2. See ‘Drilling Locations / Inventory’ Disclaimer in Appendix. All location numbers are net
4. Includes Belly River, Second White Specs, Viking, Glauconite, Ellerslie/Rock Creek, and Duvernay locations.
wells, rounded to the nearest whole number.PEACE RIVER ARCH ASSETS
Toe Hold Position in an Attractive Oil Weighted Fairway
▪ Located in the prolific Peace River Arch light oil fairway
▪ The Charlie Lake is a semi-conventional light oil play
delivering top-tier well economics (at US$50/bbl WTI or
higher) through horizontal drilling and multi-stage
fracturing
Gordondale
▪ Over 24,000 acres (~17,500 net) of Charlie Lake rights
▪ Highly prospective acreage position adjacent to proven
trend
Valhalla
▪ 60+ Upper and Lower Charlie Lake unrisked drilling Rycroft
locations identified at both Rycroft and Gordondale (1)
▪ 100% WI Gas Plant with 16 mmcf/d capacity
▪ Asset amenable to SPARTAN industry-leading, low-cost
operating model and high capital efficiency
Legend (Charlie Lake Rights)
Spartan Delta Corp. Longshore Resources Upr CHLK HZ Upr CHLK Fairway
Tourmaline Oil Rising Star Resources Lwr CHLK HZ Lwr CHLK Fairway
Kelt Exploration Canadian Natural Resources
CHLK Prod/Inj
Anegada Oil Held Charlie Lake Rights
Whitecap Resources
Velvet
January 6, 2021 19
1. See ‘Reserves Disclosure’ ‘Drilling Locations / Inventory’ Disclaimer in Appendix.SPARTAN ENERGY – SPARTAN OIL – SPARTAN EXPLORATION
Western Canada’s Best-in-Class Performer: Proven Low-Cost Operator
▪ From 2010 through 2018, Spartan assembled and developed
multiple high-quality assets throughout Central & Southern
Alberta and Southeast Saskatchewan
▪ Through infill horizontal development drilling and its
application of multi-stage frac technology, Spartan unlocked
significant resource potential in both light and tight oil plays
▪ Developed a deep inventory of highly economic light oil drilling
locations and waterflood projects capable of delivering
sustainable growth and free cash flow
▪ Focused capital on high quality, long life, operated, multi-zone
potential with existing infrastructure and capacity
▪ Spartan Exploration: grew production from ~400 boe/d to
~2,500 boe/d and sold to Penn West, outperforming the TSX
Energy Index by ~90%
▪ Spartan Oil: sold to Bonterra for ~$480 million in 2013 after
growing production to >4,000 boe/d
▪ Spartan Energy: sold to Vermilion Energy for C$1.4 billion in
2018 at a production of level of 23,000 boe/d and
independently evaluated P+P reserves of 113.5 MMBoe
January 6, 2021 20THE SPARTAN DOMESTIC ADVANTAGE
Domestic Operational Track Record
From 2014 to its sale to Vermilion Energy, Spartan Energy Management’s ability to acquire and efficiently integrate assets
established itself as the lowest cost operator in the Southeast has been proven through past transaction activity
Saskatchewan area
▪ Average DCET costs for Mississippian wells below area peers at ▪ Management steadily reduced operating costs following two
$750k separate “acquisition cycles”
▪ Strong relationships with key service providers are intact and ▪ Spartan Energy completed 11 transactions (asset and corporate)
ensure efficiencies through preferential rates and pre-existing in just under a four-year time frame, more than any other
personnel corporation in the basin
Mississippian DCET Capex ($000’s)(1) Spartan Energy - Operating Costs ($/boe)
$1,200 $22.00
$1,000 Acquisition OPEX
$1,000 $900 $920 $20.00
$800 $750 $18.00
$600 $16.00
$400 $14.00
$200 $12.00
$0 $10.00
Spartan Energy Company 1 Company 2 Company 3 Q2 Q3 Q4 Q1 Q2 Q3 Q4 Q1 Q2 Q3 Q4 Q1 Q2 Q3 Q4 Q1
(1) Peer group includes Vermilion, TORC, and Crescent Point 2014 2015 2016 2017 2018
January 6, 2021 21SPARTAN ENERGY
263% Total Return and 33% CAGR | December 2013 – May 2018
Overview Relative Performance (Indexed to 100)
300
• Spartan Energy completed the recapitalization of Alexander Energy Spartan
in December 2013 and shortly after acquired Renegade Petroleum TSX Energy Post-recapitalization,
in March 2014 250 Spartan consistently
outperformed the TSX
Energy Index
• Over a 4-year period, management grew production from ~650 200
boe/d to ~22,750 boe/d through an acquisition and development
strategy
150
• During a period of significant uncertainty in the energy markets,
100
management stewarded capital efficiently and delivered above
market shareholder returns
50
Dec-13 Jun-14 Dec-14 Jun-15 Dec-15 Jun-16 Dec-16 Jun-17 Dec-17
Production Growth Cash Flow Growth
25,000 150.0 $60.0 $0.60
Cash Flow Per Share ($/mmsh.)
20,000 120.0
Production Per Share
Production (boe/d)
Cash Flow ($mm) $40.0 $0.40
(boe/d/mmsh.)
15,000 90.0
10,000 60.0
$20.0 $0.20
5,000 30.0
0 0.0 $0.0 $0.00
Q2 Q3 Q4 Q1 Q2 Q3 Q4 Q1 Q2 Q3 Q4 Q1 Q2 Q3 Q4 Q1 Q2 Q3 Q4 Q1 Q2 Q3 Q4 Q1 Q2 Q3 Q4 Q1 Q2 Q3 Q4 Q1
2014 2015 2016 2017 2018 2014 2015 2016 2017 2018
Cash Flow Cash Flow per Share
Total Production Production per Share
January 6, 2021 22HISTORICAL EV/DACF MULTIPLE COMPARISON
Spartan Energy Corp. vs Premium Light Oil Peers (1)
16.0x
Spartan Energy Corp.
Light Oil Peer Avg. (2)
14.0x The Spartan management team has
historically traded at, or above, the premium
light oil company average multiple (1).
12.0x
Fwd EV/NTM DACF Multiple (x)
10.0x
8.0x
6.0x
Light Oil Peer Avg.
4.0x
2.0x
Source: Factset Consensus Estimates (-)
January 6, 2021 23
1. Light Oil Peer Avg. includes: CPG, ERF, RRX, SGY, TOG, TVE, WCP
2. Comparable EV/NTM DACF period subject to Factset broker estimate availability (May 9, 2014 to the close of the acquisition of
Spartan Energy Corp. by Vermilion Energy Inc. on May 28, 2018)SPARTAN OIL
268% Total Return and 128% CAGR | June 2011 – January 2013
Overview Relative Performance (Indexed to 100)
250
• Formed through the spin-out of certain Cardium assets and SE Spartan
As a public company, Spartan
Saskatchewan assets from Spartan Exploration TSX Energy outperformed the TSX Energy
Index by ~130%
200
• Spartan continued to consolidate its position in the Pembina
Cardium, where it successfully built a large contiguous land
position and drilled 80 gross wells with 100% success rate
150
• In less than two years, Spartan Oil grew production per share
>500% and cash flow per share >1,000%
100
• Announced its sale to Bonterra in December 2012 at top decile
metrics
50
Jun-11 Sep-11 Dec-11 Mar-12 Jun-12 Sep-12 Dec-12
Production Growth Cash Flow Growth
5,000 60.0 $25.0 $0.30
Cash Flow Per Share ($/mmsh.)
4,000 48.0 $20.0 $0.24
Production Per Share
Production (boe/d)
Cash Flow ($mm)
(boe/d/mmsh.)
3,000 36.0 $15.0 $0.18
2,000 24.0 $10.0 $0.12
1,000 12.0 $5.0 $0.06
0 0.0 $0.0 $0.00
Q2 Q3 Q4 Q1 Q2 Q3 Q4 Q2 Q3 Q4 Q1 Q2 Q3 Q4
2011 2012 2011 2012
Production Production per Share Cash Flow Cash Flow per Share
January 6, 2021 24SPARTAN EXPLORATION
573% Total Return and 80% CAGR | January 2010 – May 2011
Overview Relative Performance (Indexed to 100)
250
• Spartan Exploration was formed in Q1-2008 with a view of Spartan
targeting tight oil resources plays in western Canada
TSX Energy As a public company,
Spartan outperformed the
200 TSX Energy Index by ~90%
• Spartan accumulated Cardium, Bakken and Shaunavon assets
throughout 2008 and 2010 followed by a reverse takeover (RTO)
recap transaction of a TSX listed shell company
150
• From the RTO transaction in Q1-2010 to its sale in Q1-2011,
Spartan grew production from ~400 boe/d to ~2,500 boe/d 100
delivering production per share growth of >425% and cash flow per
share growth of >650%
50
Jan-10 Apr-10 Jul-10 Oct-10 Jan-11 Apr-11
Production Growth Cash Flow Growth
3,000 90.0 $14.0 $0.35
Cash Flow Per Share ($/mmsh.)
2,500 75.0 $12.0 $0.30
Production Per Share
Production (boe/d)
Cash Flow ($mm)
$10.0 $0.25
(boe/d/mmsh.)
2,000 60.0
$8.0 $0.20
1,500 45.0
$6.0 $0.15
1,000 30.0
$4.0 $0.10
500 15.0 $2.0 $0.05
0 0.0 $0.0 $0.00
Q1 Q2 Q3 Q4 Q1 Q1 Q2 Q3 Q4 Q1
2010 2011 2010 2011
Production Production per Share Cash Flow Cash Flow per Share
January 6, 2021 25DISCLAIMER
Forward Looking Statements. Certain information included in this presentation constitutes respect to exploration or development projects or capital expenditures. Production forecasts are
forward-looking information under applicable securities legislation. Forward looking information directly impacted by commodity prices and the actual timing of our capital expenditures. Actual
typically contains statements with words such as "anticipate", "believe", "expect", "plan", results may vary materially from forecasts due to changes in interest rates, oil differentials,
"intend", "estimate", "propose", "project" or similar words suggesting future outcomes or exchange rates and the timing of expenditures and production additions. In addition, Spartan
statements regarding an outlook. Forward-looking information in this presentation may include, cautions that current global uncertainty with respect to the spread of the COVID-19 virus and its
but is not limited to, statements about: corporate strategy, objectives, strengths and focus of effect on the broader global economy may have a significant negative effect on Spartan. While the
Spartan; the intentions of management and Spartan with respect to its growth strategy and precise impact of the COVID-19 virus on Spartan remains unknown, rapid spread of the COVID-19
business plan; Spartan’s expectations regarding its 2020/2021 drilling program, including the virus may have a material adverse effect on global economic activity, and can result in volatility
location of wells, scheduled drilling dates and the timing of expected pay out from such wells; and disruption to global supply chains, operations, mobility of people and the financial markets,
Spartan's intentions to maintain balance sheet flexibility to allow Spartan to take advantage of which could affect interest rates, credit ratings, credit risk, inflation, business, financial conditions,
future opportunities; Spartan plans to deliver strong operational performance and reduce debt results of operations and other factors relevant to Spartan. Please refer to the Spartan's most
through free funds flow generation; Spartan’s production forecasts; Spartan's cost-cutting recent Annual Information Form and MD&A for additional risk factors relating to Spartan, which
measures and the results thereof; Spartan's ESG initiatives; Spartan's capital expenditure budget can be accessed either on Spartan's website at www.spartandeltacorp.com or under the
and plans, and its ability to fund capital expenditures through operating activities; Spartan's Company's profile on www.sedar.com. Readers are cautioned not to place undue reliance on this
position to withstand future commodity price volatility and expectations regarding challenging forward-looking information, which is given as of the date hereof, and to not use such forward-
long-term market conditions; the continuation of Spartan’s strategic partnerships, and expected looking information for anything other than its intended purpose. Spartan undertakes no
benefits therefrom. Statements relating to "reserves" are also deemed to be forward looking obligation to update publicly or revise any forward-looking information, whether as a result of
statements, as they involve the implied assessment, based on certain estimates and assumptions, new information, future events or otherwise, except as required by law.
that the reserves described exist in the quantities predicted or estimated and that the reserves
can be profitably produced in the future. The forward-looking information contained in this presentation is made as of the date hereof and
Spartan undertakes no obligation to update publicly or revise any forward-looking information,
The forward-looking statements contained in this presentation are based on certain key whether as a result of new information, future events or otherwise, unless required by applicable
expectations and assumptions made by Spartan, including expectations and assumptions securities laws. The forward looking information contained in this presentation is expressly
concerning the performance of Spartan’s management team and board, the success of future qualified by this cautionary statement.
drilling, development and completion activities, the performance of existing wells, the
performance of new wells, the availability and performance of facilities and pipelines, the FOFI: This presentation contains future-oriented financial information and financial outlook
geological characteristics of Spartan’s properties, the successful application of drilling, completion information (collectively, "FOFI") about Spartan's prospective results of operations, production,
and seismic technology, prevailing weather and break-up conditions and access to drilling working capital, enterprise value, recycle ratio, payout, operating netback, share price, investment
locations, commodity prices, price volatility, price differentials and the actual prices received for yield, net debt, cash flow, free cash flow, NPV10, IRR, EUR, return of capital, operating costs, cost
products, royalty regimes and exchange rates, the application of regulatory and licensing reductions and components thereof, all of which are subject to the same assumptions, risk
requirements, the availability of capital, labour and services, Spartan’s ability to complete planned factors, limitations and qualifications as set forth in the above paragraphs. FOFI contained in this
capital expenditures within budgeted cost estimates, the ability to market oil and gas successfully, presentation was approved by management of the date of this presentation and was provided for
Spartan’s ability to integrate assets and employees acquired through acquisitions and the the purpose of providing further information about Spartan's anticipated future business
creditworthiness of industry partners. operations. Spartan disclaims any intention or obligation to update or revise any FOFI contained in
this presentation, whether as a result of new information, future events or otherwise, unless
Although Spartan believes that the expectations and assumptions on which the forward-looking required pursuant to applicable law. Readers are cautioned that the FOFI contained in this
statements are based are reasonable, undue reliance should not be placed on the forward-looking presentation should not be used for purposes other than for which it is disclosed herein.
statements because Spartan can give no assurance that they will prove to be correct. Since
forward-looking statements address future events and conditions, by their very nature they Third Party Information: Certain information contained herein has been obtained from published
involve inherent risks and uncertainties. Actual results could differ materially from those currently sources prepared by independent industry analysts and third-party sources (including industry
anticipated due to a number of factors and risks. These include, but are not limited to, stock publications, surveys and forecasts). While such information is believed to be reliable for the
market volatility, risks associated with the oil and gas industry in general (e.g., operational risks in purpose used herein, none of the directors, officers, owners, managers, partners, consultants,
development, exploration and production; the uncertainty of reserve estimates; the uncertainty shareholders, employees, affiliates or representatives assumes any responsibility for the accuracy
of estimates and projections relating to production, costs and expenses and health, safety and of such information. Some of the sources cited in this presentation have not consented to the
environmental risks), incorrect assessment of the value of acquisitions, failure to complete or inclusion of any data from their reports, nor has Spartan sought their consent.
realize the benefits of acquisitions, constraint in the availability of services, commodity price and
exchange rate fluctuations, actions of OPEC and OPEC+ members, changes in legislation (including
but not limited to tax laws, royalty regimes and environmental legislation), adverse weather or
break-up conditions and uncertainties resulting from potential delays or changes in plans with
January 6, 2021 26DISCLAIMER CONT’D
Oil and Gas Advisories used by InSite for Bellatrix’s most recent independent reserves evaluation as of December 31,
2019 may have different estimated ultimate recovery than the type curves upon which the
BOE Disclosure. The term barrels of oil equivalent (“boe”) may be misleading, particularly if used economics presented herein are based; however, this is expected as Insite’s estimates are
in isolation. A BOE conversion ratio of six thousand cubic feet of natural gas to barrels of oil primarily based on only historical results whereas Spartan’s Management Internal Forecast type
equivalence is based on an energy equivalency conversion method primarily applicable at the curves utilize historical results and analogous information to provide an estimate of productivity
burner tip and does not represent a value equivalency at the wellhead. All BOE conversions in this and reserves in the future. Management Internal Forecast curves incorporate the most recent
presentation are derived from converting gas to oil in the ratio mix of six thousand cubic feet of data from actual well results and would only be representative of the specific drilled locations.
gas to one barrel of oil. There is no guarantee that Spartan will achieve the estimated or similar results derived therefrom.
References to “oil” in this presentation include crude oil and condensate. References to “natural
gas liquids” or “NGLs” include pentane, butane, propane, and ethane. References to “liquids” Drilling Locations / Inventory. This presentation discloses drilling inventory in three categories: (a)
includes oil and NGLs. References to “gas” relates to natural gas. proved locations; (b) probable locations; and (c) unbooked/potential locations. Proved locations
and probable locations are derived from: (a) the reserves evaluation prepared by InSite for
National Instrument 51-101 – Standards of Disclosure for Oil and Gas Activities includes Bellatrix effective December 31, 2019; and (b) the reserves evaluation prepared by Sproule
condensate within the product type of “natural gas liquids”. Spartan has disclosed condensate Associates Limited for Spartan effective December 31, 2019, both in accordance with NI 51-101
sales separate from natural gas liquids because the value equivalency of condensate is more and the COGE Handbook and account for drilling locations that have associated proved and/or
closely aligned with crude oil. The Company believes the presentation of condensate as disclosed probable reserves, as applicable. Unbooked locations are internal estimates based on the
herein provides a more accurate representation of operations and results therefrom. prospective acreage of the Assets and an assumption as to the number of wells that can be drilled
per section based on industry practice and internal review. Unbooked locations do not have
Reserves Disclosure. All reserves information in this presentation was prepared by InSite for attributed reserves or resources. Of the 637 identified net drilling locations identified within the
Bellatrix effective December 31, 2019 using InSite’s December 31, 2019 forecast prices and costs in Assets (slide 17, 18), 220.6 are net proved locations, 74.9 are net probable locations and 340 are
accordance with National Instrument 51-101 – Standards of Disclosure of Oil and Gas Activities net potential unbooked locations. Vertical locations in the Cardium, Edmonton, McLaren, Rock
(“NI 51-101”) and the Canadian Oil and Gas Evaluation Handbook (the “COGE Handbook”). All Creek, along with 2.0 net Rock Creek horizontal locations have been removed from the booked
reserve references in this press release are “Company gross reserves”. Company gross reserves well count due to Spartan having uncertainty of their economic viability. Of the 60+ identified
are the Company’s total working interest reserves before the deduction of any royalties payable locations on slide 19, 6.0 net are proved locations, 5.0 net are probable locations and 49.0 net are
by the Company and before the consideration of the Company’s royalty interests. It should not be unbooked potential locations. Unbooked locations have been identified by management as an
assumed that the present worth of estimated future cash flow of net revenue presented herein estimation of our multi‐year drilling activities based on evaluation of applicable geologic, seismic,
represents the fair market value of the reserves. There is no assurance that the forecast prices and engineering, production and reserves information. There is no certainty that the Company will drill
costs assumptions will be attained and variances could be material. The recovery and reserve all unbooked drilling locations and if drilled, there is no certainty that such locations will result in
estimates of Spartan’s crude oil, NGLs and natural gas reserves provided herein are estimates only additional oil and gas reserves, resources or production. The drilling locations on which we
and there is no guarantee that the estimated reserves will be recovered. Actual crude oil, natural actually drill wells will ultimately depend upon the availability of capital, regulatory approvals,
gas and NGLs reserves may be greater than or less than the estimates provided herein. seasonal restrictions, oil and natural gas prices, costs, actual drilling results, additional reservoir
information that is obtained and other factors. While certain of the unbooked drilling locations
Original Oil In Place (“OOIP”) is that quantity of petroleum that is estimated to exist originally in being de‐risked by drilling existing wells in relative close proximity to such unbooked drilling
naturally occurring accumulations. It includes that quantity of petroleum that is estimated, as of a locations, other unbooked drilling locations are farther away from existing wells where
given date, to be contained in known accumulations, prior to production, plus those estimated management has less information about the characteristics of the reservoir, and therefore, there
quantities in accumulations yet to be discovered. is more uncertainty whether wells will be drilled in such locations. If these wells are drilled, there
is more uncertainty that such wells will result in additional oil and gas reserves, resources or
Original Gas In Place (“OGIP”) is that quantity of gas that is estimated to exist originally in naturally production.
occurring accumulations. It includes that quantity of gas that is estimated, as of a given date, to be
contained in known accumulations, prior to production, plus those estimated quantities in US Disclaimer. This presentation is not an offer of the securities for sale in the United States. The
accumulations yet to be discovered. securities have not been registered under the U.S. Securities Act of 1933, as amended, and may
not be offered or sold in the United States absent registration or an exemption from registration.
Type Curves. - The reservoir engineering and statistical analysis methods utilized is broad and can This presentation shall not constitute an offer to sell or the solicitation of an offer to buy nor shall
include various methods of technical decline analyses, and reservoir simulation all of which are there be any sale of the securities in any state in which such offer, solicitation or sale would be
generally prescribed and accepted by the COGE Handbook and widely accepted reservoir unlawful.
engineering practices. These type curves were generated internally and validated by our internal
qualified reserves evaluator. Such type curves do not necessarily reflect the type curves used by
our independent qualified reserves evaluator in estimating our reserves volumes. The type curves
January 6, 2021 27DISCLAIMER CONT’D & KEY PERFORMANCE INDICATORS
Non-GAAP Financial Measures and Other Key Performance Indicators “Free Funds Flow (FCF)” is calculated as Funds Flow less exploration and development capital
This presentation contains certain financial measures, as described below, which do not have expenditures. “Free Funds Flow per Share” is calculated as the Free Funds Flow divided by the
standardized meanings prescribed by IFRS or Generally Accepted Accounting Principles (“GAAP”). number of common shares outstanding divided by the current share price. Other Key
As these non-GAAP financial measures are commonly used in the oil and gas industry, the Performance Indicators
Company believes that their inclusion is useful to investors. The reader is cautioned that these
amounts may not be directly comparable to measures for other companies where similar Capital Efficiency: Capital efficiency is the amount spent to add an additional barrel a day of
terminology is used. The non-GAAP measures used in this release, represented by the capitalized production to a company’s annual exit production.
and defined terms outlined below, are used by Spartan as key measures of financial performance EUR: Estimated Ultimate Recovery (“EUR”) approximates the quantity of oil or gas that is
and are not intended to represent operating profits nor should they be viewed as an alternative to potentially recoverable or has already been recovered from a reserve or well. EUR is not a defined
cash provided by operating activities, net income or other measures of financial performance term within the COGE Handbook and therefore any reference to EUR in this Presentation is not
calculated in accordance with IFRS. deemed to be reported under the requirements of NI 51-101. Readers are cautioned that there is
no certainty that the Company will ultimately recover the estimated quantity of oil or gas from
“Operating Income (Loss)” abbreviated as “NOI” is calculated by deducting operating and such reserves or wells.
transportation expenses from total revenue, after realized gains or losses on commodity price
derivative financial instruments. Total revenue is comprised of oil and gas sales, net of royalties, EV/DACF: is the enterprise value divided by the debt adjusted cash flow and is used as a
plus processing and other revenue. The Company refers to Operating Income (Loss) expressed per measurement of the value of the company.
unit of production as an “Operating Netback”.
Finding and development (“F&D”) cost: is the sum of capital expenditures incurred in the period
“Funds from Operations” is calculated as cash provided by (used in) operating activities before and the change in future development capital (“FDC”) required to develop reserves. F&D cost per
changes in non-cash working capital. BOE is determined by dividing current period net reserve additions into the corresponding
period’s F&D cost. Readers are cautioned that the aggregate of capital expenditures incurred in
“Adjusted Funds from Operations” is calculated by adding back transaction costs on acquisitions the year, comprised of exploration and development costs and acquisition costs, and the change
and settlements of decommissioning obligations to Funds from Operations. Adjusted Funds from in estimated FDC generally will not reflect total FD&A costs related to reserves additions in the
Operations can also be calculated by deducting general and administrative and interest expenses year.
(net of interest income) from Operating Income (Loss). Spartan’s “Corporate Netback” is equal to
IRR: Internal rate of return (“IRR”) is the discount rate required to arrive at an NPV equal to zero.
Adjusted Funds from Operations expressed per unit of production.
Rates of return set forth in this Presentation are for illustrative purposes. There is no guarantee
that such rates of return will be achieved in the future.
“Adjusted Funds from Operations per Share” is calculated on a consistent basis with net income
(loss) per share, using basic and diluted weighted average common shares as determined in
accordance with IFRS. IP90: The initial production from a well for the first 2,160 hours (90 days) based on
operating/producing hours.
“Funds Flow” is calculated by deducting payments on lease liabilities from Funds from Operations.
“Adjusted Funds Flow” is calculated by adding back transaction costs on acquisitions to Funds NPV10: the anticipated net present value of the future net operating income after capital
Flow. expenditures, discounted at a rate of 10% (before tax).
Recycle Ratio: is a measure for evaluating the effectiveness of a company’s re-investment
“Net Debt (Surplus)” throughout this presentation, references to “Net Debt” include bank debt, program. The ratio measures the efficiency of capital investment by comparing the operating
net of Adjusted Working Capital. “Adjusted Working Capital” is calculated as current assets less netback per BOE to F&D cost per BOE.
current liabilities, excluding derivative financial instrument assets and liabilities and lease
liabilities. As at September 30, 2020, the Adjusted Working Capital surplus includes cash and cash Sustaining / Maintenance Capital: is the estimated capital required to bring on new production
equivalents, accounts receivable, prepaid expenses and deposits, accounts payable and accrued which offsets the natural decline of the existing production and keeps the year-over-year
liabilities and the current portion of decommissioning obligations. Spartan uses “Net Debt” as a production flat.
measure of the Company’s financial position and liquidity, however it is not intended to be viewed
as an alternative to other measures calculated in accordance with IFRS. “Proactive Asset Retirement Capital” is the amount required to maintain compliance with
regulator mandated asset retirement of the Company’s inactive asset base.
“Enterprise value” is calculated as the Market Capitalization of the Company plus Net Debt, where Production per common share (PPS): is calculated by dividing total production by the basic
“Market Capitalization” is defined as the total number of common shares outstanding multiplied weighted average number of common shares outstanding, as determined in accordance with IFRS.
by the price per share at a given point in time.
January 6, 2021 28PRICE DECK DETAILS
Budget Pricing
All guidance, forecasts and economics are based on the following budget price deck (unless otherwise stated):
Q4/20E 2021E 2022E 2023E+
AECO Gas C$/GJ $2.75 $2.75 $2.50 $2.25
WTI Oil US$/bbl $45.00 $45.00 $45.00 $45.00
Edmonton Cond Differential US$/bbl $2.00 $2.00 $2.00 $2.00
Edmonton Condensate C$/bbl $56.76 $56.76 $56.76 $56.76
Edmonton Oil Differential US$/bbl $4.00 $4.00 $4.00 $4.00
Edmonton Oil C$/bbl $54.12 $54.12 $54.12 $54.12
Conway Propane US$/Gal $0.50 $0.50 $0.50 $0.50
FX US$/C$ 1.32 1.32 1.32 1.32
Additional Notes on Spartans Average Realized Pricing:
• Ethane priced on AECO plus approximately C$ 1.20/GJ
• Propane priced at Conway minus approximately $US 0.29/GAL
• Butane priced at 45% of WTI minus approximately C$ 3.80/bbl
• Pentane priced on Edmonton Condensate minus approximately C$3.80/bbl
January 6, 2021 29ABBREVIATIONS
AECO Alberta Energy Company “C” Meter Station of the NOVA Pipeline System
ARO Asset Retirement Obligations
b Basic shares outstanding
bbl; bbl/d barrel; barrels per day
bcf; bcf/d Billion cubic feet of natural gas; billion cubic feet per day of natural gas
boe; boe/d Barrels of oil equivalent; barrels of oil equivalent per day
BXE Bellatrix Exploration Ltd.
CCAA Companies' Creditors Arrangement Act (Canada)
cf/d cubic feet per day of natural gas
CO&O Construction, Ownership, and Operating Agreement
DCET Drill, complete, equip and tie-in capital cost
ESG Environmental, Social and Governance
EUR Estimated ultimate recovery (see disclaimers)
EV/DACF Enterprise value divided by the debt adjusted cash flow (see disclaimers)
F&D Finding and development cost per barrel of oil equivalent (see disclaimers)
f.d. Fully diluted shares outstanding
FCF Free Cash Flow (see disclaimers)
FX Exchange rate: US Dollars divided by Canadian Dollars
G&A General and administrative expense
GJ Gigajoules
IFRS International Financial Reporting Standards as issued by the International Accounting Standards Board (“IASB’)
IP90 The average hydrocarbon production rate for the first 90 days of a well's life
IRR Internal rate of return percentage (see disclaimers)
LMR Liability Management Rating (Alberta)
M or m Thousand
MM or mm Million
NGLs Natural Gas Liquids
NOI Net Operating Income (see disclaimers)
NPV10 Net Present Value with a discount rate of 10% (see disclaimers)
PDP Proved Developed Producing Reserves
SDE Trading symbol for Spartan Delta Corp. common shares on the TSX Venture Exchange
TP Total Proved Reserves
TV Total Value or Total Net Consideration
WTI West Texas Intermediate Oil Price (US$/bbl)
January 6, 2021 30Info@SpartanDeltaCorp.com www.SpartanDeltaCorp.com
You can also read