Australia's Offshore Industry: A Half-Century Snapshot - IEEFA
←
→
Page content transcription
If your browser does not render page correctly, please read the page content below
Bruce Robertson, LNG/Gas Analyst                                                       1
Milad Mousavian, Energy Analyst
September 2021

Australia’s Offshore Industry:
A Half-Century Snapshot
Analysis of the Government’s Administrative
Role, Key Players’ Behaviour and the Looming
Risks for the Sector
Executive Summary
On a global scale, Australia’s identified offshore gas resources are about 3 times
larger than its remaining onshore resources identified so far. Australia could
produce conventional gas for the next 42 years, according to Geoscience Australia,
based on 2019 production rate from its currently identified conventional gas fields.
93% of these identified conventional gas fields are located in offshore western
Australia.

In reality however, gas reserves cannot be developed if we are to maintain a stable
climate. The world has less than 3 decades to reach net zero emissions according to
both the International Energy Agency’s (IEA) flagship “Net-Zero by 2050” report
which urges zero new spending on oil and gas projects globally, and the
Intergovernmental Panel on Climate Change (IPCC) report which concludes global
emissions must reduce by 45% by 2030 to avoid catastrophic climate collapse.

Australia took the crown from Qatar as the largest liquefied natural gas (LNG)
exporter in the world in 2019, exporting 77.5 million tonnes with around 70%
supplied by offshore gas.

The Federal government has actively
backed the offshore oil and gas industry
since the start of the LNG boom in late
2000s, with 13 exploration titles granted         The government
in 2019 alone - the highest number issued
                                               has issued significantly
in the last decade. In the next 6 years,
AUD5.1 billion will be spent by companies     more titles for exploration
on offshore exploration activities in an          than production
area around 154,000km2 wide, based on              in recent years.
work-bid data submitted to the National
Offshore Petroleum Titles Administrator
(NOPTA).

Oil and gas companies, on the other hand, have drilled twice as many production
wells than exploration wells. These counterintuitive dynamics could be due to the
fact that many companies prefer to focus on definite resources they have already
explored rather than investment on risky exploration projects, despite government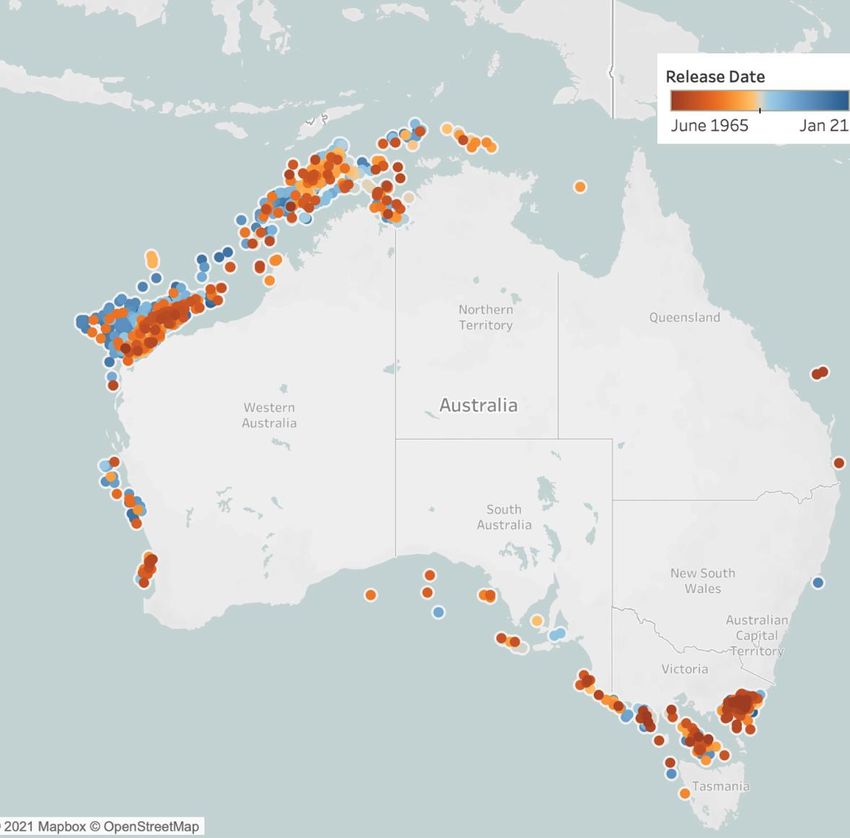
Australia’s Offshore Industry:
A Half-Century Snapshot                                                                  2

encouragement. They are constrained by their balance sheets as they have written
off billions of dollars over the last decade on gas assets.

The top 10 biggest companies that have the highest level of involvement in
Australia’s offshore sector are Australia’s oil and gas icons Woodside, Santos and
BHP along with the major multi-national incumbents ExxonMobil, Chevron, Shell
and BP, followed by Japanese giants Mitsui, Mitsubishi and INPEX.

Of this, the top 4 operators are
ExxonMobil, Woodside, Chevron and
Santos. Together they operate 222 of the
373 existing offshore permits. While
ExxonMobil and Woodside’s focus is on            AUD5.1 billion will be
the established side of the business,
controlling 51% of the production and            spent in the offshore
pipeline licences together, Chevron and          exploration projects
Santos as younger offshore players have           in the next 6 years.
invested more in pre-production and
exploration activities, acquiring 41% of
all exploration permits and retention
leases as operator partners.

Of AUD5.1 billion in Australia’s offshore exploration expenditure to be spent in the
next 6 years, Santos operates the most expensive projects collectively with AUD1.3
billion in expenditure. Chevron is next with AUD430 million, followed by Shell with
AUD336 million. INPEX and BP complete the top-5 list, each being the operator of
exploration projects costing more than AUD220 million.

Five Growing Risks in Australia’s Offshore Sector
Despite the growing number of offshore exploration permits and development
projects and their prospective expenditures, IEEFA has identified 5 major risks
specifically confronting Australia’s offshore sector.

    1. Australia’s biggest LNG customer, Japan, is aiming to halve the LNG
       share in its electricity mix by 2030.
        There has been a massive global energy policy shift, particularly from Japan
        as Australia’s biggest LNG customer. Aiming for a near 50% reduction in
        LNG in its 2030 power generation mix, Japan will no longer be as LNG-
        thirsty as it used to be. This is a real threat for Australian LNG exports,
        especially considering the likely domino effect of Japan’s ambitious policy on
        other southeast Asian nations like South Korea.

    2. Advanced satellite-based emission tracking systems have recently
       detected enormous methane leakages in remote offshore areas.
        The emergence of advanced satellite-based emission tracking systems is
        providing data previously unknown or under reported, including the recent
        detection of enormous methane leakages in remote offshore areas. This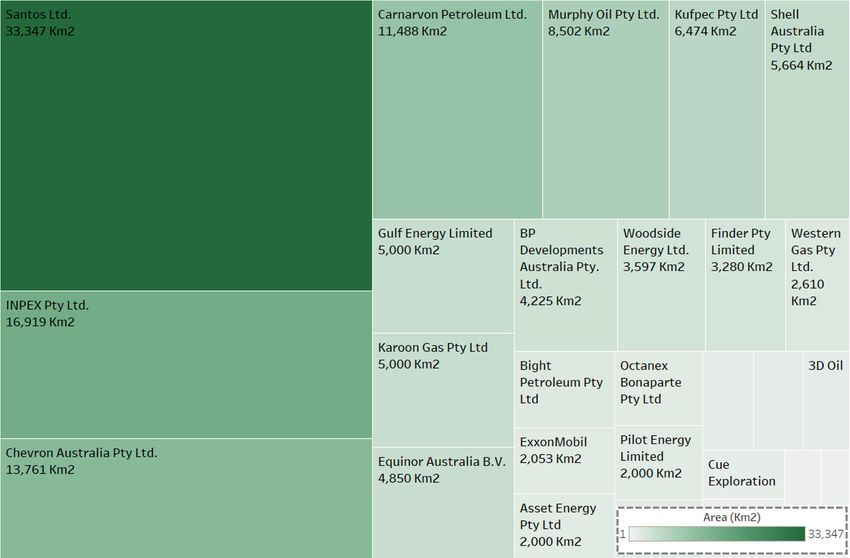
Australia’s Offshore Industry:
A Half-Century Snapshot                                                                  3

        poses a serious threat to the social license of oil and gas companies and
        brings into question the validity of new industry terms such as ‘carbon-
        neutral LNG’. It also increases the risk facing bankers and investors in
        financing such projects, particularly as more stringent carbon emission
        regulations become adopted globally.

    3. Financing offshore projects are riskier as companies have lost their
       ability to sell down interest with partners being unwilling to commit.
        Another risk previously ignored is the changing profile of partners in joint
        ventures. Big oil and gas companies have lost their ability to sell down
        interest in billion-dollar projects due to partners being unwilling to commit.
        Large stakes in projects have made the cost of financing big projects higher.
        Financial institutions are more likely to consider higher interest rates for a
        project with one or two partners, compared to a project with several
        partners.

    4. Offshore well depths have been rapidly increasing, exponentially
       inflating the capex of projects.
        Based on data from 700 offshore wells, IEEFA notes that the average total
        depth of wells has increased by around 600 meters (20%) during the LNG
        boom (2009-2019). According to the scientific research, deeper drilling
        leads to an exponential rise in costs, even with the deployment of advanced
        and more efficient drilling technologies.

    5. LNG contracts have become shorter and more flexible due to the
       uncertain future of the LNG market.
        The current wave of country policy initiatives abandoning gas has led to
        customers migrating from rigid long-term (20-30 year) contracts to shorter
        ones (typically 10-15 years) with more flexible conditions including the
        ability to resell cargos in case of glut. As a result, there is now a lack of
        certainty that there will be enough demand for LNG cargos over the next 20-
        30 years, increasing investment risk and consequently the cost of financing.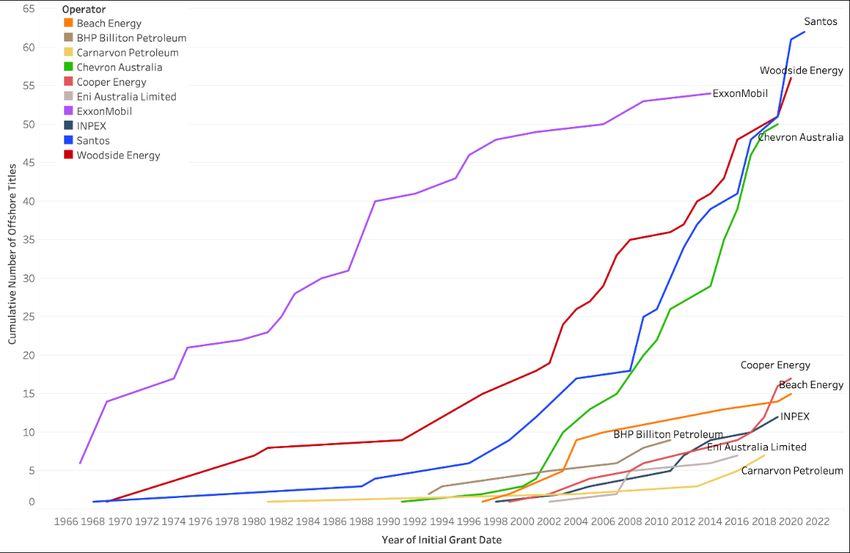
Australia’s Offshore Industry:
A Half-Century Snapshot                                                                                                                                 4

 Table of Contents
 Executive Summary .............................................................................................................................. 1
       Five Growing Risks in Australia’s Offshore Sector ........................................................... 2
 Australia’s Offshore Resources ........................................................................................................ 5
 Offshore vs. Onshore: Cost Structure, Time Horizon and Emissions Profile ................ 7
 History of Offshore Drilling in Australia ...................................................................................... 9
 Offshore Petroleum Titles Analysis ............................................................................................. 11
 The Big 4 Operators and Some Emerging Companies ......................................................... 17
 The Most Involved Companies in the Offshore Sector ........................................................ 20
 Exploration Activity Until 2027 - Area and Cost Analysis ................................................. 21
       Area Under Exploration ............................................................................................................ 21
       Exploration Cost .......................................................................................................................... 23
 Risks Associated with Offshore O&G Projects ........................................................................ 25
 About the Authors .............................................................................................................................. 29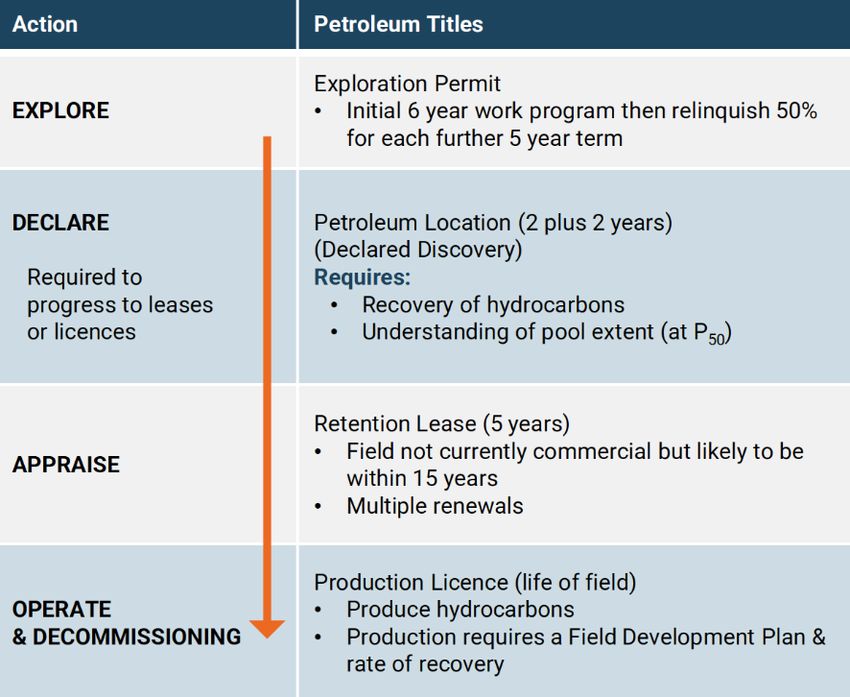
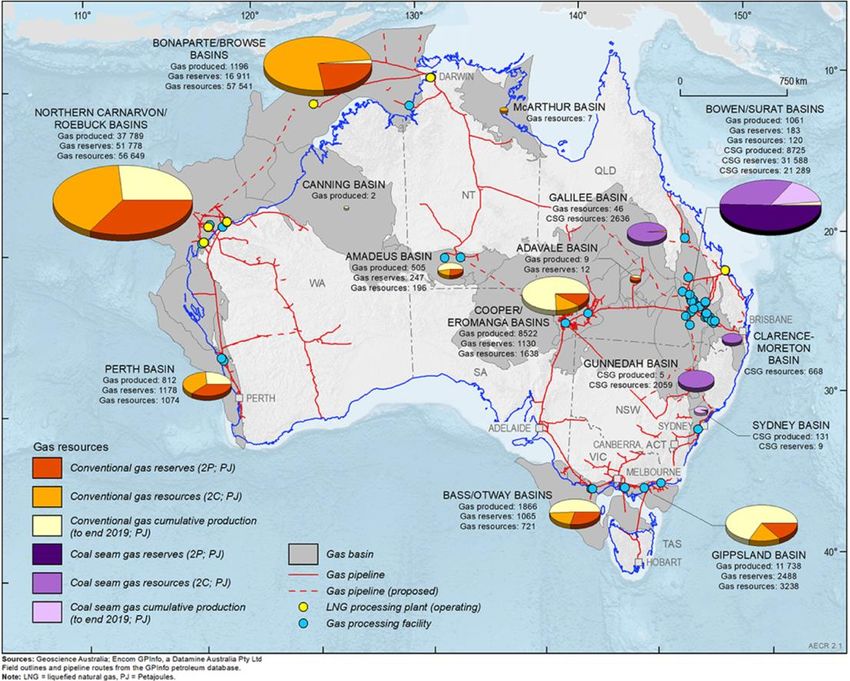
Australia’s Offshore Industry:
A Half-Century Snapshot                                                               5

Australia’s Offshore Resources
In 1965 an ExxonMobil/BHP Billiton joint venture drilled Australia's first offshore
well and discovered the Barracouta gas field in Bass Strait.1 It was the first step
towards Australia’s present day billion-dollar offshore oil and gas industry.

After the LNG boom in the late 2000’s, although exploration and production of
onshore coal seam gas (CSG) skyrocketed, offshore hydrocarbon deposits still
outweighed onshore reserves by a considerable margin (Figure 1).

The remaining deposit discovered in the north Carnarvon Basin in the north-
western shelf offshore western Australia is larger than the country’s whole onshore
proven oil and gas reserves, according to data published in 2019 by Geoscience
Australia. Coupled with this, the nearly untouched Browse Basin north of Broome
offshore West Australia demonstrates how massive Australia’s offshore resources
are.

Figure 1: Dispersion of Offshore/Onshore Australia’s Hydrocarbon
Resources

Source: Geoscience Australia.2

1   ExxonMobil. Bass Strait. 12 May 2019.
2   Geoscience Australia. Gas.
Australia’s Offshore Industry: A Half-Century Snapshot 6 Oil and gas giants have been investing big in offshore projects, and numerous exploration and production (E&P) and development activities are on track to extract the massive oil, gas and condensates that lie beneath Australia’s coastal and deep waters. There are more than 200,000 petajoules (PJ) of unused offshore reserves in waters off Australia compared to the 65,000PJ of identified onshore sources (Figure 23).4 Australia’s yearly energy consumption in 2019 was just 6,196PJ5, clarifying the magnitude of the remaining oil and gas in the country, especially offshore. Figure 2: Australia’s Offshore / Onshore Hydrocarbon Resources Source: Geoscience Australia,6 IEEFA calculation. About 93% of identified conventional gas resources are located offshore along the North West Shelf of Australia, according to Geoscience Australia. Based on 2019 production rates of 4,641PJ (4.13Tcf), Australia’s identified conventional gas resources would have a life of 42 years if all identified contingencies to development were mitigated.7 3 This figure does not include coal resources and also undiscovered prospective resources (shale gas, tight gas, basin-centred gas, coal bed gas, and deep bed coal gas). The estimate of total potentially recoverable gas resources is much larger than proven resources. 4 These are estimates and not exact numbers as some basins like Perth have both offshore and onshore resources. 5 Department of Industry Science Energy and Resources. Energy consumption. 6 Geoscience Australia. Gas. 7 Geoscience Australia. Gas.
Australia’s Offshore Industry:
A Half-Century Snapshot                                                                   7

Putting aside CSG and probable new explorations, Australia would still have
conventional gas to exploit more than a decade after the landmark climate
milestone of 2050, set by the International Energy Agency (IEA) for countries to
necessarily achieve net-zero.8 The majority of this abundant fossil source is offshore.

Offshore vs. Onshore: Cost Structure, Time Horizon
and Emissions Profile
The offshore oil and gas (O&G) sector differs from the onshore in several ways.

Onshore wells within a basin are often similar in terms of their design and cost
profile, while each offshore project has completely distinct design specifications and
cost profiles. Deepwater development typically takes the form of costly, high-risk,
long-duration projects that are less susceptible to short-term oil price fluctuations.
They have high capital cost and tend to produce almost regardless of the oil price.
Conversely, onshore development is highly correlated to the oil price as the well life
is short and the capital cost is relatively low.

In the onshore sector, drilling equipment and the cost of building infrastructure to
access water, electricity and roads are the two most significant expenses incurred,
while key distinct cost drivers for the offshore sector include drilling equipment and
fleet, water depth, well depth, and distance from the shore.

Drilling in offshore development is a much
larger share of total well costs than in
onshore development, where tangible and
intangible drilling costs typically
represent only about 30% to 40% of total
well costs.9 That is because offshore wells
are generally deeper than onshore wells                     Drilling in offshore
which leads to longer periods of drilling,               development has higher
more complicated technical
                                                           uncertainty than in
considerations, and higher uncertainty as
the drillers go deeper into the seabed.                   onshore development.
These complexities lead to a more
expensive, more complicated, and longer
end-of-life decommissioning phase, as
well as more expensive Plug and
Abandonment (P&A) activities.

“Trouble Costs” - unplanned and unscheduled costs arising during well operations -
can also be different in nature and magnitude in offshore O&G projects. In offshore
well drilling, some extreme weather conditions, fishing activities, hole stability, and
lost circulation problems in the deep layers can increase the probability and
magnitude of trouble costs.

8   IEA. Net Zero by 2050. Revised version. July 2021.
9   EIA. Trends in U.S. Oil and Natural Gas Upstream Costs. March 2016.
Australia’s Offshore Industry:
A Half-Century Snapshot 8
All of these complexities lead to the exponential relationship between the cost and
depth of wells. As offshore wells are generally deeper, the rate of costs rising would
be higher.10 11 12 That explains why before drilling, O&G producers spend years and
massive amounts of money conducting thorough seismological surveys to estimate
the proven and probable reserves accessible for recovery.
On top of the emission-intensive value
chain of O&G projects in general, there are
specific environmental and emission
concerns with offshore projects. These
include, but are not limited to, potential oil
spills and the impact on coastal areas, the
production of thousands of gallons of
waste drilling fluid which has toxic As offshore wells
components, disturbances on marine life
created by seismic surveys, and the threat
are generally deeper,
of endangering bio-diversity.13 The famous the rate of costs rising
“Deep Water Horizon Oil Spill (BP)”14 would be higher.
disaster in April 2010 in the gulf of Mexico
and the more recent “Eye of Fire”
(Pemex)15 disaster in July 2021 show that
the probability of environmental
catastrophes is real in spite of
technological advancements and stringent
regulations.
Tracking methane emissions from offshore oil and gas platforms by satellite has
historically been challenging because of the absorption of sunlight by water, which
skews observations. A new wave of emission tracing technologies specifically
designed for offshore projects (including sealed and abandoned wells) will likely
detect fugitive methane emissions from offshore fleets and wells more precisely.16
Considering the exclusive features of the offshore O&G sector along with the fact
that Australia is a nation with massive offshore resources and a government that is
not yet responsive enough to global pressure to cut emissions, looking at trends,
players and market mechanisms in this sector may be insightful for investors and
10 M. Enamul Hossain. Drilling Costs Estimation for Hydrocarbon Wells. De Gruyter. June 2015.
11 Dalmo S. Amorim Jr., Otto Luiz Alcântara Santos and Ricardo Cabral de Azevedo. A statistical
solution for cost estimation in oil well drilling. International Engineering Journal 72(4):675-683.
October 2019.
12 Gregory Robert Leamon. Petroleum well costs, School of Petroleum Engineering, The University
of New South Wales. 2006.
13 National Resources Defence Council. Protecting Our Ocean and Coastal Economics: Avoid
Unnecessary Risks from Offshore Drilling. September 2009.
14 United States Environmental Protection Agency. Deepwater Horizon – BP Gulf of Mexico Oil
Spill.
15 Reuters. 'Eye of fire' in Mexican waters snuffed out, says national oil company. 3 July 2021.
16 Bloomberg Green. Shell, TotalEnergies Join Satellite Effort to Track Methane. 8 July 2021.Australia’s Offshore Industry: A Half-Century Snapshot 9 decision makers going forward. History of Offshore Drilling in Australia17 The transition from onshore to offshore petroleum exploration had to be postponed until advancements in seismic and drilling technologies were made. In 1959, Woodside (Lakes Entrance) Oil obtained Australia's first offshore exploration licence in the Gippsland Basin. Haematite Explorations undertook the first seismic study of the area in 1962-1963 using state-of-the-art methods to map Australia's initial offshore drilling potential. A joint venture between Esso and BHP drilled Australia's first offshore well in the Gippsland Basin in 1964. In the late 1960s and late 1970s, the Esso BHP joint venture made successive oil and gas discoveries. In May 1971, the drilling ship Ocean Digger discovered the North Rankin field, followed by the Goodwyn field a few months later. Arco found gas in the Bonaparte Basin with their first offshore well. Due to some technological advancement at the time, Shell managed to drill the first well beyond the continental shelf in 256 meters of water in the Arafura Basin in 1971. A series of deep-water wells were drilled in 1979 and 1980 by Esso, Woodside and Phillips in the Carnarvon and Browse basins. Large gas accumulations were encountered in Scarborough-1, North Scott Reef-1 and Gorgon. The remote location delayed development of these deep-water gas discoveries. Then in the 1980s, oil discoveries in the Barrow Sub-Basin revived interest. Meanwhile, the Timor Sea had been receiving a lot of drilling attention. In 2003, Woodside drilled Gnarylknots-1 and -1A in the Great Australian Bight in 1,316 meters of water. The well was abandoned before reaching its objective. High mobilisation costs, high rig rates, weather delays and borehole problems contributed to the final cost of over AUD50 million. This was the most expensive exploration well drilled in Australia at that time. The next wave of drilling started in the late 2000’s, the beginning of the LNG boom in Australia. While Australia has been exporting LNG since the 1980s, the boom began in 2009 with Chevron’s final investment decision in Gorgon, up until 2019 when Shell shipped out the first cargo from Prelude - the world’s biggest floating LNG plant. Chevron became the next big offshore driller after the LNG boom with the Gorgon plant on Western Australia’s Barrow Island - the most expensive LNG project in history at $54 billion. Wheatstone, located in the Carnarvon basin, was Chevron’s other big LNG project. 17Most of the information provided in this section is derived from the Doctoral Thesis written by Gregory Robert Leamon at the School of Petroleum Engineering, University of New South Wales. 2006.
Australia’s Offshore Industry:
A Half-Century Snapshot                                                                    10

INPEX was the next giant to drill in Australia. The Japanese company made the final

investment decision in 2010 on the Ichthys LNG project, estimated to be the second
most expensive LNG plant in Australia.18

All of these LNG plants required massive
gas resources in order to operate at
maximum capacity. To meet this need, the
companies and their partners, as joint
ventures, have been drilling in offshore
basins, an activity undertaken since the
beginning of the AUD200 billion LNG
industry boom.
                                                        Ichthys LNG project
In Figure 3, the spatial historical trend of          is estimated to be the
offshore well drilling in Australia (1965-           second most expensive
2020) has been drawn by IEEFA based on
data provided by National Offshore                   LNG plant in Australia.
Petroleum Information Management
System (NOPIMS). The colour spectrum
shows the date of well drilling. The
browner the colour, the older the date of
drilling. On the other side, darker blues
depict the most recent wells drilled in
Commonwealth offshore waters.

As shown, Victorian shores were among the early targets for O&G exploration and
production with about 1,000 wells drilled in the Gippsland Basin. Western Australia
is the same age as Victoria in terms of drilling activity, however unlike Victoria
whose main hydrocarbon resources are depleting, there has been more oil and gas
discoveries in Western Australia in recent decades, with O&G companies very
optimistic about the Northern Carnarvon and Browse Basin. More than 50% of the
total wells drilled in Australia since 1965 are in these Western Australian basins. In
fact, since 2000, 3 out of 4 wells have been drilled in Western Australia with 92% of
the gas reserves feeding Australia’s multi-billion dollar LNG sector located off the
Western Australian coast in the Bonaparte, Browse, Carnarvon and Perth Basins.19
There are few wells in offshore southern Australia and a recent new wave of well
drilling in the Northern Territory/Western Australia’s Bonaparte basin.

18 Bloomberg. Australia’s $200 Billion LNG Boom Waylaid by Covid and Cracks. 5 September
2020.
19 Australian Government. Australian Trade Commission. Oil and Gas. March 2016.
Australia’s Offshore Industry: A Half-Century Snapshot 11 Figure 3: Spatial-Historical Well Drilling in Australia (1965-2020) Source: NOPIMS.20 Offshore Petroleum Titles Analysis Offshore petroleum and carbon capture and storage (CCS) activities beyond designated state and territory coastal waters (three nautical miles) are governed by the Offshore Petroleum and Greenhouse Gas Storage Act 2006 (OPGGSA) and associated regulations. The legislation provides for petroleum exploration and recovery and sets out a basic framework of the rights, duties, obligations, entitlements and responsibilities of governments and industry. An offshore petroleum title grants the titleholder the right to explore, appraise or develop depending on the title type. The government-led National Offshore Petroleum Titles Administrator (NOPTA) 20 Australian Government. National Offshore Petroleum Information Management System.
Australia’s Offshore Industry:
A Half-Century Snapshot                                                                 12

established in January 2012 is responsible for the day-to-day administration of
petroleum and greenhouse gas titles in Commonwealth waters in Australia. It was
appointed under OPGGSA and is part of the Department of Industry, Science, Energy
and Resources (DISER).

The four main types of titles: exploration permits, retention leases, production
licences and pipeline licences comprise 97% of all titles. (Table 1) Exploration
permits and retention leases (mostly issued in the appraisal phase) are indicators of
the pre-commercial production phase of an O&G project, while production licences
are issued for established and commercialized projects.

Table 1: Types of Offshore Petroleum Titles

Source: NOPTA.21

Based on the dataset published by the National Electronic Approvals Tracking
System (NEATS) in 2021, there are now 373 licences and permits across
Commonwealth waters including 338 which are currently active, 34 pending
application and 1 permit which is pending renewal (Figure 4).

21   Australian Government. National Offshore Petroleum Titles Administrator (NOPTA).
Australia’s Offshore Industry:
A Half-Century Snapshot                                                                       13

Figure 4: Offshore Petroleum Titles’ Status

Source: NEATS.22

The busiest basin in terms of exploration and development O&G activities is the
Northern Carnarvon Basin with more than 130 active licences. The next two are the
Bonaparte and the Gippsland Basins.

Comparing the relative proportion of exploration permits/retention leases and
production licences is informative in terms of the O&G business dynamics in each
basin. For example, pre-production and established production have almost the
same proportion in the Northern Carnarvon Basin which means that although this
Basin is producing a lot of hydrocarbons, there are numerous exploration and
appraisal activities running in parallel illustrating this basin still has plenty of
unexplored resources under the seabed. Alternatively, Bonaparte, Browse and
Roebuck are basins dominated by exploration permits and retention leases,
highlighting they are newer basins under exploration. On the other side, the
depleting Gippsland and Otway basins have much lower exploration activities
compared to commercialised production.

22Australian Government. National Offshore Petroleum Titles Administrator (NOPTA). National
Electronic Approvals Tracking System (NEATS) reporting. 12 May 2021.
Australia’s Offshore Industry:
A Half-Century Snapshot                                                                          14

Figure 5: Offshore Petroleum Titles Across Basins

Source: NEATS,23 IEEFA analysis.

Analysing data from 2000-2020 shows that NOPTA has been issuing many more
exploration permits than production licences over the last decade. Figure 6
demonstrates the issuance rate for exploration permits has far outpaced the
production licence issuance rate since 2011. Until 2011 both were increasing
together, however after that, the production licence issuance rate dropped
dramatically and the number of approved explorations permits jumped. The gap
widened until 2020.24

23 Australian Government. National Offshore Petroleum Titles Administrator (NOPTA). National
Electronic Approvals Tracking System (NEATS) reporting. 12 May 2021.
24 For the title issuance trend (Figure 6), a 2-year moving average was employed to smooth the

noisy data and aid in the illumination of the widening gap between exploration permits and
production licences rather than close matching of data values.
Australia’s Offshore Industry:
A Half-Century Snapshot                                                                       15

Figure 6: Exploration Permits vs. Production Licences Issued in 21st
Century

Source: NEATS,25 IEEFA analysis.

This dramatic shift coincides with the LNG boom and confirms the government’s
tendency to pave the way for O&G producers to find backup gas fields for their
gigantic LNG plants. The government may think the rise in exploration permits will
lead to the next wave of O&G development, however, the global transition to low
carbon economies makes large-scale development of these exploration permits
unlikely to occur.

Another trend was explored by analysing the comprehensive offshore wells dataset
administered by the National Offshore Petroleum Information Management System
(NOPIMS). Figure 7 shows the cumulative trend of additional offshore wells drilled
each year since 1975. Exploration wells and development (production) wells
increased at the same pace until 2008, and with the beginning of the LNG boom,
started to diverge with a higher increase in development (production) wells. Since
2009, development wells increased by 32% while the number of exploration wells
grew by 15%, almost half of the development drilling’ growth rate. This is the first
time such a divergence can be seen in the history of offshore industry in Australia
since 1970s.

25Australian Government. National Offshore Petroleum Titles Administrator (NOPTA). National
Electronic Approvals Tracking System (NEATS) reporting. 12 May 2021.
Australia’s Offshore Industry:
A Half-Century Snapshot                                                                  16

Figure 7: Exploration Wells vs. Development Wells - Drilling Trends
(1975-2021)

Source: NOPIMS.26

In sum, since the beginning of the LNG boom, while more exploration titles were
approved compared to production licences, the number of development wells
drilled increased much faster than exploration wells. This could have some
implications.

One could be the fact that exploration activities have become riskier (rising capital
costs, higher risk of failure, social pressure for less new exploration) and companies
are focussing on definite resources already explored for more gas and oil. This is
especially the case for some LNG plants such as the North West Shelf plants
Wheatstone and Gorgon where the companies had already explored massive gas
fields before and at the time of the projects’ commissioning.

In addition, some companies are constrained by their balance sheets as they have
written off billions of dollars over the last decade or so and do not have money to
bet on more exploration wells. The risk involved in new exploration is much higher
than the cash generative expense on development wells.

Another explanation is that while the government has opened up huge exploration
acreages to expand the industry, exploration wells will come online with a delay
(due to prerequisite seismic surveys, renewing permits to the appraisal phases, and

26   Australian Government. National Offshore Petroleum Information Management System.
Australia’s Offshore Industry:
A Half-Century Snapshot                                                                           17

market disruptions due to COVID-19). In this scenario the government would expect
to see more development wells after about a decade than there were since the
beginning of the LNG boom in 2009 (assuming exploration and appraisal phases
take about 10 years on average to be completed). However, considering massive
divestment from fossil assets has been initiated in recent years27, it is unlikely to
occur.

The Big 4 Operators and Some Emerging Companies
Operators are commonly the most important and dominant players of O&G oil joint
ventures (JV) having the largest stake with the highest level of responsibility and
liability.

Considering offshore active permits reflect the level of O&G-related activities of
operators, time series data of the accumulated number of active permits since the
beginning of the offshore exploration era, highlights the big players in this sector.

As demonstrated in Figure 8, Santos, Woodside Energy, ExxonMobil Australia and
Chevron Australia are the Big 4 players with more than 50 active permits each as
operator.

Figure 8: Top-10 Offshore Operators in Australia (1965-2020)

Source: NEATS,28 IEEFA analysis.

27 Institute for Energy Economics and Financial Analysis (IEEFA). Divestment from Fossil Fuels:
The Financial Case. July 2018.
28 Australian Government. National Offshore Petroleum Titles Administrator (NOPTA). National

Electronic Approvals Tracking System (NEATS) reporting. 12 May 2021.
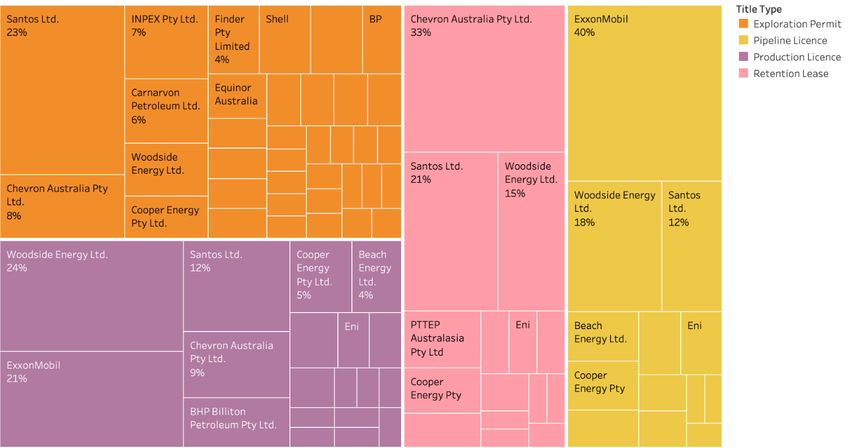
Australia’s Offshore Industry:
A Half-Century Snapshot                                                                       18

From the very beginning of the offshore O&G era, ExxonMobil was on top by far.
However, it was recently overtaken by the aggressive domestic giants Woodside and
Santos. The ExxonMobil upward trend is stabilizing, as its main area of development
and exploration - the Gippsland Basin located in Bass Strait - is being depleted.

Woodside’s exploration and production activity to support Northwest Shelf projects
such as Scarborough has been increasing dramatically, though not as dramatic as
Santos which is ranked first in terms of holding active petroleum titles (62 titles).
Santos was more of an onshore driller historically. In recent years however it
transformed itself into a large offshore operator with the acquisition of both the
Dorado project (offshore West Australia) and ConocoPhillips’ offshore assets in the
Northern Territory. Both projects needed a lot of E&P drillings.

The fourth big operator is not as old as the other three in Australian waters.
Chevron (Chevron Australia Pty Ltd) took off in the 21st century and surpassed some
smaller Australian companies like Cooper Energy and Beach Energy in mid-2000,
just a couple of years before the start of the LNG boom. In terms of growth rate in
acquisition of offshore titles, Chevron is the fastest growing operator today.

Following the Big 4, other Australian companies include Beach Energy, BHP,
Carnarvon Petroleum and Cooper Energy. Some multinational giants like INPEX and
Eni are the other top-10 operators in offshore Australia.

Figure 9 demonstrates the share of operators in each of the major four types of
offshore titles in Australia.

Figure 9: Companies with Lions’ Share in 4 Types of Permits

Source: NEATS,29 IEEFA analysis.

29Australian Government. National Offshore Petroleum Titles Administrator (NOPTA). National
Electronic Approvals Tracking System (NEATS) reporting. 12 May 2021.
Australia’s Offshore Industry:
A Half-Century Snapshot                                                                     19

The breakdown and determination of which big players hold the title types is
insightful as there are dominant companies with the lion’s share in each permit
type. For instance, in exploration permits Santos is the biggest by far followed by
Chevron and INPEX. In terms of production licences, Woodside and ExxonMobil take
the lead. Also, ExxonMobil is the lead operator of pipelines holding 40% of all active
pipeline licences across Australia followed by Woodside with 18%.

Chevron has the lion share of retention leases among all offshore operators.
According to the NOPTA, a retention lease is awarded to a company when
exploration results are not definite but are still promising (a field not currently
commercial but likely to be within 15 years). From this, it could be inferred that
Chevron aims to be the operator of huge amount of production and development
projects in the next couple of years assuming a considerable proportion of its
retention leases end up being commercial scale productions. Having said that, it is
not a realistic aim considering the transformative world-wide departure from fossil
fuelled-resources.

A dichotomy can be seen between two
Australian giants, Santos and Woodside,
and their approach as an operator in the
offshore sector. While Santos is
aggressively proceeding with pre-
production activities (Acquiring                      While Santos is
exploration and appraisal) as a relatively
younger offshore player, Woodside is               aggressively operating
depleting its already commercialized O&G         exploration and appraisal
resources.                                         permits, Woodside has
In a deal with ConocoPhillips in 2019,            focused on depleting its
Santos acquired the Darwin LNG plant              already commercialized
which sources its gas from the nearly
                                                    O&G resources with
depleted offshore Bayu-Undan field. It is
now looking to replace this field with the           holding numerous
carbon-intensive Barrosa gas project.               production licences.
Santos is also looking to develop its
offshore West Australian field, Dorado.
Both of these projects will need
substantial exploration and development
drilling.

Woodside on the other hand, when facing a declining north-west shelf project
turned to the Browse project to fill the gap. It has now abandoned Browse and is
looking to develop the Scarborough field.

Also as illustrated in Figure 9, Chevron is the largest holder of retention leases as the
projects could turn to production licences with commercialized production projects.
Chevron’s giant Wheatstone and Gorgon LNG plants with a total of 24.5 million
tonnes per annum (MTPA) of capacity need a massive amount of gas.
Australia’s Offshore Industry: A Half-Century Snapshot 20 The Most Involved Companies in the Offshore Sector Figure 10 depicts the top-10 companies ranked by the number of titles that they have an interest in, either as an operator or non-operator partner. Figure 10: Top-10 Companies Involved in Offshore Permits Source: NEATS,30 IEEFA analysis. The total number of offshore titles is 373, administered by NOPTA. Apart from the direct share that companies may have in offshore ventures by being an operator or partner, some also have stakes in titles through their subsidiaries. That means their involvement in projects could be direct or indirect through their subsidiaries. IEEFA has attempted to trace each title back to the parent company to provide a clearer picture of the role giant companies play in Australia’s offshore sector. Three Australian industry leaders, BHP, Santos and Woodside are in the list along with multinational incumbents ExxonMobil, Chevron, Shell and BP. Three Japanese giants - Mitsui, Mitsubishi and INPEX - complete the top-10 list. There could be a big shift in this ranking if BHP sells its oil and gas assets across Australia to Woodside.31 In this case, Woodside would be top of the ‘most-involved companies’ list by a far margin. 30 Australian Government. National Offshore Petroleum Titles Administrator (NOPTA). National Electronic Approvals Tracking System (NEATS) reporting. 12 May 2021. 31 Reuters. Australia's Woodside snares BHP oil, gas business in $28bln merger. 17 August 2021.
Australia’s Offshore Industry:
A Half-Century Snapshot                                                                        21

Although the exact percentage interest in each title has not been provided by
NOPTA, assuming an equal weight for each involvement could be an approximate
measure for calculating the share of each company in offshore sector projects in
Australia. Operators like Chevron, Santos, Woodside and ExxonMobil have the lions
share and non-operator partners like Mitsui and Mitsubishi have much smaller
shares in projects which could approximately cancel each other out. Based on this
rough approximation, IEEFA estimated that the top-10 companies depicted in
Figure 10 could be considered as the owners of more than two-thirds of Australia’s
offshore projects.

Exploration Activity Until 2027 - Area and Cost
Analysis
Area Under Exploration
Based on National Electronic Approvals Tracking System’s (NEATS) data32 released
on 12 May 2021, out of the 373 offshore permits, there are 101 active permits and 5
exploration permits pending in Commonwealth waters.

Exploration permits are granted on the basis of a work-bid.33 This means that
companies bid on the amount of exploration work they will undertake in an area
should they be awarded a permit. An application requires the company to provide
an indicative value of the cost and required area (in km2) of each activity as the
criteria of the scope of activities proposed. That means they provide the indicative
cost incurred and the value of the area affected by every exploration activity. Each
exploration permit has a 6-year life from the day it’s awarded, and companies are
obligated to submit a yearly breakdown of their activities and associated costs. The
first 3 years are considered as primary activities and the second 3 years secondary
activities.

Figure 11 shows the area that these companies would be operating in to explore oil
and gas over the next 6 years. As mentioned, companies provide a breakdown of
their activities and each activity needs a specific area. The maximum area needed
for an activity in a specific permit has been considered as the geographical scope of
the project that would be affected by the explorative activities.

32 Australian Government. National Offshore Petroleum Titles Administrator (NOPTA). National
Electronic Approvals Tracking System (NEATS) reporting. 12 May 2021.
33 Australian Government. Department of Industry, Science, Energy and Resources. Offshore

Petroleum Exploration Guideline: Work-bid. In relation to the Offshore Petroleum and
Greenhouse Gas Storage Act 2006. 1 July 2019.
Australia’s Offshore Industry:
A Half-Century Snapshot                                                                        22

Figure 11: Companies’ Area of Exploration Activities

Source: NEATS,34 IEEFA analysis.

The total area under direct exploration activities until year 2027 is 153,800 km2
which is more than twice the size of Tasmania.35 A breakdown of these exploration
activities by operator companies reveals the operators who would operate on the
largest area in Commonwealth waters. As depicted in Figure 11, Santos will use a
much larger area (33,347 km2) compared to other operators. The company’s
exploration activities in the next 6 years would cover an area greater than Belgium.

The first 4 operators in terms of the number of exploration permits depicted in
Figure 9 (i.e.. Santos, INPEX, Chevron and Carnarvon Petroleum) are the same 4
operators with the largest area under exploration. They are followed by the
American exploration company Murphy Oil and the Kuwait Foreign Petroleum
Exploration Company.

34 Australian Government. National Offshore Petroleum Titles Administrator (NOPTA). National
Electronic Approvals Tracking System (NEATS) reporting. 12 May 2021.
35 Assuming that there would be no new exploration permits to be awarded.
Australia’s Offshore Industry:
A Half-Century Snapshot                                                                        23

Exploration Cost
As mentioned, cost estimates have been provided by the companies themselves and
so it would be the most accurate estimate of activities to be conducted during the
exploration phase of O&G projects.

Figure 12 depicts that in the next six years, around AUD 5.1 billion will be spent on
exploration activities alone in offshore Australia.36 The graph has been drawn based
on tentative plans and cost breakdowns provided in work-bids by operators.

Figure 12: Cumulative Offshore Exploration Expenditure Trend (2021-2027)

Source: NEATS,37 IEEFA analysis.

Success rates of exploration projects depend on different factors, however typically
it could be anywhere between 20% to 40%.38 39 It is also common for exploration
projects to be discontinued.

The most recent discontinuation of an exploration permit occurred in the Bight
Basin when Equinor decided to stop operations in exploration permits EPP39 and
EPP40 with Jone Stangeland, Equinor’s country manager for Australia stating: “The
approval of the Stromlo-1 exploration well Environment Plan confirmed our ability

36 Assuming that there would be no new exploration permits to be awarded in this interval.
37 Australian Government. National Offshore Petroleum Titles Administrator (NOPTA). National
Electronic Approvals Tracking System (NEATS) reporting. 12 May 2021.
38 Offshore-mag. Success rates rise for DHI-driven exploration drilling. 28 January 2020.
39 Westwood Global Energy Group. The State of Exploration 2019. 7 May 2019.
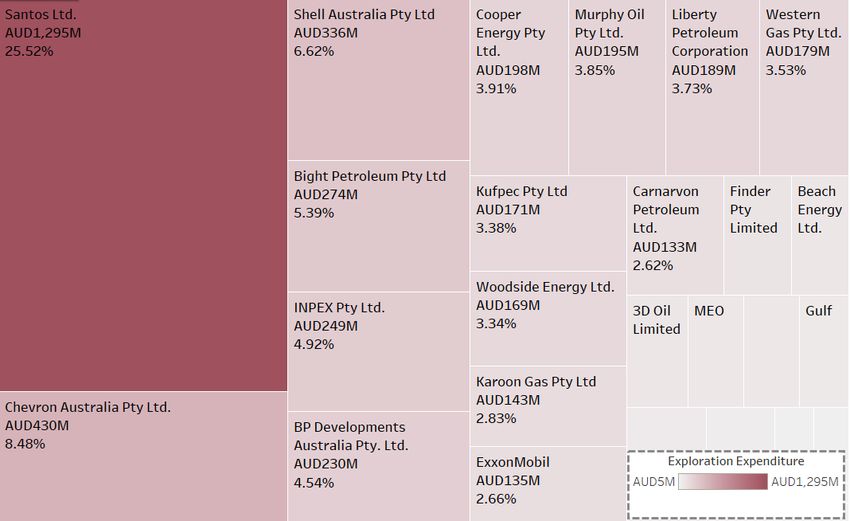
Australia’s Offshore Industry:
A Half-Century Snapshot                                                                                 24

to safely operate in the Bight. However, Equinor has decided to discontinue its plans
to drill the Stromlo-1 exploration well, as the opportunity is not commercially
competitive”.40

For the Australian offshore sector,
factoring in potential success rates means
that roughly AUD3.5 billion will be simply
wiped out in the next 6 years. This
amount is equivalent to the current
capital investment in around 2400MW of
renewable energy projects under
construction (or due to start construction              Roughly AUD3.5 billion
soon) in Queensland, which as an aside                    will be simply wiped
are also creating 3200 direct jobs                     out of Australia’s offshore
according to the Clean Energy Council.41
That suggests that the money (or in some               sector in the next 6 years.
cases subsidies) being wiped out in the
next couple of years on exploration in the
offshore industry could instead be used to
boost both several green jobs and a huge
amount of renewable energy capacity for
Australia.

In addition, it is common practice that of successful exploration projects, some will
fail in the appraisal phase and only a few of them, after spending billions of dollars
and overcoming protracted timelines of around 10-15 years, will pass commercial
production hurdles. Even if they do, the possibility of mass production and
prospects for sales is narrow over the next 10-15 years due to the transformational
energy transition currently underway.

Santos’ aggressive spending is evident when looking at the share of companies
investing in offshore exploration (Figure 13). Santos is the operator of exploration
projects worth AUD1.3 billion collectively; 25% of the total exploration expenditure
to be spent until 2027. Although there are other partners in each permit, and while
the operator would not be the only one spending this amount of money, operator is
generally the dominant partner in joint ventures.

As expected, following Santos, Chevron is the second highest spending operator
with AUD430 million worth exploration projects in total followed by Shell, Bight
Petroleum and INPEX. While Bight Petroleum42, Liberty Petroleum, Murphy Oil, and

40 Equinor. Equinor to discontinue exploration drilling plan in the Great Australian Bight. Last
modified, 26 February 2020.
41 Clean Energy Council. Project Tracker. 27 July 2021.
42 ABC. Bight Petroleum application to extend Great Australian Bight work rejected. 13 February

2021. The exploration permits EPP41 and EPP42 are still active in the NOPTA database. However,
after Equinor’s discontinuation of exploration activities in the Bight Basin last year, there is news
that NOPTA has rejected Bight Petroleum’s application to extend its exploration permits in this
basin.
Australia’s Offshore Industry:
A Half-Century Snapshot                                                                       25

Western Gas are in the list of top-10 operators with largest exploration expenditure
(Figure 13), they were not among the top-10 list in terms of the number of
explorations permits held (Figure 9).

Figure 13: Companies’ Indicative Cost of Exploration Activities

Source: NEATS,43 IEEFA analysis.

Looming Risks Associated with Offshore O&G
Projects
Based on the analysis provided, there are
major risks that Australia’s offshore
industry may have to confront in the near
future.
                                                      Growing LNG demand
The first risk is the uncertain future of the          is no longer a given.
LNG market. The LNG industry is the main
booster of exploration and development
O&G projects in Australia. However,
growing LNG demand is no longer a given.

43Australian Government. National Offshore Petroleum Titles Administrator (NOPTA). National
Electronic Approvals Tracking System (NEATS) reporting. 12 May 2021.
Australia’s Offshore Industry:
A Half-Century Snapshot 26
This year has seen a turning point in the climate change discourse, punctuated by
U.S. leadership in the climate summit held in April44, and the landmark IEA Net-Zero
by 2050 report published in May45 which urges nations to not to spend even a penny
on new oil and gas projects to avoid the disastrous consequences of global warming
beyond 1.5 degrees Celsius. The next flagship global summit is COP26 (United
Nations Climate Change Conference) being held in November 2021. This will be
another catalyst pushing countries around the world towards net-zero.
In the wake of this global will for accelerating the energy transition, many countries
have already revised their goals and ambitions. For example, the U.S. has increased
its target to reduce emissions from 26-28% to 50-52% by 2030. Japan has pledged
to curb emissions from 26% to 46% by 2030. Canada, Brazil, South Korea and China
have also increased their pledges in different ways.46
Countries’ net-zero and decarbonisation pledges in the energy sector will hugely
slash the demand for fossil fuels. Coal has been already smashed by the energy
transition and is in terminal decline. Gas and LNG will be the next victim under the
avalanche of batteries, renewable energy and energy efficiency programs.
Specifically affecting Australia’s offshore industry, Japan’s recent draft energy policy
issued by the Ministry of Economy, Trade and Industry (METI) hits gas as hard as
coal, with Japan determined to meet its new emission reduction targets. In the
previous two decades, Japan has been viewed as a reliable source of LNG demand
for Australia. If the draft of Japan's latest energy policy is enacted, Australia's secure
LNG trade status with the world's third-largest economy may be jeopardised.
Japan aims to double its renewables’ share
in the electricity mix by 2030. This jump in
renewable energy means LNG and coal
will have to surrender market share, with
coal dropping by 40% and LNG by around
50% in the power mix in less than 10
years.47 The Japanese energy plan
poses a serious danger
The Japanese energy plan poses a serious
danger to Australia’s offshore industry as
to Australia’s
the main supplier of the LNG sector. This offshore industry.
will shake up the market, causing a
domino effect on some countries like
South Korea. There will be huge market
volatilities and disruptions in the LNG
sector. And consequently, the offshore
44 U.S. Department of State. Leaders Summit on Climate.
45 IEA. Net Zero by 2050. Revised version. July 2021.
46 CNBC. Here’s what countries pledged on climate change at Biden’s global summit. Updated 22
April 2021.
47 Bloomberg Green. Japan Seeks to Aggressively Cut Fossil Fuel, Lift Renewables. 21 July 2021.Australia’s Offshore Industry: A Half-Century Snapshot 27 industry as the backbone of LNG sector in Australia would be at major risk. The offshore industry will also face greater social and financial pressure due to both emission tracking breakthroughs and a new branch of finance called spatial finance. Spatial finance integrates geospatial analysis into financial decision making, focusing on more accurate emission tracking, specifically in remote areas like offshore facilities.48 Previously, satellite observations were skewed due to the absorption of sunlight by water. However, thanks to new state-of-the-art satellite- based initiatives such as GHGSAT49 and Kayross50, massive methane streams have been observed across the globe including leakages from offshore rigs and infrastructure as it is claimed that these initiatives are more accurate in tracing greenhouse gas emissions. Although methane has a shorter life in the atmosphere compared to carbon dioxide, its’ greenhouse effect is much more than CO2. Following decades of research considering methane's climatic impact, the Following decades scientific community has learned that of research considering methane is worse for the climate than previously thought. Methane used to be methane's climatic seen as 25 times worse than CO2 based on impact, the scientific the Intergovernmental Panel on Climate community has learned Change (IPCC) fourth assessment report from 2007.51 52 However, the latest that methane is worse research by scientists from the UK’s for the climate than University of Reading and Norway’s Center previously thought. for International Climate and Environmental Research (CICERO)53 shows the harmful climatic effect of methane is 99 times worse than CO2 in a 20-year horizon. Coupled with more stringent environmental laws, communities are increasingly suing rule-breaking companies (eg. Shell in the Netherlands54), and climate-friendly shareholders are realising they have the power to change the arrangement of the board of directors (eg. the ExxonMobil case in May 202155). 48 Spatial Finance Initiative. Spatial Finance. 49 GHGSAT.com 50 KAYRROS.com 51 Intergovernmental Panel on Climate Change (IPCC). Climate change 2007: Impacts, Adaptation and Vulnerability. 2007. 52 Climate Council. Passing Gas: Why Renewables Are the Future. 2020. 53 Etminan, M., Myhre, G., Highwood, E. J., & Shine, K. P. Radiative forcing of carbon dioxide, methane, and nitrous oxide: A significant revision of the methane radiative forcing. Geophysical Research Letters, 43(24), 12-614. December 2016. 54 The Guardian. The Guardian view on climate change lawsuits: Big Oil is in the dock. 29 May 2021. 55 Anchorage Daily News. At least 2 ExxonMobil board members lose seats in shareholder fight over climate change. 27 May 2021.
Australia’s Offshore Industry:
A Half-Century Snapshot                                                                               28

Revealing the real magnitude of methane leakages is definitely a major risk for the
offshore industry and will pull into question new gas industry terminology such as
carbon-neutral LNG.56 Both in terms of social licence, but also pending greenhouse
gas emission taxes and levies, Australia’s offshore industry is certainly at risk.

The other dynamics leading to a financial risk is the rising cost of offshore drilling.
IEEFA found that on average, the depth of offshore wells in Australia has
considerably increased over the last decade by around 20%. Based on data from 700
offshore wells, it has been calculated that the average total depth of wells has
increased by around 600 meters during the LNG boom (2009-2019). There are
numerous scientific works showing that well depth and the cost of drilling has an
exponential relationship, and constitutes the largest proportion of an offshore
project’s capex.57

Looking back to Figure 3, the trend in well
drillings towards deep offshore is obvious,
especially in Western Australia. Oil and
gas companies have been looking for more
resources further from the shore in deep                    Companies will be
water. According to the Australian Trade                 incurring exponentially
and Investment Commission (Austrade)                      inflated drilling costs
more than 80% of Australia’s gas
resources exist in deep, remote offshore                   as they drill deeper.
areas.58 As a result, companies will be
incurring exponentially inflated drilling
costs as they drill deeper.

In addition, customers are transitioning from rigid long-term (20-30 year) contracts
to shorter ones (usually 10 years) with more flexible conditions, including the
opportunity to resell cargos in case of oversupply, as a result of the current wave of
country policy actions abandoning gas. So, there is uncertainty about whether all
LNG cargoes will find clients in the next 20-30 years, raising investment risk.

The other risk which has been ignored is the partners’ profile in joint ventures
which has changed in recent years. Big oil and gas companies have lost their ability
to sell down interest in billion-dollar projects as partners are unwilling to commit.
Large stakes in projects have made the cost of financing big projects higher.
Financial institutions are more likely to consider higher interest rates for a project
with one or two partners compared to a project with several partners. Woodside
and its billion-dollar Scarborough project in the north-western shelf offshore
Western Australia is an example of this phenomena.

56 Boiling Cold. Ichthys flaring casts doubt on carbon-neutral LNG cargo. 22 July 2021.
57 Dalmo S. Amorim Jr., Otto Luiz Alcântara Santos and Ricardo Cabral de Azevedo. A statistical
solution for cost estimation in oil well drilling. International Engineering Journal 72(4):675-683.
October 2019.
58 Australian Government. Australian Trade Commission. Oil and Gas. March 2016.
Australia’s Offshore Industry:
A Half-Century Snapshot                                                                   29

        About IEEFA
        The Institute for Energy Economics and Financial Analysis (IEEFA) examines
        issues related to energy markets, trends and policies. The Institute’s mission
        is to accelerate the transition to a diverse, sustainable and profitable energy
        economy. www.ieefa.org

        About the Authors
        Bruce Robertson
        Bruce Robertson has been a fund manager and professional investor for
        over 32 years. He has worked with Perpetual Trustees, UBS, Nippon Life
        Insurance and BT and is an active participant in the national debate on
        energy issues in Australia. brobertson@ieefa.org

        Milad Mousavian
        Energy Analyst for Australian Energy Sector, Milad Mousavian has worked
        as a consultant in the public and private sector and has been conducting
        research in the fields of energy transition, sustainability and climate change
        economics. He has a Masters in Economics from the University of Melbourne
        and in Energy Systems Planning from the University of Tehran.
        mmousavian@ieefa.org
You can also read


