Canadian Oil Sands: Life-Cycle Assessments of Greenhouse Gas Emissions - Richard K. Lattanzio Analyst in Environmental Policy
←
→
Page content transcription
If your browser does not render page correctly, please read the page content below
Canadian Oil Sands: Life-Cycle Assessments
of Greenhouse Gas Emissions

Richard K. Lattanzio
Analyst in Environmental Policy

March 10, 2014

                                  Congressional Research Service
                                                        7-5700
                                                   www.crs.gov
                                                         R42537
Canadian Oil Sands: Life-Cycle Assessments of Greenhouse Gas Emissions
Summary
Canadian Oil Sands and Climate Change
Recent congressional interest in U.S. energy policy has focused in part on ways through which
the United States could secure more economical and reliable petroleum resources both
domestically and internationally. Many forecasters identify petroleum products refined from
Canadian oil sands as one possible solution. Increased production from Canadian oil sands,
however, is not without controversy, as many have expressed concern over the potential
environmental impacts. These impacts include emissions of greenhouse gases (GHG) during
resource extraction and processing. A number of key studies in recent literature have expressed
findings that GHG emissions per unit of energy produced from Canadian oil sands crudes are
higher than those of other crudes imported, refined, and consumed in the United States. The
studies identify two main reasons for the difference: (1) oil sands are heavier and more viscous
than lighter crude oil types on average, and thus require more energy- and resource-intensive
activities to extract; and (2) oil sands are chemically deficient in hydrogen, and have a higher
carbon, sulfur, and heavy metal content than lighter crude oil types on average, and thus require
more processing to yield consumable fuels by U.S. standards.
Selected Findings from the Primary Published Studies
CRS surveyed the published literature, including the U.S. State Department-commissioned study
for the Keystone XL pipeline project in both the 2011 Final Environmental Impact Statement and
the 2014 Final Supplementary Environmental Impact Statement. The primary literature reveals
the following:
• Canadian oil sands crudes are generally more GHG emission-intensive than other
crudes they may displace in U.S. refineries, and emit an estimated 17% more
GHGs on a life-cycle basis than the average barrel of crude oil refined in the
United States;
• compared to selected imports, Well-to-Wheels GHG emissions for Canadian oil
sands crudes range from 9% to 19% more emission-intensive than Middle
Eastern Sour, 5% to 13% more emission-intensive than Mexican Maya, and 2%
to 18% more emission-intensive than various Venezuelan crudes;
• compared to selected energy- and resource-intensive crudes, Well-to-Wheels
GHG emissions for Canadian oil sands crudes are within range of heavier crudes
such as Venezuelan Bachaquero and Californian Kern River, as well as lighter
crudes that are produced from operations that flare associated gas (e.g., Nigerian
Bonny Light);
• discounting the final consumption phase of the life-cycle assessment (which can
contribute up to 70%-80% of Well-to-Wheels emissions), Well-to-Tank (i.e.,
“production”) GHG emissions for Canadian oil sands crudes are 9%-102%
higher than for selected imports;
• the estimated effect of the Keystone XL pipeline on global GHG emissions
remains uncertain, as some speculate that its construction would encourage an
expansion of oil sands investment and development, while others suggest that the
project would not substantially influence either the rate or magnitude of oil
Congressional Research ServiceCanadian Oil Sands: Life-Cycle Assessments of Greenhouse Gas Emissions
extraction activities in Canada or the overall volume of crude oil transported to
and refined in the United States.
Scope and Purpose of This Report
Congressional interest in the GHG emissions attributable to Canadian oil sands crudes has
encompassed both a broad understanding of the resource as well as a specific assessment of the
proposed Keystone XL pipeline. This report discusses the basic methodology of life-cycle
assessments and compares several of the publicly available studies of GHG emissions data for
Canadian oil sands crudes against each other and against those of other global reference crudes.
For a detailed analysis of the GHG emissions attributable to the proposed Keystone XL pipeline,
and the findings from the State Department’s Final Environmental Impact Statement, see CRS
Report R43415, Keystone XL: Greenhouse Gas Emissions Assessments in the Final
Environmental Impact Statement, by Richard K. Lattanzio.
Congressional Research ServiceCanadian Oil Sands: Life-Cycle Assessments of Greenhouse Gas Emissions
Contents
Introduction...................................................................................................................................... 1
Scope and Purpose of This Report ............................................................................................ 2
Life-Cycle Assessment Methodology .............................................................................................. 3
Key Factors in the Assessment of Canadian Oil Sands Crudes ................................................. 4
Results of Selected Life-Cycle Emissions Assessments .................................................................. 7
Life-Cycle Assessments of Canadian Oil Sands Crudes ........................................................... 7
Findings ............................................................................................................................... 9
Design Factors and Input Assumptions for Life-Cycle Assessments of Canadian
Oil Sands Crudes ............................................................................................................ 18
Life-Cycle Assessments of Canadian Oil Sands Crudes versus Other Reference
Crudes................................................................................................................................... 22
Findings ............................................................................................................................. 22
Design Factors and Input Assumptions for Life-Cycle Assessments of Reference
Crudes ............................................................................................................................ 23
Life-Cycle Assessments of Canadian Oil Sands Crudes versus Other Fuel Resources........... 26
Further Considerations................................................................................................................... 27
Figures
Figure 1. Crude Oil Life-Cycle Schematic ...................................................................................... 4
Figure 2. Well-to-Wheels GHG Emissions Estimates for Canadian Oil Sands Crudes ................. 11
Figure 3. Well-to-Wheels GHG Emissions Estimates for Global Crude Resources ...................... 25
Figure 4. Life-Cycle GHG Emissions Estimates for Selected Fuel Resources.............................. 26
Tables
Table 1. Life-Cycle Assessments of Canadian Oil Sands Crudes .................................................... 8
Table 2. Reported Findings of Well-to-Wheels GHG Emissions Estimates in the
Life-Cycle Assessments of Canadian Oil Sands Crudes ............................................................ 12
Table 3. Potential GHG Mitigation Activities in Canadian Oil Sands Production ........................ 27
Contacts
Author Contact Information........................................................................................................... 28
Acknowledgments ......................................................................................................................... 28
Congressional Research ServiceCanadian Oil Sands: Life-Cycle Assessments of Greenhouse Gas Emissions Introduction Recent congressional interest in U.S. energy policy has focused in part on ways through which the United States could secure more economical and reliable petroleum resources both domestically and internationally. Many forecasters identify petroleum products refined from Canadian oil sands1 as one possible solution. Canadian oil sands account for about 56% of Canada’s total crude oil production, and that number is expected to rise from its current level of 1.8 million barrels per day (mbd) in 2012 to 5.2 mbd by 2030.2 Further, the infrastructure to produce, upgrade, refine, and transport the resource from Canadian oil sands reserves to the United States is in place, and additional infrastructure projects—such as the Keystone XL pipeline—have been proposed.3 Increased production from Canadian oil sands, however, is not without controversy, as many have expressed concern over the potential environmental impacts. These impacts may include increased water and natural gas use, disturbance of mined land, effects on wildlife and water quality, trans-boundary air pollution, and emissions of greenhouse gases (GHG) during extraction and processing.4 A number of key studies in recent literature have expressed findings that GHG emissions per unit of energy produced from Canadian oil sands crudes are higher than those of other crudes imported, refined, and consumed in the United States.5 While GHG emissions and other air quality issues originating in the upstream sectors of Canada’s petroleum industry may not directly impact U.S. National Emissions Inventories or U.S. GHG reporting per se, many environmental stakeholders and policymakers have noted that the increased use of more emission-intensive resources in the United States may have negative consequences for both U.S. and global energy and environmental policy. The U.S. Department of State (DOS), in response to comments on the 2010 Draft Supplementary Environmental Impact Statement (2010 Draft EIS)6 for the Keystone XL pipeline project (which would connect oil sands production facilities in the Western Canadian Sedimentary Basin with refinery facilities in the United States), commissioned a contractor to analyze the life-cycle GHG emissions associated with these resources in comparison to other reference crudes.7 DOS presented this analysis in the 2011 Final Environmental Impact Statement (2011 Final EIS) released on August 26, 2011, as a “matter of policy,” but noted that neither the National Environmental Policy Act (NEPA) nor DOS regulations (22 C.F.R. 161.12) nor Executive Orders 1 The resource has been referred to by several terms, including oil sands, tar sands, and, most technically, bituminous sands. Because of its widespread use in academic literature, the term “oil sands” is used in this report. 2 For more information on oil sands resources, see Canadian Association of Petroleum Producers market outlooks, http://www.capp.ca/aboutUs/mediaCentre/NewsReleases/Pages/2013-OilForecast.aspx. 3 For a full analysis of TransCanada’s Keystone XL Pipeline project, see CRS Report R41668, Keystone XL Pipeline Project: Key Issues, by Paul W. Parfomak et al., and CRS Report R42124, Proposed Keystone XL Pipeline: Legal Issues, by Adam Vann, Kristina Alexander, and Kenneth R. Thomas. 4 For more discussion on environmental impacts beyond GHG emissions, see CRS Report R42611, Oil Sands and the Keystone XL Pipeline: Background and Selected Environmental Issues, coordinated by Jonathan L. Ramseur. 5 A list of studies surveyed in this report can be found in Table 1; an account of the finding can be found in Table 2. 6 For all project documents, see the State Department’s website: http://www.keystonepipeline-xl.state.gov/. 7 The most recent full report by the State Department’s contractor is found in U.S. Department of State, Keystone XL Project, Final Supplementary Environmental Impact Statement, Appendix U, “Life-Cycle Greenhouse Gas Emissions of Petroleum Products from WCSB Oil Sands Crudes Compared with Reference Crudes,” January 31, 2014. Congressional Research Service 1
Canadian Oil Sands: Life-Cycle Assessments of Greenhouse Gas Emissions
13337 and 12114 (Environmental Effects Abroad of Major Federal Activities) legally require that
an EIS include an assessment of environmental activities outside the United States.
The initial permit for the Keystone XL Project was denied due to insufficient time to prepare a
rigorous, thorough, and transparent review of the pipeline’s proposed routes through Nebraska. In
May 2012, Keystone filed a new permit application for a revised route, implementing a new
national interest determination. In accordance with this process, DOS released a revised Draft
Supplementary EIS (Draft EIS) for the revised project on March 1, 2013, and a revised Final
Supplementary EIS (Final EIS) on January 31, 2014, including an assessment of the indirect
cumulative impacts and life-cycle GHG emissions of Canadian oil sands crudes.8 While DOS
commissioned a different contractor to assist with the EIS,9 the data used to determine the GHG
life-cycle emissions associated with the resource, as well as the market analysis used for supply
and demand projections, remained largely unchanged. Hence, the 2014 Final EIS made similar
findings to the 2011 Final EIS, including the following:
1. Canadian oil sands crudes “are more GHG-intensive than the other heavy crudes
they would replace or displace in U.S. refineries, and emit an estimated 17%
more GHGs on a life-cycle basis than the average barrel of crude oil refined in
the United States in 2005,”10 and
2. “Approval or denial of any one crude oil transport project, including the
proposed Project, is unlikely to significantly impact the rate of extraction in the
oil sands or the continued demand for heavy crude oil at refineries in the United
States.”11
Opponents of the pipeline, however, are critical of this impact assessment. They contend that the
lack of transport infrastructure and the price discount it occasions has already affected production
of the oil sands and, if continued, would further depress investment and development in the
region.12
Scope and Purpose of This Report
This report presents a summary of life-cycle emissions assessments of Canadian oil sands crudes
and provides an analysis of their respective findings. The first section of the report, “Life-Cycle
Assessment Methodology,” discusses the basic methodology of life-cycle assessments and
examines the choice of boundaries, design features, and input assumptions. The second section of
the report, “Results of Selected Life-Cycle Emissions Assessments,” compares several of the
publicly available assessments of life-cycle GHG emissions data for Canadian oil sands crudes
against each other, against those of other global reference crudes, and against those of other fossil
8
Hereinafter in this report, CRS refers to the “supplementary” documents as the Draft Environmental Impact Statement
(Draft EIS) and the Final Environmental Impact Statement (Final EIS), as the submission of a new permit application
is understood to reinitiate the National Environmental Policy Act process. For further explanation, see CRS Report
R41668, Keystone XL Pipeline Project: Key Issues, by Paul W. Parfomak et al.
9
The first EIS was contracted to Cardno Entrix, with assistance on the GHG analysis from ICF International; the
second EIS was contracted to Environmental Resources Management (ERM).
10
Final EIS, op cit., p. ES-15.
11
Final EIS, op cit., p. ES-16.
12
See, for example, Natural Resources Defense Council, “Say No to Tar Sands Pipeline,” March 2011, at
http://www.nrdc.org/land/files/TarSandsPipeline4pgr.pdf.
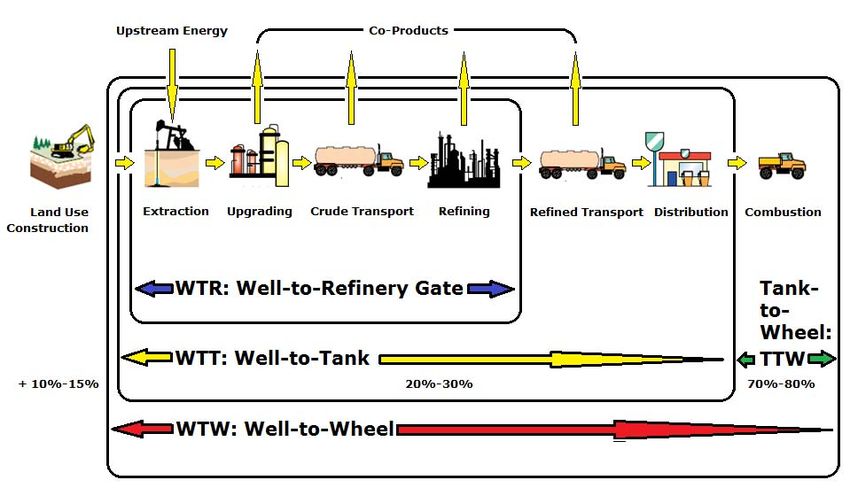
Congressional Research Service 2Canadian Oil Sands: Life-Cycle Assessments of Greenhouse Gas Emissions fuel resources. The report concludes with a discussion of some tools for policymakers who are interested in using these assessments to investigate the potential impacts of U.S. energy policy choices on the environment. For a specific analysis of the GHG emissions attributable to the proposed Keystone XL pipeline, see CRS Report R43415, Keystone XL: Greenhouse Gas Emissions Assessments in the Final Environmental Impact Statement, by Richard K. Lattanzio. Life-Cycle Assessment Methodology Life-cycle assessment (LCA) is an analytic method used for evaluating and comparing the environmental impacts of various products (in this case, the climate change implications of hydrocarbon resources). LCAs can be used in this way to identify, quantify, and track emissions of carbon dioxide and other GHG emissions arising from the development of these hydrocarbon resources, and to express them in a single, universal metric of carbon dioxide equivalent (CO2e) GHG emissions per unit of fuel or fuel use.13 This figure is commonly referred to as the “emissions intensity” of the fuel. The results of an LCA can be used to evaluate the GHG emissions intensity of various stages of the fuel’s life cycle, as well as to compare the emissions intensity of one type of fuel or method of production to another. GHG emissions profiles modeled by most LCAs are based on a set of boundaries commonly referred to as “cradle-to-grave,” or, in the case of transportation fuels such as petroleum, “Well- to-Wheels” (WTW). WTW assessments for petroleum-based transportation fuels focus on the emissions associated with the entire life cycle of the fuel, from extraction, transport, and refining of crude oil; to the distribution of refined product (e.g., gasoline, diesel, jet fuel) to retail markets; to the combustion of the fuel in end-use vehicles. Other LCAs (e.g., Well-to-Tank [WTT] or Well- to-Refinery Gate [WTR]) establish different (i.e., more specific) life-cycle boundaries to evaluate emissions (see Figure 1). Inclusion of the final combustion phase allows for the most complete picture of petroleum’s impact on GHG emissions, as this phase can contribute up to 70%-80% of WTW emissions. However, other LCAs can be used to highlight the differences in emissions associated with particular stages as well as experiment with certain boundary assumptions. The choice of boundaries is an important component to any LCA and can lead to vastly differing reported results.14 13 Greenhouse gases include carbon dioxide (CO2), methane (CH4), nitrous oxide (N2O), hydrofluorocarbons (HFCs), perfluorocarbons (PFCs), and sulfur hexafluoride (SF6), among many others. In order to compare and aggregate different greenhouse gases, various techniques have been developed to index the effect each greenhouse gas has to that of carbon dioxide, where the effect of CO2 equals one. When the various gases are indexed and aggregated, their combined quantity is described as the CO2-equivalent. In other words, the CO2-equivalent quantity would have the same effect on, say, radiative forcing of the climate, as the same quantity of CO2. 14 A study’s choice of boundaries is responsible for many of the vastly differing values for GHG emissions intensities that are currently being reported in published studies of the Canadian oil sands crudes relative to other reference crudes. For example, when expressed on a WTT basis rather than on a WTW basis, GHG emissions intensities from Canadian oil sands crudes may show values that are significantly higher than reference crudes due to the technical omission of combustion from the calculation (see the reported findings in subsequent sections for examples). Congressional Research Service 3
Canadian Oil Sands: Life-Cycle Assessments of Greenhouse Gas Emissions

                             Figure 1. Crude Oil Life-Cycle Schematic

     Source: CRS.

Key Factors in the Assessment of Canadian Oil Sands Crudes
Because of the complex life cycle of hydrocarbon fuels and the large number of analytical design
features that are needed to model their emissions, LCAs must negotiate many variables and
uncertainties in available data. Key factors that influence the results of an LCA include (1)
composition of the resource that is modeled, (2) extraction process of the resource that is
modeled, (3) design factors chosen for the assessment, and (4) assumptions made in the input data
for the assessment. Some of these factors with respect to Canadian oil sands crudes are as
follows:

Crude Oil Types. Oil sands are a type of unconventional petroleum deposit. They are commonly
formations of loose sand or consolidated sandstone containing naturally occurring mixtures of
sand, clay, and water, as well as a dense and extremely viscous form of petroleum technically
referred to as bitumen.15 Most LCAs do not include an assessment of raw bitumen, because it is
near solid at ambient temperature and cannot be transported in pipelines or processed in
conventional refineries. Thus, bitumen is often diluted with liquid hydrocarbons or converted into
a synthetic light crude oil to produce the resource known as “oil sands-derived crude” or simply
“oil sands crude.” Several kinds of crude-like products can be generated from bitumen, and their
properties differ in some respects from conventional light crude. They include the following:

     •   Upgraded Bitumen, or Synthetic Crude Oil (SCO). SCO is produced from
         bitumen through an upgrading process that turns the very heavy hydrocarbons
         into lighter fractions. Since the upgrading process begins at the production

15
  For more technical information on bitumen, see, for example, National Petroleum Council, Heavy Oil, Topic Paper
#22, July 18, 2007, at http://www.npc.org/study_topic_papers/22-ttg-heavy-oil.pdf.

Congressional Research Service                                                                                      4
Canadian Oil Sands: Life-Cycle Assessments of Greenhouse Gas Emissions
facility for SCO, the allocation of GHG emissions is weighted more heavily
upstream than other crude types.
• Diluted Bitumen (Dilbit). Dilbit is bitumen mixed with diluents—typically
natural gas liquids such as condensate—to create a lighter, less viscous, and more
easily transportable product. Mixing bitumen with less carbon-intensive diluents
lessens the GHG emissions impact per barrel of dilbit in relation to bitumen or
SCO. Some refineries need modifications to process large quantities of dilbit
feedstock, since it requires more heavy oil conversion capacity than conventional
crudes. Increased processing in refineries shifts GHG emissions downstream,
potentially intensifying the downstream GHG emission impact of dilbit in
relation to SCO or other crudes (e.g., if dilbit is transported from Canada to the
United States via a pipeline, the need for increased refining downstream would
shift the potential for emissions to the United States).
• Synthetic Bitumen (Synbit). Synbit is typically a combination of bitumen and
SCO. The properties of each kind of synbit blend vary significantly, but blending
the lighter SCO with the heavier bitumen results in a product that more closely
resembles conventional crude oil. Refining emissions from synbit occur both
upstream and downstream, depending upon a variety of factors.
Extraction Process. Two types of methods for extracting bitumen from the reservoir are
currently used in the Canadian oil sands. They include the following:
• Mining. Oil sands deposits that are less than approximately 75 meters below the
surface can readily be removed using conventional strip-mining methods. An
estimated 20% of currently recoverable reserves are close enough to be mined.
The strip-mining process includes removal of the overburden (i.e., primary soils
and vegetation), excavation of the resource, and transportation to a processing
facility. Higher intensities of GHG emissions may result from increased land use
changes during strip-mining. Mining accounts for slightly more than 50% of
current production, and is expected to remain between 40% and 50% through
2030.16 Currently, a significant portion of mined bitumen is upgraded to SCO.
• In Situ. Oil sands deposits that are deeper than approximately 75 meters are
recovered using in situ methods. Most in situ recovery methods currently in
operation involve injecting steam into an oil sands reservoir to heat—and thus
decrease the viscosity of—the bitumen, enabling it to flow out of the reservoir to
collection wells. Steam is injected using cyclic steam stimulation (CSS), where
the same well cycles both the steam and the bitumen, or by steam-assisted gravity
drainage (SAGD), where a top well is used for steam injection and the bottom
well is used for bitumen recovery. Because significant amounts of energy are
currently required to create steam, in situ methods are generally more GHG-
intensive than conventional mining (excluding land use impacts). With more
than 80% of recoverable reserves situated too deep for conventional mining
techniques, it is assumed that the industry will eventually move toward an
increased use of the in situ extraction process in some form.
16
Predictions range from 50% in IHS CERA, Oil Sands, Greenhouse Gases, and U.S. Oil Supply: Getting the Numbers
Right, IHS Cambridge Energy Research Associates, Inc., 2010, to 40% in Canadian Association of Petroleum
Producers, “Crude Oil Forecast,” June 2011.
Congressional Research Service 5Canadian Oil Sands: Life-Cycle Assessments of Greenhouse Gas Emissions
Study Design Factors. Design factors relate to how the GHG comparison is structured in each
study and which parameters are included. These factors may include
• overall purpose and goal of the study,
• time frame for the inputs and the results,
• life-cycle boundaries that are established for comparison,
• units and metrics used for comparison,
• GHG global-warming potential used for comparison,17
• treatment of co-products during refining (e.g., asphalt, petroleum coke, liquid
gases, lubricants),
• treatment of secondary emission flows (e.g., capital infrastructure, land-use
changes),18
• treatment of power co-generation at the facilities, and
• treatment of flaring, venting, and fugitive emissions.
Input Assumptions. Input assumptions can impact life-cycle results at each stage of the
assessment. Studies often use simplified assumptions to model GHG emissions due to limited
data availability and the complexity of and variability in the practices used to extract, process,
refine, and transport crude oil, diluted crude, or refined product. Key input assumptions for
Canadian oil sands crudes may include
• percentage contribution of each type of crude and each type of extraction process
in the final transported product;
• type of upgrading or refining processes;
• amount of petroleum coke produced, stored, combusted, or sold;
• ratios for bitumen-to-diluents, steam-to-oil, gas-to-oil, water-to-oil; and
• energy efficiencies for steam generation and other production processes.
17
Global-warming potential (GWP) is a relative measure of how much heat a greenhouse gas traps in the atmosphere.
It compares the amount of heat trapped by a certain mass of the gas in question to the amount of heat trapped by a
similar mass of carbon dioxide. A GWP is calculated over a specific time interval, commonly 20, 100, or 500 years. All
data included in this report use a 100-year time interval.
18
LCAs often characterize emissions into primary and secondary flows. Primary flows are associated with the various
stages in the hydrocarbon life cycle, from extraction of the resource to the combustion of the final refined fuel. Primary
flows are generally well understood and included in most LCAs. Secondary flows are associated with activities not
directly related to the conversion of the hydrocarbon resource into useful product (e.g., local and indirect land-use
changes, construction emissions, etc.). Because these flows are outside the primary operations, they are often
characterized differently across studies or excluded from LCAs altogether.
Congressional Research Service 6Canadian Oil Sands: Life-Cycle Assessments of Greenhouse Gas Emissions
Results of Selected Life-Cycle Emissions
Assessments
Life-Cycle Assessments of Canadian Oil Sands Crudes
Greenhouse gases, primarily in the form of carbon dioxide and methane, are emitted during a
variety of stages in oil sands production (see text box below).19 A number of published and
publicly available studies have attempted to assess the life-cycle GHG emissions data for
Canadian oil sands crudes. This report examines the life-cycle assessments analyzed by the U.S.
Department of State (DOS)—in conjunction with the consultancy firm ICF International LLC
(ICF)—in the Keystone XL Project’s August 2011 Final Environmental Impact Statement (2011
Final EIS). The studies were selected by ICF using several criteria: (1) they evaluated Canadian
oil sands crudes in comparison to other reference crude oils, (2) they focused on GHG emissions
impacts throughout the entire crude oil life-cycle, (3) they were published within the past 10
years, and (4) they represented the perspectives of a range of stakeholders. The use of these
studies was replicated in the 2014 Final Environmental Impact Statement (2014 Final EIS)
conducted by DOS and the contractor Environmental Resources Management.
Summary of the Potential Sources of GHG Emissions in Oil Sands Development
• land use changes (emissions from the removal of vegetation and trees, soil, and peatland for mining or facilities),
• capital equipment (emissions from the construction of facilities, machinery, or other infrastructure),
• upstream fuels (emissions from the upstream production of fuel or electricity that is imported to the facility to
be used as process heat or power for machinery),
• extraction (emissions from the bitumen extraction process, including equipment for mining and steam generation
for artificial lifting),
• upgrading (emissions from the bitumen upgrading process and the combustion of co-products),
• crude product transportation (emissions from the transportation of crude products and co-products),
• refining (emissions from the crude oil refining process and the combustion of co-products),
• fugitives (emissions from the venting or flaring of methane, or fugitive leaks at any stage of production),
• refined product transportation (emissions from the transportation of final refined products and co-products),
and
• combustion (emissions from the end-use combustion of the refined fuel and co-products).
Table 1 provides a list of the studies referenced by the DOS analysis. While the type, boundaries,
and design features vary across all studies, DOS determined the data and results from
AERI/Jacobs 2009, AERI/TIAX 2009, NETL 2008, and NETL 2009 to be sufficiently robust for
inclusion in the 2011 Final EIS as well as the 2014 Final EIS. Reasons against the inclusion of the
remaining studies are presented briefly in the table, and outlined in more detail in the EIS.
19
For a discussion of the role and effects of greenhouse gases in climate change, see CRS Report RL34266, Climate
Change: Science Highlights, by Jane A. Leggett.
Congressional Research Service 7Canadian Oil Sands: Life-Cycle Assessments of Greenhouse Gas Emissions
Table 1. Life-Cycle Assessments of Canadian Oil Sands Crudes
As evaluated by DOS/ICF for inclusion in the Keystone XL Project Final EIS
Reference
Study Years Type Boundaries Design Factors
Primary LCAs, the data from which are included in the Final EIS
AERI/Jacobs 2009 2000s LCA WTW All crudes
AERI/TIAX 2009 2007-2009 LCA WTW All crudes
NETL 2008 2005 LCA WTW All crudes
NETL 2009 2005 LCA WTW All crudes
Other studies, the data from which are not included in the Final EIS
Charpentier 2009 1999-2008 Meta-analysis WTW Dilbit not analyzed
GREET 2010 Current Model WTW SCO and dilbit unspecified
ICCT 2010 2009 Partial LCA WTT Only imports to Europe analyzed
IEA 2010 2005-2009 Meta-analysis WTW Crude type not specified, results
compared on a per barrel basis
IHS CERA 2010 2005-2030 Meta-analysis WTW All crudes, results compared on a per
barrel basis
McCann 2001 2007 LCA WTW SCO only, results compared on a per
liter basis
McCulloch/Pembina 2002-2005 Partial LCA WTR SCO only, results compared on a per
2006 barrel basis
NRCan 2008 2008 LCA WTW Bitumen only, dilbit not analyzed
NRDC 2010 2006-2010 Meta-analysis WTW All crudes
Pembina 2005 2000, 2004 Partial LCA WTR Crude composition not specified
RAND 2008 2000s LCA WTR SCO only
Sources: Alberta Energy Research Institute/Jacobs Consultancy, Life Cycle Assessment Comparison of North
American and Imported Crudes, 2009; Alberta Energy Research Institute/TIAX LLC, Comparison of North American
and Imported Crude Oil Lifecycle GHG Emissions, 2009; National Energy Technology Laboratory, Development of
Baseline Data and Assessment of Life Cycle Greenhouse Gas Emissions of Petroleum-Based Fuels, November 26, 2008;
National Energy Technology Laboratory, An Evaluation of the Extraction, Transport and Refining of Imported Crude
Oils and the Impact of Life Cycle Greenhouse Gas Emissions, March 27, 2009; Charpentier, A., et al., “Understanding
the Canadian Oil Sands Industry’s Greenhouse Gas Emissions,” Environmental Research Letters, Vol. 4, January 20,
2009; GREET, Greenhouse Gases, Regulated Emissions, and Energy Use in Transportation Model, Version 1.8d.1,
Argonne National Laboratory, 2010; International Council on Clean Transportation, Carbon Intensity of Crude Oil
in Europe Crude, 2010; International Energy Agency, World Energy Outlook, 2010; IHS Cambridge Energy
Research Associates, Inc., Oil Sands, Greenhouse Gases, and U.S. Oil Supply: Getting the Numbers Right, 2010; T. J.
McCann and Associates Ltd., Typical Heavy Crude and Bitumen Derivative Greenhouse Gas Life Cycles in 2007,
Prepared for Regional Infrastructure Working Group, November 16, 2001; McCulloch, M., et al., Carbon Neutral
2020: A Leadership Opportunity in Canada’s Oil Sands, Oil Sands Issue Paper No. 2, Pembina Institute, October
2006; Natural Resources Canada /(S&T)2 Consultants, 2008 GHGenius Update, August 15, 2008; Natural
Resources Defense Council, GHG Emission Factors for High Carbon Intensity Crude Oils, Ver. 2, September 2010;
Pembina Institute, Oil Sands Fever: The Environmental Implications of Canada’s Oil Sands Rush, November 2005;
RAND Corporation. Unconventional Fossil-Based Fuels: Economic and Environmental Trade-Offs, 2008.
Notes: According to the DOS/ICF evaluation: “Type” is considered sufficient when the study is a unique,
original assessment, and is not a meta-analysis that summarizes and averages the results from other sources;
“Boundaries” is considered sufficient when the study evaluates the full WTW GHG emissions life cycle; “Design
Factors” is considered sufficient when the study includes and evaluates all crude types likely to be transported by
the Keystone XL pipeline. See Final EIS, Appendix U, pp. 5-7, for more on the DOS evaluation of each study.
Congressional Research Service 8Canadian Oil Sands: Life-Cycle Assessments of Greenhouse Gas Emissions
The 2014 Final EIS mentioned several other studies published after the release of the 2011 Final
EIS. These studies include Jacobs Consultancy, EU Pathway Study: Life Cycle Assessment of
Crude Oils in a European Context, 2012; IHS CERA, Oil Sands, Greenhouse Gases, and U.S. Oil
Supply Getting the Numbers Right—2012 Update; Adam Brandt, Upstream GHG Emissions from
Canadian Oil Sands as a Feedstock for European Refineries, 2011; and Joule Bergerson et al.,
Life Cycle Greenhouse Gas Emissions of Current Oil Sands Technologies: Surface Mining and In
Situ Applications, 2012. The Final EIS, however, retained a focus on the data and results from
AERI/Jacobs 2009, AERI/TIAX 2009, NETL 2008, and NETL 2009.
Findings
The primary studies—as well as the DOS/ICF meta-analysis—report the following findings:
• Comparisons across the published studies of GHG life-cycle emissions intensities
for fuels derived from different sources are sensitive to each study’s choice of
boundaries and input parameters.
• As reported in the studies, Well-to-Wheels GHG emissions for the full range of
Canadian oil sands crudes and production processes are valued between 101-120
gCO2e/MJ lower heating value (LHV)20 gasoline.
• As reported in NETL 2008, Well-to-Wheels GHG emissions for a select range of
Canadian oil sands crudes and production processes are valued between 101-110
gCO2e/MJ LHV gasoline.
• As reported in NETL 2008, Well-to-Wheels GHG emissions for the weighted
average21 of transportation fuels sold or distributed in the United States (in
reference year 2005) are valued at 91 gCO2e/megajoule (MJ) LHV gasoline.22
• As reported in NETL 2008, Canadian oil sands crudes emit an estimated 17%
more GHGs on a life-cycle basis than the weighted average of transportation
fuels sold or distributed in the United States (in reference year 2005).
• As reported in NETL 2008, discounting the final consumption phase of the life-
cycle assessment (which can contribute up to 70%-80% of Well-to-Wheels
20
The heating value of gasoline is the amount of heat released during the combustion of a specified amount. The
quantity known as higher heating value (HHV) is determined by bringing all the products of combustion back to the
original pre-combustion temperature, thus condensing any vapor produced. The quantity known as lower heating value
(LHV) assumes that the latent heat of vaporization of water in the fuel and the reaction products is not recovered. LHV
is useful in comparing transportation fuels because condensation of the combustion products is not practical.
21
Weighted average computations refer to the assumed mix of crude types and production processes that make up the
bulk of a final product. The assumptions are based on reported industry practices, and are modeled differently in each
study. For example, calculations for the weighted average for “transportation fuels sold or distributed in the United
States” in 2005 can be found in NETL 2008. IHS CERA 2010 assumes an average 55% dilbit and 45% SCO for oil
sands crudes imported to United States, and NETL 2008 assumes 57% SCO and 43% crude bitumen.
22
This baseline is from NETL 2008. It assesses “the average life cycle GHG profile for transportation fuels sold or
distributed in the United States in 2005 [and] is determined based on the weighted average of fuels produced in the U.S.
plus fuels imported into the U.S. minus fuels produced in the U.S. but exported to other countries for use” (NETL
2008, p. ES-5). It includes Canadian oil sands crudes, but does not include emissions from some of the most carbon-
intensive imported crude oils (e.g., Venezuelan Heavy) due to modeling uncertainties (NETL 2008, p. ES-7; NETL
2009, p. ES-2). The baseline value is consistent with the definitions for “baseline life-cycle greenhouse gas emissions”
as used in the Energy Independence and Security Act (EISA) of 2007 and the U.S. Renewable Fuel Standards Program
of 2010.
Congressional Research Service 9Canadian Oil Sands: Life-Cycle Assessments of Greenhouse Gas Emissions
emissions), Canadian oil sands emit an estimated 80% more GHGs on a Well-to-
Tank (i.e., “production”) basis than the weighted average of transportation fuels
sold or distributed in the United States (in reference year 2005).
These numbers serve as averages, and are intended to reflect the range of estimates from the
primary studies. Conversely, individual estimates reported by each of the studies listed in Table
1—both primary and secondary—for various Canadian oil sands crude types and production
processes can be found in Figure 2 and Table 2.
Figure 2 illustrates the WTW GHG emissions estimates as reported by each of the studies for
various Canadian oil sands crude types and production processes. Table 2 summarizes and
compares each study’s emissions estimates, data, and relevant input assumptions. Variability
among the estimates is, in part, the result of each study’s differing design and input assumptions.
A discussion of these assumptions—and their estimated impacts on GHG emissions—follows in
the next section.
Several life-cycle GHG emissions assessments have been published since the release of the 2011
Final EIS. These studies include Jacobs 2012, IHS CERA 2012, Brandt 2011, and Bergerson
2012, among others. IHS CERA 2012 found that transportation fuels produced from oil sands
crudes result in average WTW GHG emissions that are 14% higher than the average crude refined
in the United States (results range from 5%-23% higher). Jacobs 2012 found that WTW GHG
intensities of transportation fuels produced from oil sands crudes are within 7%-12% of the
“upper range” of the WTW intensity of conventional crudes. Bergerson 2012 reported that
“although a high degree of variability exists in Well-to-Wheels emissions due to differences in
technologies employed, operating conditions, and product characteristics, the surface mining
dilbit and the in situ SCO pathways have the lowest and highest emissions, 88 and 120 g
CO2eq/MJ reformulated gasoline,” and that the lower values for certain oil sands production
activities “overlap with emissions in literature for conventional crude oil.”
Congressional Research Service 10Canadian Oil Sands: Life-Cycle Assessments of Greenhouse Gas Emissions
Figure 2. Well-to-Wheels GHG Emissions Estimates for Canadian Oil Sands Crudes
Source: CRS, from studies outlined in Table 1. Average U.S. petroleum baseline for 2005 provided by U.S.
Environmental Protection Agency (U.S. EPA), Renewable Fuel Standard Program (RFS2): Regulatory Impact Analysis,
February 2010, EPA-420-R-10-006, with data sourced from DOE/NETL, Development of Baseline Data and Analysis
of Life Cycle GHG Emissions of Petroleum Based Fuels, November 2008.
Notes: See section “Life-Cycle Assessment Methodology” for key to crude oil types and production processes.
U.S. EPA 2005 (U.S. Average) assesses “the average life cycle GHG profile for transportation fuels sold or
distributed in the United States in 2005 [and] is determined based on the weighted average of fuels produced in
the U.S. plus fuels imported into the U.S. minus fuels produced in the U.S. but exported to other countries for
use” (NETL 2008, p. ES-5). This baseline includes Canadian oil sands crudes, but does not include emissions from
some of the most carbon-intensive imported crude oils (e.g., Venezuelan Heavy) due to modeling uncertainties
(NETL 2008, p. ES-7; NETL 2009, p. ES-2). The baseline number is internally consistent only with the other
NETL findings reported in the figure.
Congressional Research Service 11Canadian Oil Sands: Life-Cycle Assessments of Greenhouse Gas Emissions
Table 2. Reported Findings of Well-to-Wheels GHG Emissions Estimates in the
Life-Cycle Assessments of Canadian Oil Sands Crudes
WTW
Production Crude GHG
Study Method Type Emissions Key Assumptions
LCAs analyzed in the Final EIS
WTW GHG emissions expressed in gCO2e/MJ LHV gasoline
U.S. EPA Baseline Varied 91 Baseline assesses “the average life cycle
2005/NETL GHG profile for transportation fuels sold
2008 or distributed in the United States in 2005
[and] is determined based on the weighted
average of fuels produced in the U.S. plus
fuels imported into the U.S. minus fuels
produced in the U.S. but exported to other
countries for use" (NETL 2008, p. ES-5).
This baseline includes Canadian oil sands
crudes, but does not include emissions
from some of the most carbon-intensive
imported crude oils (e.g., Venezuelan
Heavy) due to modeling uncertainties
(NETL 2008, p. ES-7; NETL 2009, p. ES-2).
AERI/Jacobs Mining + SCO 108 Units: gCO2e/MJ reformulated gasoline;
2009 Upgrading petroleum coke stored at upgrader;
petroleum coke production emissions at
the refinery allocated to the premium fuel
products and sold as a substitute for coal in
electricity generation; accounting for
upgrading included in refinery emissions;
emissions from upstream fuel production
included; venting and flaring included;
infrastructure and land-use changes not
specified or not included.
AERI/Jacobs Mining Dilbit 105 Units: gCO2e/MJ reformulated gasoline;
2009 diluents processed with bitumen at
refinery; petroleum coke production
emissions at the refinery allocated to the
premium fuel products and sold as a
substitute for coal in electricity generation;
emissions from upstream fuel production
included; venting and flaring included;
infrastructure and land-use changes not
specified or not included.
AERI/Jacobs In Situ, SAGD + SCO 119 Units: gCO2e/MJ reformulated gasoline;
2009 Upgrading steam-to-oil ratio (SOR) of 3; petroleum
(Hydrocracking) coke stored at upgrader; petroleum coke
production emissions at the refinery
allocated to the premium fuel products and
sold as a substitute for coal in electricity
generation; cogeneration credits applied;
accounting for upgrading included in
refinery emissions; emissions from
upstream fuel production included; venting
and flaring included; infrastructure and land-
use changes not specified or not included.
Congressional Research Service 12Canadian Oil Sands: Life-Cycle Assessments of Greenhouse Gas Emissions
WTW
Production Crude GHG
Study Method Type Emissions Key Assumptions
AERI/Jacobs In Situ, SAGD + SCO 116 Units: gCO2e/MJ reformulated gasoline;
2009 Upgrading SOR 3; petroleum coke stored at upgrader;
(Coker) petroleum coke production emissions at
the refinery allocated to the premium fuel
products and sold as a substitute for coal in
electricity generation; cogeneration credits
applied; accounting for upgrading included
in refinery emissions; emissions from
upstream fuel production included; venting
and flaring included; infrastructure and land-
use changes not specified or not included.
AERI/Jacobs In Situ, SAGD Dilbit 105-113 Units: gCO2e/MJ reformulated gasoline;
2009 SOR 3; cogeneration credits applied;
diluents processed with bitumen at
refinery; petroleum coke production
emissions at the refinery allocated to the
premium fuel products and sold as a
substitute for coal in electricity generation;
emissions from upstream fuel production
included; venting and flaring included;
infrastructure and land-use changes not
specified or not included.
AERI/TIAX Mining + SCO 102 Units: gCO2e/MJ reformulated gasoline;
2009 Upgrading petroleum coke production emissions at
upgrader allocated in part to the coke and
outside LCA; petroleum coke combustion
emissions at upgrader not included;
petroleum coke production emissions at
the refinery allocated to the premium fuel
products; petroleum coke combustion
emissions at refinery not included;
accounting for upgrading included in
refinery emissions; emissions from
upstream fuel production included; venting,
flaring, and fugitives included; infrastructure
and land-use changes not specified or not
included.
AERI/TIAX In Situ, SAGD + SCO 112-128 Units: gCO2e/MJ reformulated gasoline;
2009 Upgrading SOR 2.5; petroleum coke production
emissions at upgrader allocated in part to
the coke and outside LCA; petroleum coke
combustion emissions at upgrader not
included; cogeneration credits applied using
project specific data; petroleum coke
production emissions at the refinery
allocated to the premium fuel products;
petroleum coke combustion emissions at
refinery not included; accounting for
upgrading included in refinery emissions;
emissions from upstream fuel production
included; venting, flaring, and fugitives
included; infrastructure and land-use
changes not specified or not included.
Congressional Research Service 13Canadian Oil Sands: Life-Cycle Assessments of Greenhouse Gas Emissions
WTW
Production Crude GHG
Study Method Type Emissions Key Assumptions
AERI/TIAX In Situ, SAGD Synbit 105-108 Units: gCO2e/MJ reformulated gasoline;
2009 SOR 2.5; cogeneration credits applied using
project specific data; petroleum coke
production emissions at the refinery
allocated to the premium fuel products;
petroleum coke combustion emissions at
refinery not included; emissions from
upstream fuel production included; venting,
flaring, and fugitives included; infrastructure
and land-use changes not specified or not
included.
AERI/TIAX In Situ, SAGD Dilbit 101-105 Units: gCO2e/MJ reformulated gasoline;
2009 SOR 2.5; cogeneration credits applied using
project specific data; diluents processed
with bitumen at refinery; petroleum coke
production emissions at the refinery
allocated to the premium fuel products;
petroleum coke combustion emissions at
refinery not included; emissions from
upstream fuel production included; venting,
flaring, and fugitives included; infrastructure
and land-use changes not specified or not
included.
AERI/TIAX In Situ, CSS Synbit 109-112 Units: gCO2e/MJ reformulated gasoline;
2009 SOR 3.4-4.8; cogeneration credits applied
using project specific data; petroleum coke
production emissions at the refinery
allocated to the premium fuel products;
petroleum coke combustion emissions at
refinery not included; emissions from
upstream fuel production included; venting,
flaring, and fugitives included; infrastructure
and land-use changes not specified or not
included.
AERI/TIAX In Situ, CSS Dilbit 107-112 Units: gCO2e/MJ reformulated gasoline;
2009 SOR 3.4-4.8; cogeneration credits applied
using project specific data; diluents
processed with bitumen at refinery;
petroleum coke production emissions at
the refinery allocated to the premium fuel
products; petroleum coke combustion
emissions at refinery not included;
emissions from upstream fuel production
included; venting, flaring, and fugitives
included; infrastructure and land-use
changes not specified or not included.
Congressional Research Service 14Canadian Oil Sands: Life-Cycle Assessments of Greenhouse Gas Emissions
WTW
Production Crude GHG
Study Method Type Emissions Key Assumptions
NETL 2008 Mining + SCO 101 Units: gCO2e/MMBtu gasoline, diesel, and
Upgrading jet fuel; petroleum coke use unspecified at
upgrader, petroleum coke production
emissions at refinery allocated outside
LCA; petroleum coke combustion
emissions at refinery allocated only if
combusted on site; accounting for
upgrading not included in refinery
emissions; emissions from upstream fuel
production included; venting, flaring, and
fugitives included; infrastructure and land-
use changes not specified or not included.
NETL 2008 In Situ, CSS Dilbit 110 Units: gCO2e/MMBtu gasoline, diesel, and
jet fuel; SOR not stated; cogeneration
unspecified; diluents unspecified; petroleum
coke production emissions at refinery
allocated outside LCA; petroleum coke
combustion emissions at refinery allocated
only if combusted on site; emissions from
upstream fuel production included; venting,
flaring, and fugitives included; infrastructure
and land-use changes not specified or not
included.
Additional LCAs analyzed by NRDC 2010
WTW GHG emissions expressed in gCO2e/MJ LHV gasoline
U.S. EPA Baseline Varied 93 Baseline assesses “the average life cycle
2005/NETL GHG profile for transportation fuels sold
2008 or distributed in the United States in 2005
[and] is determined based on the weighted
average of fuels produced in the U.S. plus
fuels imported into the U.S. minus fuels
produced in the U.S. but exported to other
countries for use" (NETL 2008, p. ES-5).
Includes emissions from higher carbon-
intensity crude oils imported or produced
domestically.
GREET Mining + SCO 103 Units: gCO2e/mile; petroleum coke use
2010 Upgrading unspecified; accounting for upgrading not
included in refinery emissions; emissions
from upstream fuel production not
specified; venting, flaring, and fugitives
included; infrastructure and land-use
changes not specified or not included.
GREET In Situ, SAGD + SCO 108 Units: gCO2e/mile; SOR not stated;
2010 Upgrading petroleum coke use unspecified;
cogeneration unspecified; accounting for
upgrading not included in refinery
emissions; emissions from upstream fuel
production not specified; venting, flaring,
and fugitives included; infrastructure and
land-use changes not specified or not
included.
Congressional Research Service 15Canadian Oil Sands: Life-Cycle Assessments of Greenhouse Gas Emissions
WTW
Production Crude GHG
Study Method Type Emissions Key Assumptions
McCulloch Mining + SCO 105-111 Units: kgCO2e/bbl SCO; petroleum coke
2006 Upgrading gasification at upgrader included in high
estimate, unspecified at the refinery;
accounting for upgrading not specified in
refinery emissions; emissions from
upstream fuel production not specified;
venting, flaring, and fugitives partially
included; infrastructure and land-use
changes not specified or not included.
NRCan Mining + SCO 109 Units: gCO2e/MJ reformulated gasoline;
2008 Upgrading petroleum coke used at the upgrader
contributes 15% of the energy requirement
for processing SCO and the remainder
offsets emissions from coal combustion at
electric generating units, not specified at
refinery; accounting for upgrading not
included in refinery emissions; emissions
from upstream fuel production included;
venting, flaring, and fugitives included;
infrastructure and land-use changes not
specified or not included.
NRCan Mining Dilbit 108 Units: gCO2e/MJ reformulated gasoline;
2008 diluents unspecified; emissions from
upstream fuel production included; venting,
flaring, and fugitives included; infrastructure
and land-use changes not specified or not
included.
NRCan In Situ, SAGD + SCO 119 Units: gCO2e/MJ reformulated gasoline;
2008 Upgrading SOR 3.2; petroleum coke used at the
upgrader contributes 15% of the energy
requirement for processing SCO and the
remainder offsets emissions from coal
combustion at electric generating units, not
specified at refinery; cogeneration not
included; accounting for upgrading not
included in refinery emissions; emissions
from upstream fuel production included;
venting, flaring, and fugitives included;
infrastructure and land-use changes not
specified or not included.
NRCan In Situ, SAGD Dilbit 116 Units: gCO2e/MJ reformulated gasoline;
2008 SOR 3.2; cogeneration not included;
diluents unspecified; emissions from
upstream fuel production included; venting,
flaring, and fugitives included; infrastructure
and land-use changes not specified or not
included.
Congressional Research Service 16Canadian Oil Sands: Life-Cycle Assessments of Greenhouse Gas Emissions
WTW
Production Crude GHG
Study Method Type Emissions Key Assumptions
NRCan In Situ, CSS + SCO 117 Units: gCO2e/MJ reformulated gasoline;
2008 Upgrading SOR not stated; petroleum coke used at
the upgrader contributes 15% of the energy
requirement for processing SCO and the
remainder offsets emissions from coal
combustion at electric generating units, not
specified at refinery; cogeneration not
included; accounting for upgrading not
included in refinery emissions; emissions
from upstream fuel production included;
venting, flaring, and fugitives included;
infrastructure and land-use changes not
specified or not included.
NRCan In Situ, CSS Dilbit 113 Units: gCO2e/MJ reformulated gasoline;
2008 SOR not stated; cogeneration not included;
diluents unspecified; emissions from
upstream fuel production included; venting,
flaring, and fugitives included; infrastructure
and land-use changes not specified or not
included.
Additional LCAs analyzed by IHS CERA 2010
WTW GHG emissions expressed in KgCO2e/barrel of refined product (see notes below)
IHS CERA, Average US Varied 487 As modeled by IHS CERA from data
2010 Barrel sourced from NETL 2008.
Consumed
IHS CERA, Mining Dilbit 488 Units: kgCO2e per barrel of refined
2010 products; diluents processed with bitumen
at refinery; emissions from upstream fuel
production not included; venting, flaring,
and fugitives not specified; infrastructure
and land-use changes not specified or not
included.
IHS CERA, Mining + SCO 518 Units: kgCO2e per barrel of refined
2010 Upgrading products; petroleum coke use unspecified
(Coker) at the upgrader, allocated outside LCA at
refinery; accounting for upgrading not
specified in refinery emissions; emissions
from upstream fuel production not
included; venting, flaring, and fugitives not
specified; infrastructure and land-use
changes not specified or not included.
IHS CERA, In Situ, SAGD Dilbit 512 Units: kgCO2e per barrel of refined
2010 products; SOR 3; cogeneration credits
applied; diluents processed with bitumen at
refinery; emissions from upstream fuel
production not included; venting, flaring,
and fugitives not specified; infrastructure
and land-use changes not specified or not
included.
Congressional Research Service 17You can also read