Preserving our environment - Investoreports
←
→
Page content transcription
If your browser does not render page correctly, please read the page content below
Preserving our environment

                     Concerns:
                        Compliance with changing legislation
                        Managing our environmental responsibility
                        Climate change and carbon footprint
                        Energy efficiency
                        Water usage and sustainable water supplies
                        Waste management
                        Effluent and waste water
                        Conservation of biodiversity

Understanding our environmental impact
Distell is wholly dependent on the long-term health of the environment from farm to consumer. The
production of wines and alcoholic beverages relies heavily on the growing region’s climate. Environmental
resources such as the soil, climate, water and energy form the basis of our products.

Changes in climate and the quality and supply of water have a major impact on our operations. We recognise
that these changes are at least partly as a result of industrial activity, from the burning of fossil fuels to the
negative effects of emissions, effluent and waste.

Distell is acutely aware of the impact the rising cost of energy has on its business. We are continually improving
our production processes for optimal cost-efficiency. Improving the energy efficiency of our production
processes and substituting fossil fuel with renewable energy solutions where possible, have become a major
focus.

We are also cognisant of society’s concerns with practices that are harmful to the environment. Our consumers
are increasingly more knowledgeable and demand that sustainable environmental practices be followed. Our
environmental strategy is based on five key principles, whereby we recognise our responsibility and commit to
building and preserving the environmental resources we depend on. Our Environmental Policy is available
online at www.distell.co.za.

Strategy and management
Distell’s social and ethics committee oversees all its environmental practices. We manage our production
activities according to the ISO 14001 environmental management system (EMS). Our compliance with the ISO
14001 EMS is internally and externally audited and in most cases externally certified. See page 60 for more
detail.

In 2010 Distell established resource efficiency targets related to the usage of water, electricity and fossil fuel-
based energy in our production processes. These targets were intensity targets related to litre equivaluents of
packaged product produced at Distell’s production sites, excluding the LUSAN wineries. The targets related to a
base year (2009) and a target year (2018). At the end of 2014 we had reached the relevant targets for water
and fossil fuel energy.

It was therefore decided to establish new targets for 2020 based on 2014 as the new base year. At the same
time it was decided to introduce a new Greenhouse Gas reduction target, while also including the LUSAN
production sites in the scope of resource conservation management. See page 59 for more detail.

Compliance with changing legislation

We regularly review all new and proposed environmental legislation, regulations and policies to assess their
potential impact on the business and provide feedback to government where appropriate. This gives us the
opportunity to engage with the regulatory bodies and proactively take the necessary steps to ensure

                                                         56
compliance. This reporting year saw the promulgation of a number of new regulations in terms of relevant
Acts.
We have assessed the impact of these legislative changes on our business activities and below highlighted the
most significant impacts:
Carbon Tax and offset
The Minister of Finance has indicated that the proposed Carbon Tax will be implemented as from 2016. The
proposed tax rate is R120/t CO2e levied after an initial 60% tax-free threshold. A 10% annual tax rate increase
has been proposed for the first five years, while the 60% threshold will be revised only after five years. A
further policy and implementation document is expected.
Our focus remains on reducing our emissions first and foremost, before considering emission offset schemes
provided for under the new legislation.
Environmental impact assessment legislation
The reporting year saw the amendment of the Environmental Impact Assessment (EIA) regulations, as well as
the associated lists of activities that would require environmental authorisation prior to it commencing.
The amendments have introduced new procedural requirements as well as specific timeframes governing the
application and approval process. The new procedures and timelines will impact all applicants and would
require more upfront consultation prior to the submission of an application to ensure the process can be dealt
with within the specified timeframes. New regulations were also promulgated that would require the payment
of an application fee as part of the application process.
Air quality legislation
The reporting period saw the promulgation of new national reporting regulations for atmospheric emissions in
terms of the National Environmental Management Air Quality Act, 2004 (Act 39 of 2004) (NEMAQA). The new
regulations require entities to register on the web-based National Atmosheric Emission Information System
(NAEIS) and to report the relevant emissions assessment result on this system on an annual basis. These
regulations are based on the size/capacity of the installed boilers and affect a number of Distell sites. These
sites have registered on the database and will report annually, as required.
The emissions that are relevant originate mainly from the boilers we use to produce steam for distilling
processes, as well as for cleaning.
Engagement with local authorities
At local authority level, Distell regularly engages with the relevant municipal authorities to improve interaction
and proactively manage concerns of mutual importance. This includes:
Informal engagement with the Stellenbosch municipality relating to proposed new effluent by-laws not
yet available for public comment. As a result, the effluent discharge permits of facilities in the area have
been extended until new permits can be issued. The new by-laws will also have an impact on our
proposed new effluent treatment facility at our Adam Tas site. The full impact on our proposed effluent
treatment facility is not yet known.
Quarterly meetings with other industry players as part of the City of Cape Town’s Accelerate Cape Town
initiative to enhance the city as a sustainability destination and how industry and local government can
work together more closely to improve the environment in and around Cape Town and promote
sustainable business practices.
The establishment of the Stellenbosch River Collaborative aimed at addressing the deteriorating water
quality in the Eerste River catchment area.
57Distell is also an active member of the Cape Winelands District Municipality Air Quality Forum. The forum did
not meet during the reporting period.
Managing our environmental responsibility
Measuring and monitoring systems
Since its implementation in July 2010, our greenhouse gas (GHG) reporting database has played a critical role in
monitoring and managing our environmental management practices at an operational level. Tracking the GHG
emissions for all our South African-based facilities, the database collects data on direct fuel and electricity
purchases from our financial SAP system and converts it directly into carbon dioxide equivalent emissions
(CO2e). Non-financial activities, such as the application of fertiliser and the business-related travel, are tracked
separately and feed into the GHG database.
In addition, we developed a site services dashboard (SSD) to monitor our performance against our resource
usage reduction targets related to water, electricity and fossil fuel-based energy.
Following the successful roll-out of the SSD system to all our fully-owned secondary production sites and our
cider and spirit primary production sites, this year we rolled out the SSD system to our LUSAN and other
remaining winery sites.
As part of Project Re-connect and the company restructuring process, a new division called Supply Chain
Excellence was created. One of the functions of this division includes the standardisation of best practice across
all operations. This includes standardisation of certain reporting indicators, including environmental reporting
indicators. It is forseen that this process will also integrate our African (Ghana) and European (France and
Scotland) production facilities.
Environmental certification
We are progressively implementing ISO 14001 certification at all our South African based primary and
secondary production facilities by formally certifying at least one site per annum. We prefer to submit sites for
the external auditing process when we are satisfied that they meet all the necessary requirements. Our
implementation process is depicted below:
Put the necessary Successfully
Train site Conduct a full
ISO 14001 operate a site
personnel on the internal audit and
systems and with all systems
ISO 14001 an external legal
structures in in place for at
standard audit
place on site least a year
In total, 94% of our sites (2014: 88%) are actively busy implementing ISO 14001. Fifty three percent (2014: 47%)
have already been externally certified. During the new financial year we will undertake external certification at
our Goudini distillery with the aim of formally certifying the facility in accordance with the ISO 14001 system.
During the reporting year, we continued our focus on our four secondary production sites located outside of
the Western Cape, while also initiating the system at our J.C. Le Roux facility.
In the new financial year a number of these sites wil undergo internal audits to assess compliance with the
requirements of the ISO 14001 system.
The table highlights our progress towards certifying all our facilities. The order of certification is determined by
the size and operational complexity of a site, as well as logistical factors.
58Distell production sites:
Ownership and ISO 14001 environmental certification
Production process Facility Location Percentage ISO 14001:2004
ownership
Winery Durbanville Hills Durbanville Hills 72% owned Fully certified in 2004
Nederburg Paarl Fully owned Fully certified in 2005
Plaisir de Merle Simondium Fully owned Fully certified in 2007
Die Bergkelder Stellenbosch Fully owned Fully certified in 2007
Adam Tas Stellenbosch Fully owned Fully certified in 2013
Cider and RTDs Monis Paarl Fully owned Fully certified in 2012
production
Distillery Worcester Worcester Fully owned Fully certified in 2014
Van Ryn Stellenbosch Fully owned Implementation commenced in 2014
James Sedgwick Distillery Wellington Fully owned Fully certified in 2015
Goudini Goudini Fully owned Certification to be undertaken in 2016
Robertson Robertson Fully owned To be determined
Bottling facility Green Park Epping Fully owned Fully certified in 2009
Port Elizabeth Port Elizabeth Fully owned Implementation commenced in 2014
Wadeville Wadeville Fully owned Implementation commenced in 2014
Springs Springs Fully owned Implementation commenced in 2014
J.C. Le Roux Stellenbosch Fully owned Implementation commenced in 2015
Bottle-washing facility Ecowash Wadeville Fully owned Implementation commenced in 2014
While site management is responsible for the day-to-day implementation of all improvement projects, Distell’s
environmental manager oversees all implementation activities and develops the monitoring structures and
related documentation together with the respective sites.
ISO 14001
ISO 14001 is an internationally accepted environmental management certification system. Being ISO
14001-certified means that a facility is managing its environmental impacts in a formal and documented
manner, enabling it to continually reduce its environmental impacts and improve its performance.
The latest standard ISO 14001:2004 is currently under review. We expect an updated version to be
released in 2015. Once published, we will review all our currently certified sites to align them with the
requirements of the new version.
Environmental awareness strategy
Employee awareness is an integral part of the ISO 14001 standard and key to successfully managing our
environmental impacts.
In 2011, Distell established a company-wide Go Green movement, and developed training material highlighting
Distell’s environmental management programmes across our various facilities. These have been distributed to
all sites to create awareness around Distell’s environmental policies, standards and the various ISO
requirements.
We also contracted an external organisation to raise awareness around water, electricity and fossil fuel usage
at our sites. Due to the project’s success, we have now appointed a new dedicated staff member to focus on
this aspect to ensure that we have knowledgeable staff across all our sites.
During 2012 and 2013 a total of 62 middle and senior managers have attended our externally facilitated
sustainability training workshops. In order to speed up the roll-out of our sustainability training, we have been
59working with our environmental training partner to convert the material into an e-learning module. We will
introduce our new sustainability e-learning module in the new financial year.
Our dedicated intranet knowledge base is expanding and will also be used more extensively once the e-learning
module has been completed. We encourage employees and other stakeholders to give feedback and make
suggestions on how Distell can further improve via our dedicated e-mail address, environmental@distell.co.za.
Climate change and carbon footprint
This year, we submitted our fifth annual carbon footprint report to the Carbon Disclosure Project (CDP). As with
7
the previous year, Carbon Calculated externally verified our 2014 data against the ISO 14064-3 standard and
provided us with limited assurance on the 2014 disclosure figures.
Our GHG database was expanded during the reporting year to include all the third party transportation of
intermediary products (wine from supplier wineries), packaged products to Distell’s distribution centres, as well
as packaged products delivered directly to customers’ distribution centres.
The method of calculating the previously reported ‘Downstream transportation and distribution’ of sold
products from our distribution centres to the customer’s outlet has been revised to be in line with the newly
calculated transportation emissions and with international best practice. This resulted in the need to restate
the previously reported emissions, noted in the table below.
Our largest impact on climate change is caused by burning fossil fuels on-site to generate steam for our boilers
(43,2%), as well as the purchase of mainly coal-based electricity from Eskom (52,5%). Our direct emissions
(Scope 1 and 2) increased by 4% to 159 787 tonnes CO2e (2014: 153 646 tCO2e). However we reduced our
emission intensity per litre of product by 7.2% to 238,1 tonnes CO2e per million litres of packaged product
(2014: 256,6 tonnes).
The increase is primarily due to the 6,3% increase in the coal used in our production boilers, a 34,4% increase in
fuel used in mobile combustion in our vehicle fleet and the 1,3% increase in electricity usage. This could be
ascribed to a 12.1% increase in our production volumes.
Electricity accounted for 52,5% of our Scope 1 & 2 direct emissions, while a further 43,2% was caused by
stationary combustion equipment under our control.
Our total GHG emissions, including Scope 3 and “out of scope” emissions, amount to 511 303 tonnes CO2e
(2014: 490 112 tCO2e).
7
www.carboncalculated.co.za
60Carbon footprint*
180000 300
260 259 257 275
150000 244 238.1 250
120000
225
90000 200
2011 2012 2013 2014 2015
Total emissions
Carbon emissions per million litres of packaged product
*Scope 1 and 2 only
As part of the review of our resource efficiency targets, explained above, we also set a new GHG emission
reduction target for 2020 based on the 2014 base year.
The new target for 2020 is to reduce Direct GHG emissions (kg CO2e/l) by 25% per liter of packaged product
612014 (incl 2015 2020 target
Direct GHG emissions LUSAN)
153 646 159 787
GHG emissions - Scope 1 & 2 (tonnes CO2e)
0.2566 0.2381 0,1924
GHG emissions – Scope 1 & 2 per litre
of packaged product (kg CO2e/l)
% reduction* 7,23% 25%
This year we achieved a 7,2% reduction from the 2014 base year. This is ahead of the original set glide path aim
of 5% reduction by 2015 to ensure we reach our stated 2020 target. We are therefore ahead of schedule to
reach our target in 2020
62Distell’s carbon footprint (tonnes CO2e)
2011 2012 2013 2014 2015
Scope 1 direct emissions
Stationary combustion * 58 751 70 699 70 954 65 287 68 965
Mobile combustion – forklifts * 1 059 768 1 303 1 152 1 191
Mobile combustion - vehicle fleet * 4 208 4 168 4 022 3 959 5 320
Fertiliser application on farm 781 371 325 455 446
Total Scope 1 emissions 64 096 76 006 76 604 70 853 75 922
Scope 2 direct emissions
Purchased electricity 62 582 69 314 84 032 82 793 83 865
Total Scope 2 emissions 62 582 69 314 84 032 82 793 83 865
Total Scope 1 and 2 emissions 126 678 145 320 160 636 153 646 159 787
Scope 3 indirect emissions
Purchased goods and services, (packaging material) 2 393 005 402 175 285 844 3 301 074
Business travel – commercial airlines * 2 2 277 9 128 4 573 5 588
Third party transport and distribution (Owner driver)* 2 4 1735 4 3615 4 4665 4 2715
Third party transport and distribution (Bulk transport 4 31 6506&7 35 9606 34 1036 32 7676
of unbottled product)*
Third party transport and distribution (Bottled 4 5 4586 6 1606 6 8516 7 8166
product)*
Total Scope 3 emissions 2 436 5638 457 7848 335 8378 351 516
Total Scope 1, 2 and 3 emissions 126 678 581 883 618 420 489 493 511 303
Non-Kyoto Protocol GHG emissions – Freon R22 2 027 942 248 176 0
Outside of Scope 1, 2 and 3 – Biomass (wood chips) 285 0
Total emissions 128 705 582 825 618 668 489 944 511 303
Full-time employees (FTE) 4 433 4 464 4 592 4 608 4696
Kilowatt hours electricity consumed 60 759 693 70 014 458 84 880 943 82 793 193 81 422 070
Intensity figures
kWh per FTE 13 706 15 684 18 485 17 967 17 339
Tonnes CO2e per FTE employee Scope 1 & 2 only 28,6 32,6 35,0 33,3 34,0
Tonnes CO2e per million litres of packaged product 243,8 260,1 259,0 256,6 238,1
Scope 1 & 2 only
* Revised headings to be more in line with ISO 14064-3 standard
1. Includes emissions from all LUSAN sites, but excludes emissions from Nederburg Wine Farms.
2 Not reported in 2011.
3. Corrected for weight of barrels and wood products purchased.
4. Not reported in previous years as data is not available
5. Calculation method revised to be based on per km emission factor to correspond with new Third party transport model rather than
the derived fuel consumption based calculation method previously used.
6. Transport and distribution undertaken by Third party calculated based on expanded GHG model.
7. Data excludes Bulk transport portion as data is not available.
8. Scope 3 data revised to include additional Third party transport emissions not previously reported as data was not available at the
time
Our Scope 3 emissions associated with the packaging material increased by 5,3%. This can be linked to the
12,1% increase in the production volumes, as well as the 13,1 % increase in the weight of new glass bought.
We have a two-pronged approach to dealing with climate change. On the one hand we endeavour to reduce
our GHG emissions, while on the other hand we are investing in cultivars better suited to warmer climatic
conditions, thereby securing our supply chain of the future. The latter is discussed in detail on page 47.
Reducing our emissions
To reduce both our direct and indirect emissions, we are focusing on reducing our dependence on electricity
and fossil fuel energy sources, which account for the vast majority of our emissions. Our progress towards our
reduction goals is detailed in the relevant sections below.
63We reduce our non-energy-related GHG emissions by capturing, purifying and then using the carbon dioxide
(CO2) released during the fermentation of the apple juice for cider production to carbonate our products. This
in turn reduces our CO2 purchases.
This year we captured 20% more CO2 from fermentation than in 2014. The challenges we faced when
expanding the site’s fermentation capacity (the result of a number of construction projects over the last few
years), was that large volumes of CO2 were released through fermentation in relatively short, peak production
periods. This often exceeded the rate at which our infrastructure was capable of capturing the CO 2 emitted .
Now that construction has been completed, a more stable production process allows us to capture more CO 2
consistently and evenly over longer periods, resulting in the larger volume captured.
Energy efficiency
Our largest impact on climate change is caused by burning fossil fuels on site to generate steam for our boilers,
as well as the purchase of mainly coal-based electricity from Eskom.
Having already achieved our 2018 targets for improvement in energy efficiency (off a base year of 2009) by
2014, we have set new targets for 2020 based on a revised base year of 2014. In addition, the LUSAN
production sites are now included in our management scope.
The new targets for 2020 are:
Reduce on-site fossil fuel based energy (MJ/l) by 20% per litre of packaged product;
Reduce the amount of electricity we use in the production process (kWh/l) by 20% per litre of
packaged product.
The position related to the old targets as at the end of 2014 and the new targets for 2020 is presented below.
64Fossil fuel-based usage
Our fossil fuel-based energy usage fluctuates according to both market demand and forward planning stock
management, which leads to an unsteady trend towards our target. At the end of 2014 we exceeded our
original 2018 target by achieving a total reduction of 25,2%, four years ahead of time.
The new 2020 targets and the performance against these for 2015 are presented below.
2014** (Incl 2015 2016-19 2020
On-site fossil fuel usage 2014* (Excl LUSAN) target
LUSAN)
734 926 303 735 240 433 759 598 205
Energy usage (MJ)
1,2294 1.2259 1.1299 0.9807
Energy usage per litre of packaged
product (MJ/l)
7,83% 20%
% reduction*
*Calculated from the 2014 base year including LUSAN
* The 2014 (excl LUSAN) column represents our performance before restatement to include LUSAN in our performance
scope.
** The 2014 (incl LUSAN) column shows our performance restated to include LUSAN within the performance scope. This
column becomes our new base year against which our future progress will be measured.
This year we achieved a 7,8% reduction from the 2014 base year. This is ahead of the original set glide path aim
of 4% reduction by 2015 to ensure we reach our stated 2020 target. We are therefore ahead of schedule to
reach our target in 2020.
65Understanding fluctuating fossil fuel-based energy intensity figures
Our energy usage depends on the volume of product we produce during the year. Since our
products generally require time to mature before they can be bottled and sold (South African
brandy, for example, legally requires a minimum of three years maturation), accurate
forecasting of future demand is critical to determine current spirit production requirements.
On the other hand, the volume of already matured product we package depends on current
market demand and is therefore not directly correlated with current spirit production levels.
Therefore the ‘energy usage per litre of packaged product’ can vary greatly if predicted future
demand differs from current demand.
During the year we insulated additional steam pipelines and valves at at our Worcester distillery and Wadeville,
Adam Tas, Springs, Ecowash and Port Elizabeth production sites, while improving boiler automation at
Wadeville and Green Park.
As a result, we were able to reduce the amount of coal we used across these sites by approximately 470
tonnes.
We completed the system optimisation assessment studies as part of the National Business Initiative’s (NBI)
Private Sector Energy Efficiency (PSEE) programme, focusing on steam and compressed air optimisation
projects at two of our secondary production sites (Springs & Green Park). The outcomes of the assessments
were also utilised to develop best practice guidelines for the management of steam and compressed air
systems. Training workshops were held in Cape Town and Wadeville to train the site engineering staff on these
best practices. The plan is to implement the guidelines at all our secondary production sites.
We have furthermore found a suitable method of integrating a proposed new biogas (methane) boiler with our
existing coal-based boilers at our Wellington site. The project was approved at the end of 2015 and we plan to
implement this dual system during the course of 2016. This is expected to further reduce our coal
requirements.
We are investigating the feasibility of generating methane gas at a waste water treatment facility at our Adam
Tas site as yet another alternative fuel source (See page 77)
Electricity usage
Progress towards achieving our original electricity usage reduction target by 2018 is presented in the graph and
table below. Our overall electricity reduction at the end of 2014 was 11,33% against our 2018 target of 15%.
The new restated targets for 2020 is presented below.
Electricity usage 2011 2012 2013 2014 2018
target
Electricity usage (kWh) 66 267 095 72 372 784 78 090 306 76 715 095
Electricity usage per litre of packaged 0,1276 0,1295 0,1259 0,1283 0,123
product (kWh/l)
% reduction* 11,87% 10,49% 12,98% 11,33% 15%
*Using 2009 as base year and excluding LUSAN
662014* (Excl 2014** (Incl 2015 2016-19 2020
Electricity usage LUSAN) LUSAN) target
76 715 095 80 036 684 84 726 268
Electricity usage (kWh)
0,1283 0.1334 0.1260 0,1068
Electricity usage per litre of packaged
product (kWh/l)
% reduction* 5,56% 20%
*Calculated from the 2014 base year including LUSAN
* The 2014 (excl LUSAN) column represents our performance before restatement to include LUSAN in our performance
scope.
** The 2014 (incl LUSAN) column shows our performance restated to include LUSAN within the performance scope. This
column becomes our new base year against which our future progress will be measured.
Our progress towards achieving our electricity usage reduction target is presented in the graph and table
above. This year we achieved a 5,5% reduction from the 2014 base year. This is ahead of the original set glide
path aim of 4% reduction by 2015 to ensure we reach our stated 2020 target. We are therefore ahead of
schedule to reach our target in 2020.
An estimated saving of 1 725 094 kWh of electricity was achieved during the reporting year by implementing
the following projects: Energy-efficient lighting upgrades, refrigeration plant optimisation, installation of
variable speed drives (VSDs), improved metering and management of usage, compressed air system
optimisation aross different sites, and installation of natural light harvesters at Adam Tas and Durbanville Hills.
67Water usage and sustainable water supplies
Distell is dependent on water for the agricultural production of its raw materials, and for its production
processes. The importance of securing a reliable supply of water – and ensuring that the quality of the water is
protected – is critical as climate variability becomes more evident. The availability of good quality water is
already limiting agricultural expansion, and the situation is likely to deteriorate further, especially considering
that water availability will be significantly affected by climate change.
There are a number of risks related to water management which could affect Distell. Most notably, these are:
Changes in physical climate parameters such as temperature, average rainfall and precipitation
patterns and extremes (flooding and droughts) which may affect our ability to produce quality
products.
Changes in the water legislation which could affect our activities.
Any water-related changes which may affect our reputation.
The implementation of the National Water Act (Act 36 of 1998), and specifically its compulsory licensing
requirements, could severely impact Distell’s long-term sustainability. Competition for water for
environmental, social and economic needs is a complex issue, particularly in relation to the historical
distribution of water and its link to land ownership. Redressing this situation could have a negative impact on
agriculture and agricultural industries if it is not managed proactively and judiciously.
We recognise our obligation to use water responsibly and, in particular, treat and dispose of waste water
sensibly.
All water usage at our different production sites is measured and recorded on a continuous basis on our SSD
system, to allow for improved management and reporting of water usage at a corporate level.
Water usage and sources affected
At the end of 2014 it was decided to restate our resource efficiency targets as indicated above. When we
assessed the original targets we found a mistake in the 2009 water usage base year data, with the water usage
data for our Ecowash site for 2009 not included. We included the water usage for Ecowash, which effectively
reset the base year and the resultant performance for each subsequent year. The result is that we in fact
reached a 11.29% reduction in water usage by end 2014, which is ahead of the 10% target originally set for
2018.
The revised target for 2020 based on the new 2014 base year, including the LUSAN production sites is a 15%
reduction in usage per liter of packaged product (l/l) by 2020.
The new 2020 targets and the performance against these for 2015 are presented below.
682014* 2014 ** 2015 2020
Water usage (excl (incl target
LUSAN) LUSAN)
2 326 599 2 350 291 2 478 188
Water usage (kl)
3,8919 3.9186 3,6863 3.3308
Water usage per litre of packaged product (l/l)
5,93% 15%
% reduction*
*Using 2014 as base year including LUSAN
* The 2014 (excl LUSAN) column represents our performance before restatement to include LUSAN in our performance
scope.
** The 2014 (incl LUSAN) column shows our performance restated to include LUSAN within the performance scope. This
column becomes our new base year against which our future progress will be measured.
Our progress towards achieving our water usage reduction target is presented in the graph and table above.
This year we achieved a 5,9% reduction from the 2014 base year. This is ahead of the original set glide path aim
of 2% reduction by 2015 to ensure we reach our stated 2020 target. We are therefore ahead of schedule to
reach our target in 2020.
We reduced our water usage at our Adam Tas and Green Park sites by approximately 13 570 836 litres through
internal projects undertaken by staff as part of their internal Distell problem solving training, based on LEAN
and Six Sigma principles.
In general, our farms use groundwater supplies for drinking purposes and industrial usage in our wineries and
bottling facilities, except for Groenhof and J.C. Le Roux farms where a portion of our irrigation needs is also
met by groundwater. All our other farms are dependent on surface water for irrigation purposes.
The origin of the water we use on our farms and production sites is shown in the following tables:
Water source per farm
Total water used,
Farm split by source Detailed description
% groundwater % surface
Surface water from Voëlvlei Dam (Berg River) via the West Coast District
Papkuilsfontein 0% 100%
Municipality pipeline is used for both domestic use and irrigation.
Borehole water is used for domestic purposes. Irrigation water is sourced
Ernita 5% 95%
from the Spruitriver via the Spruitriver Water Users Association.
Borehole water is used for domestic purposes and irrigation. Surface
Groenhof 20% 80%
water from Knorhoek and Driesprong Rivers is used for irrigation.
Borehole water is used for the winery and domestic purposes. Irrigation
Nederburg 1% 99% water is sourced from the Palmiet irrigation scheme and farm dams that
catch run-off from the area.
Borehole water is used for the winery and domestic purposes. Irrigation
Plaisir de Merle 2,5% 97,5%
water is sourced from farm dams that catch run-off from the area.
Borehole water is used for domestic water and irrigation purposes.
Surface water from Theewaterskloof Dam system via Wynland Water
J.C. Le Roux 30% 70%
Users Association and some water from the Stellenbosch Municipality is
used for irrigation.
All water is sourced from the Kraaibosch Dam which is filled by the
Lomond 0% 100%
Uilenkraals River.
Borehole water is used for winery and domestic purposes. Natural run-off
LUSAN – Le Bonheur 10% 90%
is stored in farm dams for irrigation.
Borehole water is used for winery and domestic purposes. Natural run-off
LUSAN – Uitkyk 10% 90%
is stored in farm dams for irrigation.
Water from two springs is used for winery and domestic use. Irrigation
LUSAN – Stellenzicht 10% 90%
water is sourced from Theewaterskloof Dam system and surface run-off
69stored in farms dams on site.
Spring water is used for winery and domestic use. Irrigation water is
LUSAN – Alto 10% 90% sourced from Theewaterskloof Dam system via Wynland Water Users
Association.
The natural run-off stored in farm dams account for 20% of the farm’s
LUSAN – Neethlingshof 0% 100% needs, while the rest is sourced from Theewaterskloof Dam system via
Wynland Water Users Association.
LUSAN – Olives 0% 100% Natural run-off is stored in farm dams for irrigation and domestic use.
Water sources per production site
Production process Production site Water source
Adam Tas Stellenbosch Municipality
Die Bergkelder Stellenbosch Municipality
Nederburg Borehole and Drakenstein Municipality, Paarl
Plaisir de Merle Borehole
Durbanville Hills City of Cape Town via the Voëlvlei water scheme
Wine production
LUSAN – Le Bonheur Borehole
LUSAN – Uitkyk Borehole
LUSAN – Stellenzicht Two mountain springs and Theewaterskloof Dam
LUSAN – Alto Mountain spring
LUSAN – Neethlingshof Stellenbosch Municipality
James Sedgwick Distillery (Wellington) Drakenstein Municipality and Berg River
Worcester Distillery Breede Valley Municipality
Goudini Distillery Borehole
Spirit production
Robertson Distillery Langeberg Municipality
Wadeville Distillery Ekurhuleni Municipality
Van Ryn Distillery Stellenbosch Municipality
Cider and RTDs production Monis Drakenstein Municipality
Green Park City of Cape Town
J.C. Le Roux Borehole
Bottling Springs Ekurhuleni Municipality
Wadeville Ekurhuleni Municipality
Port Elizabeth Nelson Mandela Metro
Second-hand bottle washing Ecowash Ekurhuleni Municipality
Waste management
We generate various types of waste during the production, packaging and distribution of our products. The
majority of our waste consists of organic primary waste as well as inorganic waste like glass bottles and other
packaging waste.
Primary waste management
Primary waste consists of grape skins, stalks and seeds left over after we have extracted the juices we use in
our products. This waste is organic and can be composted or used elsewhere.
We send most of our grape skins to Brenn-O-Kem where alcohol, calcium tartrate and grape seeds are
recovered. They produce tartaric acid and grape seed oil from the calcium tartrate and grape seeds
respectively. Finally, the dry grape skin is used as boiler fuel. Some of the organic waste is transferred to
dedicated composting sites and reused as a soil conditioner. Filtration waste is disposed of by certified waste
contractors.
The reporting year saw a 10.6% reduction in the volume of organic waste recycled and recovered. This directly
relates to a decrease in the volume of grapes pressed, which depends on the grape harvest as well as the wine
production requirements.
70*The volume of primary waste produced relates directly to the volume of grapes pressed, which depends on grape yield
per vintage; this, in turn, is subject to varying climatic conditions.
The table below shows how the individual sites handle their organic waste.
Organic waste treatment methods
Site Treatment method and site treated
Adam Tas Since 2012, grape skins and seeds have been removed by contractor to Seed Oils South
Africa for the manufacturing of grape seed oil, while stems are taken to the Weltevrede
nursery for composting
Bergkelder Since 2011, the waste gets removed by a contractor and taken to Brenn-O-Kem
Nederburg Waste gets removed by a contractor and taken to Brenn-O-Kem
Durbanville Hills Since 2011, the waste gets removed by a contractor and taken to Brenn-O-Kem
Plaisir de Merle Composted on site for use in the farm’s own organic vineyards
LUSAN – Le Bonheur Composted on site for own use
LUSAN – Uitkyk Waste gets removed by a contractor for composting
LUSAN – Stellenzicht Composted on site for own use
LUSAN – Alto Composted at Stellenzicht
LUSAN – Neethlingshof Waste gets removed by a contractor for composting
Packaging material
Packaging material waste is generated during secondary production processes, such as the bottling and
packaging of our products.
We have introduced a range of initiatives to reduce, re-use and recycle packaging material, without
compromising the quality of our products or the image of our brands. Where appropriate, we have switched to
materials that are more environmentally friendly, or reduce volume and weight to landfill.
Glass
This year we used a total of 310 900 tonnes (2014: 278 352 tonnes) of glass bottles, of which 73,0 % (2014:
71,6%) comprised new glass, and the remaining 84 891 tonnes (2014: 79 123 tonnes) comprised re-used
bottles.
We are actively working towards reducing the impact of our glass packaging by employing the three Rs of
waste management: reduce, re-use and recycle.
Reducing the amount of new glass we require
This year we bought 226 009 tonnes of new glass, a 13% increase compared to last year’s 199 229 tonnes. The
increase can be attributed to the following factors:
A production volume increase of approximately 12%.
71During 2015 no new lightweighting projects were implemented. Projects developed will only be
implemented in the new financial year. As a result there was no reduction in the amount of glass
required (reduction in 2014: 2 120).
Re-using glass bottles collected through our ongoing Give back, Get back (GBGB) initiative. We re-used
a total of 84 891 tonnes (2014: 79 123) of glass, or 154,2 million bottles (2014: 141,6) this year,
representing 27,0 % (2014: 28,4%) of our total glass requirements.
Introducing cider-on-tap, which makes use of returnable kegs instead of glass.
Introducing bag-in-box (BIB) packaging for wine, cans for ciders, and making use of larger volume
packaging such as 500 ml cider bottles and 440 ml cider cans.
Exporting our products in bulk containers for bottling overseas.
New glass bought (tonnes)
300,000
250,965 248,790
226,009
211,702 199,229
200,000
100,000
0
2011 2012 2013 2014 2015
Since we’ve introduced light-weight glass bottles in 2009, our total glass requirements reduced by 26 174
tonnes in total, representing approximately 8,4 percent of our annual glass requirement.
We continually investigate opportunities to reduce the amount of glass required per bottle. Although some
opportunities still exist, we have exhausted the bigger savings opportunities available, as is shown in the
continued incremental drop in savings achieved each year. This year we did investigate a number of
opportuniites, but the relevant projects will only be implemented during the new financial year.
By reducing the amount of new glass we use, we correspondingly reduced the amount of CO2e required to
produce the glass in the first place. As no new reduction projects were implemented during this year we were
not able to reduce the amount of carbon dioxide equivalent emissions related to production of packaging in
this way. The graphs below reflect that the cumulative savings have remained the same in 2015 as for 2014.
72*The emissions factor used to determine the amount of CO2e varies per type of glass. In some instances we have used
accurate factors provided by specific suppliers rather than industry averages.
Re-using glass through bottle returns
Three of our plants, Ecowash, Green Park and Port Elizabeth, are equipped to wash used bottles. This year, the
number of bottles washed at the three facilities enabled us to re-use a total of 154,2 million bottles (2014:
141,6 million). In doing so, we reduced the amount of glass we had to purchase by 84 891 tonnes (2014: 79 123
tonnes). This equates to a saving of 148 353 tonnes (2014: 136 142) of CO2e that would have been emitted if
new bottles had been produced.
Through our GBGB programme, we encourage consumers to return relevant used glass containers to retailers
in return for a deposit. All bottles suitable for this type of recycling are clearly marked on the product’s label.
All returned bottles undergo stringent quality checks during the washing, sterilisation, rinsing and drying
processes to ensure they meet stringent food safety criteria, before they are deemed suitable for re-use. The
rest is sent to glass recycling plants as reported on below.
We continue to expand the GBGB programme and create awareness among our redistributors and distribution
partners by building relationships with bottle merchants, assisting with their marketing activities and running
in-store activation campaigns at our own distribution centres and TradeXpresses.
We have initiated a Business Improvement project specifically looking at the complete GBGB program with the
aim of increasing the return ratio of all returnable bottles. As part of this project we will be implementing a
new dedicted crate for our 660ml cider products to allow traders to return bottles more directly. This is
expected to result in a substantial increase in the return ratio of the 660ml bottles.
Our GBGB campaign is augmented by the activities of The Glass Recycling Company (TGRC), a national
voluntary industry initiative that promotes the sustainable recycling of glass. As an active shareholder and
board member, we partially fund TGRC and work together with other major players in the glass industry to
increase the rate of returnable glass and broken glass through advertising, training recycling merchants,
providing glass banks and encouraging bottle returns through financial incentives.
73Glass bottles returned and re-used
2011 2012 2013 2014
2015
Number of bottles (millions)
124,1 139,0 139,9 141,6
154,2
Amount of glass (tonnes)
69 276 77 374 77 681 79 123
84 891
CO2e reduction achieved (tonnes)
117 191 131 709 133 030 136 142
148 353
Note: The three facilities wash bottles only on demand as required by our production sites, and the above data reflects the
actual number and weight of bottles re-used and not the total number of bottles being returned. The volume of waste glass
returned could be higher.
**The data for 2011, 2012 and 2014 has been restated based on revised data analysis.
Recycling glass
Waste glass resulting from production activities is collected, sorted and stored on site until collected for re-use
or recycling by dedicated contractors. All broken or unsuitable bottles are sold to glass recycling companies to
melt and make new glass bottles. Any funds secured in this way are used to expand our recycling system.
As we improve our recycling systems across our sites, we expect the amount of glass recycled to increase.
However, an increase in recycling figures can also be the result of higher than expected production wastage
and eliminating wasteful practices remains a priority. During 2015 the volume of glass recycled increase to 8
898 tonnes, a 20% increase from 2014 (7 388 tonnes).
74Other packaging and production waste
Our activities generate other packaging waste, such as the shrink-wrap placed around new bottles, empty
plastic drums or cartons containing consumables (corks and screw caps). Once cartons are empty, they are
sorted and stored on site until removed by dedicated recycling companies.
An increase in the amount of plastic waste recycled reflects the waste resulting from the packaging of
consumables that Distell bought from suppliers, rather than waste associated with our own production
practices. The fluctuation in weight from year to year should be read in this context.
Other packaging material recycled (tonnes)
2010 2011 2012 2013 2014 2015
Cartons and paper 783 1 376 1 577 1 684 1 761 2 030
Plastic 571 549 862 857 875 892
* *
Tetra Pak 2,2 4,6 2,4 7,32
* * * **
Metal (including cans) 170,8 265,8 256.6
*No production waste generated as these packaging lines were not operational at the time.
** Includes only metal can waste
Effluent and waste water
Our production processes do produce waste water and effluent as a by-product, but the bulk of our waste
water is as a result of washing and cleaning in place (CIP) practices. CIP is critical to ensure our products comply
with product quality and health and safety standards and therefore cannot be eliminated.
The volume and quality of waste water produced at our sites are measured either by us or by the local
authority. The data is kept on site, uploaded onto our SSD database and reviewed by the management forums
within our primary and secondary production business units on a monthly basis.
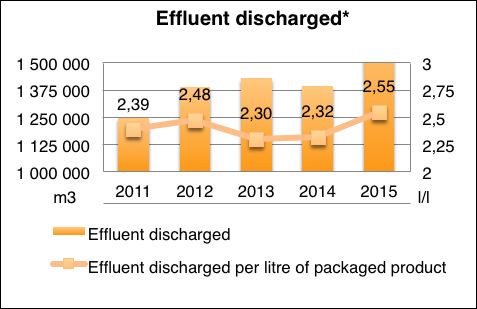
The absolute volume of waste water and effluent from our sites increased by 23,1% during the reporting year
3 3
to 1 716 069 m (2014: 1 393 562 m ), while our waste water intensity increased to 2,55 litres of effluent per
litre of packaged product (2014: 2,32/l).
75Effluent* discharged 2010 2011 2012 2013 2014 2015
Effluent discharged 1 294 459 1 248 579 1 389 256 1 430 153 1 393 562 1 716 069
Effluent discharged per litre of packaged 2,60 2,39 2,48 2,30 2,32 2,55
product
Waste loading of effluent (kg COD) 4 857 668 6 580 333 5 436 127 4 629 459 6 727 104 8 024 255
Waste loading per litre of effluent 9,79 12,62 9,70 7,44 11,22 11,94
*Includes LUSAN figures
Effluent and waste water must be handled, stored, treated and disposed of in a responsible manner to prevent
environmental contamination. Untreated, it can pollute surface water or leach into groundwater, resulting in
pollution plumes that upset natural biomes and downstream water environments. Ongoing fermentation and
anaerobic digestion of waste water also produces CO 2 and methane, a greenhouse gas with more than 20 times
the potency of CO2.
Together with external consultation, two effluent treatment plants have been proposed and, after successfully
conducting EIAs, we are now authorised to start their construction. We will be initiating a detailed technical
feasibility assessment for a possible new anaerobic treatment facility at our Worcester facility during the new
financial year.
All solids generated by our whisky distilling process are sold as animal feed.
Generally, Distell’s production sites use two methods to dispose of waste water:
Discharge to municipal sewer; and
Use for crop irrigation.
Our approach is to look for ways to reduce the load on the local authorities and use treated waste water for
irrigation while minimising our environmental impact. The relevant disposal method depends on the site-
specific conditions and the type of effluent.
Our effluent volumes directly relate to the volume of fresh water we use except at our distilleries where waste
water produced relates to the liquid remaining after the alcohol was distilled off the rabate or distilling wine as
input/raw material. The volume of waste water at our distilleries is therefore directly depedent on the volume
of product distilled at the site. By reducing our water usage per litre of packaged products, we expect a similar
reduction in waste water volumes. While decreased volumes of waste water is advantageous, reducing the
water component results in increased effluent concentration or organic loading per litre of waste water and
the risk of environmental damage if not treated properly.
76The amount of organic matter discharged, as measured by its chemical oxygen demand (COD), increased
significantly to 8 024 255 kg COD (2014: 6 727 104 kg COD).
*Includes LUSAN figures
Effluent disposal and treatment initiatives
In line with environmental best practice, we established an environmental monitoring committee to
oversee/monitor the operation of our controlled evaporation facility at Klipvlak in Worcester. Periods of
intense rainfall have challenged our facilities for handling the water volumes and during the new financial year
we will continue improving the operational controls at the site. We will also initiate a full technical feasibility
study for a possible anaerobic treatment facility to treat the water prior to the discharge to the Klipvlak site to
reduce possible odours. This will reduce the water’s organic load and allow us to produce biogas (methane) for
our boilers.
Our plans to construct effluent treatment plants at our Goudini Distillery and Adam Tas sites are progressing
well. An agreement has been entered into with Veolia Water to construct and operate the anaerobic
treatment facility at Adam Tas. We expect construction to commence during August 2015.
Due to the amended list of activities requiring environmental authorisation in South Africa, we no longer have
to undertake environmental impact assessments (EIAs) before we construct a new water treatment facility at
our Worcester site and upgrade our treatment facility in Wellington. This will have a positive impact on the
ongoing feasibility studies related to these two projects and reduce the lead time before we can start with
construction.
Conservation of biodiversity
Growth in industrial agriculture of necessity has an impact on the natural environment. Fertilisers, pesticides
and the loss of natural habitat are just some of the factors endangering the environment. It is therefore
important to establish and support sustainable farming practices that protect the environment for the long-
term benefit of all.
Our approach has always been that each farm, whether owned by Distell or by an independent supplier to
Distell, must utilise the best sustainable farming practices. In the context of the South African wine industry,
best practice is set out in the guideline of the Scheme for the IPW as described below.
Integrated Production of Wine
All Distell farms and independent suppliers are registered with the scheme for the Integrated Production of
Wine a voluntary environmental sustainability scheme established by the South African wine industry in 1998.
IPW aims to reduce industrial inputs into the farming (in this case, vine-growing) system, reduce carbon
77emissions, and introduce a more integrated approach to pest management, waste water management, solid
waste recycling, health and safety of workers and biodiversity conservation.
The scheme requires accurate record-keeping of all vineyards, winemaking and wine-bottling activities. More
detail is available on page 59.
WWF and the Biodiversity and Wine Initiative
The Biodiversity and Wine Initiative (BWI) is a partnership between the South African wine industry and the
conservation sector under which, farms voluntarily set aside land for conservation so that the natural habitat
can flourish. The BWI guideline in terms of best practice regarding conservation of natural areas form an
integral part of the IPW guidelines and as such all IPW members must comply. However, BWI has previously
also provided additional recognition to farms that set aside land for conservation, so-called BWI Member and
Championship farms.
BWI has now indicated that it will reposition itself and stop operating as a separate organisation and will
therefore no longer provide separate recognition to BWI Member farms setting aside land for conservation.
However, the World Wildlife Fund for Nature (WWF), under who’s auspices BWI have operated, have decided
that they will continue working with, and giving recognition to, the previous BWI Championship category of
farms. These farms, including Neethlingshof and Uitkyk, comply with higher criteria to ensure that critical
conservation areas are being conserved for future generations. From 2016 these farms will be known as WWF
Champions in Conservation.
The area we have set aside for conservation, either through BWI or other conservancies, totals 2 017 ha, or
39% of the total area owned or partly owned by Distell. Distell farms that are currently BWI members are set
out in the table below. BWI membership status will only be valid until the end of 2015.
BWI membership
Farm Membership date Hectares
Plaisir de Merle November 2005 299
Lomond May 2006 465
Papkuilsfontein April 2006 150
Durbanville Hills* September 2008 409
Neethlingshof July 2009 127
Uitkyk* December 2009 365
Groenhof January 2010 102
Nederburg February 2011 10
Alto September 2012 90
Total
2 017
* BWI champions
Uitkyk, Le Bonheur and Plaisir de Merle are also members of the Greater Simonsberg Conservancy and
discussions are underway with Groenhof to join the conservancy.
Clearing alien species
We are committed to removing alien species on our farms to allow indigenous species to reclaim the land. The
process is labour-intensive and requires a number of follow-up clearing sessions to remove all young alien
saplings. The extent of our clearing activities is shown in the table below.
Clearing of alien species
Farm Size Area developed Area Cumulative area where alien plant
(ha) (vineyards, conserved clearing has been completed and areas
roads and (ha) where clearing has not yet started*
buildings) (ha)
78Papkuilsfontein 975 745 225 5*
Ernita 114 106 0 7 + 1*
Groenhof 269 137 102 45 + 57*
Nederburg 272 262 10 2 + 8*
Plaisir de Merle 974 675 299 102 + 123*
J.C. Le Roux 53 53 0 No alien species on farm
Lomond 964 310 465 285 + 20*
LUSAN – Le Bonheur 162 73 70 62 + 8*
LUSAN – Uitkyk 590 225 365 111 + 208*
LUSAN – Stellenzicht 228 195 33** 23 + 10*
LUSAN – Alto 192 102 90 60 + 30*
LUSAN – Neethlingshof 270 145 127 103 + 25*
LUSAN – Olives 106 88 6 No alien species on farm
**Not formally conserved through an initiative such as the BWI, but farm conserves it and manages it as such.
79You can also read