Potential Use of Incineration Bottom Ash in Construction: Evaluation of the Environmental Impact
←
→
Page content transcription
If your browser does not render page correctly, please read the page content below
Waste and Biomass Valorization
https://doi.org/10.1007/s12649-020-01086-2
ORIGINAL PAPER
Potential Use of Incineration Bottom Ash in Construction: Evaluation
of the Environmental Impact
Ute Kalbe1 · Franz‑Georg Simon1
Received: 2 May 2019 / Accepted: 4 May 2020
© The Author(s) 2020
Abstract
Knowledge of the long-term leaching behavior of potentially harmful substances is crucial for the assessment of the envi-
ronmental compatibility of reusing municipal solid-waste incineration bottom ash (MSWI BA) in construction, i.e., as a
road base layer. BA fractions obtained from wet-processing aiming at the improvement of environmental quality were used
to investigate the mobility of relevant substances. Eluates from laboratory-scaled leaching procedures (column percolation
and lysimeters) were analyzed to learn about the long-term release of substances. Unsaturated conditions and artificial
rainwater (AR) were used in the lysimeter tests to simulate field conditions. In addition, batch test eluates were generated
at usual liquid-to-solid ratios (L/S) for compliance testing purposes. A variety of cations and anions was measured in the
eluates. The wet treatment reduces the leaching of chloride and particularly sulfate by more than 60%. The release of typical
contaminants for the treated MSWI BA such as the heavy metals Cu and Cr was well below 1% in the conducted leaching
tests. An increase in the Sb concentration observed in the lysimeter experiments starting at L/S 0.75 L/kg and in the column
experiment at L/S 4 L/kg is assumed to be related to decreasing concentrations of Ca and thus to the dissolution of sparingly
soluble calcium antimonate. The same leaching mechanism applies with V, but the concentration levels observed are less
critical regarding relevant limit values. However, on the long term the behavior of Sb could be problematic for the applica-
tion of MSWI BA in construction.
Graphic Abstract
Electronic supplementary material The online version of this
article (https://doi.org/10.1007/s12649-020-01086-2) contains
supplementary material, which is available to authorized users.
Extended author information available on the last page of the article
13
Vol.:(0123456789)
Waste and Biomass Valorization

Keywords MSWI bottom ash · Leaching · Batch tests · Lysimeter · Antimony

Statement of Novelty                                               reuse applications [17]. Furthermore, a comparison of data
                                                                   obtained by simple laboratory tests to data obtained under
Wet-mechanical treatment is an option to generate secondary        field conditions is of high interest for this purpose [18–20].
raw material from waste incineration residues with high               A wet-processing technology for municipal solid waste
quality regarding environmental compatibility as a surrogate       incineration bottom ash (MSWI BA) has been optimized
in construction. Especially from long-term lysimeter tests         regarding the amount and quality of the fractions produced
with treated bottom ash, the leaching behavior of such             in the framework of a project funded by ZIM (Central
materials was investigated for almost 5 years using field-         Innovation Program for SMEs of German Federal Ministry
like conditions. Particularly the unusual leaching behavior        for Economic Affairs and Energy). The technology focuses
of antimony was shown and related to the immobilization            on the mineral fractions, which are the main mass fraction,
of calcium, i.e. increasing antimony concentrations with           in order to enable their reuse as construction products. In
proceeding ageing. This phenomenon must generally                  particular, the aim was the removal of chloride and the
be observed when bottom ash is applied in construction             transfer of sulfate to the finest fraction. Within the project,
since threshold values might be exceeded in a later stage          we performed accompanying investigations regarding the
of lifetime. The findings will induce research on suitable         mass balance of the process and the leaching behavior of the
countermeasures to avoid environmental burden.                     various processed fractions [21].
                                                                      In this manuscript, eluate analyses from batch leaching,
                                                                   column percolation, and lysimeter tests in laboratory scale
                                                                   were thereby discussed to learn more about the long-term
Introduction                                                       release of hazardous substances from bottom ash in civil
                                                                   engineering applications, e.g. road construction [2, 22].
Approximately 68 million tonnes of municipal solid waste              Particularly, attention was paid on the potentially
(about 27% of total amount) were incinerated in 2017 in            critical leaching behavior of Sb which is mainly introduced
the EU-28 countries [1] which resulted in about 15 million         to bottom ash from additives in plastics. The specific
tonnes of MSWI BA and represents a valuable source for             behavior of antimony in MSWI BA has been discussed by
secondary raw materials. After separation of metals the            previous studies [20, 23–26]. It is intended to regulate Sb in
remaining mineral fraction is mostly reused as unbound             MSWI BA in Germany within a new ordinance on the
aggregate for construction of road base layers. Even though,       reuse of mineral waste [8, 27].
the environmental behavior of MSWI BA in reuse scenarios
in construction has been intensively studied [2–7], there is
still a substantial need for research e.g. regarding advanced      Experiment
pre-treatment options to improve the mechanical perfor-
mance, to reduce the environmental impact and finally to           Material
save natural resources as well as landfill space.
    In Germany, the regulations on the reuse of mineral            The material was sampled on November 5, 2013 at a
waste are in the responsibility of the 16 Federal states so far.   bottom ash treatment plant in Germany. Ferrous (Fe) and
Quite stringent threshold values for substances of environ-        non-ferrous (NFe) metals had already been removed by
mental concern (including Sb) are targeted to be regulated         standard methods (magnets, eddy current separation). A wet-
on national level [8]. Even though, harmonized leaching            mechanical process step was implemented in the plant to
procedures are required by the European Commission [9]             remove the finest fraction below 0.25 mm [21]. Two mineral
and are being developed (e.g. [10]) on European level not          fractions (0.25–4 mm and 4–60 mm) were generated by
all European member states have implemented appropriate            different sieving steps (see Fig. 1).
regulations. Further, the specification of threshold values           The mineral fractions from 0.25–4 to 4–60 mm were
remains in the responsibility of the member states so far.         sampled, air-dried, and homogenized separately. The
Therefore, the risk assessment approaches are different even       4–60 mm fraction was additionally sieved to 45 mm.
in countries with well-developed legislation [11].                 Representative subsamples of both fractions were
    Considering the waste input [12], operational conditions       then combined in the lab at a ratio of 40:60 to the final
of incineration [13] and pre-treatment technologies [14–16],       0.25–45 mm test material employed for the leaching
the subsequent influence on the leaching behavior has to           experiments, since this condition was expected as the status
be investigated to assess a potential environmental risk in        on an intermittent storage site before reuse of such material.

13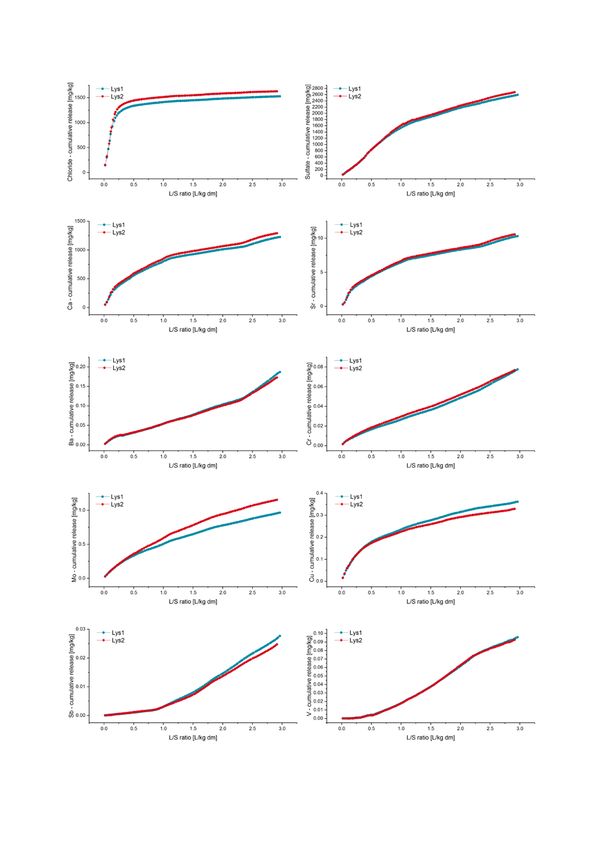
Waste and Biomass Valorization

                                     Wet treatment

         Feed (0-45/60 mm)                 Sieve
                                                                                 Magnet                                     Fe (4-45/60 mm)
                                           4 mm

                                                                                  Sieve               Eddy current
                                          Hydro-                                                                            NFe (16-45/60 mm)
                                                                                  16 mm                separator
                                          cyclone

                                           we                                                       Minerals (4-45/60 mm)
                                                                               Eddy current                                 NFe (4-16 mm)
                                           Sieve                                separator
                                           4 mm
                                                                             Minerals (0.25-4 mm)

                                                          Eddy current
                                                                                                                            NFe (>16 mm)
                                                           separator
                                          Hydro-
                                          cyclone

                                                      Minerals (0.25-4 mm)
                             Filter cake (
Waste and Biomass Valorization
Borosilicate glass columns was 10 cm, the filling height bicarbonate in aqueous solution (8 mmol/L/1 mmol/L) as
40 cm, and the resulting sample dry mass approximately eluent. ICP-MS measurements were performed from tenfold
4.9 kg for all columns. The porosity of the material packed in dilutions with a Thermo Scientific iCAP Qc [42].
the columns was 42%. Following DIN 19528, a flow rate of
4.35 mL/min was applied to obtain 5 h contact time between
leachant and sample. Whereas such column percolation tests Results and Discussion
are usually performed up to an L/S of 4 L/kg, the tests in this
study were extended to an L/S of approximately 10 L/kg to Mass Balance of the Process
make it possible to compare the release of substances with
the other leaching tests and especially to study the long-term The objectives of the wet treatment process for MSWI
behavior of Sb. In contrast to the lysimeter experiments, bottom ash were to produce higher quality mineral material
saturated conditions prevailed in the laboratory column tests. for use as secondary building material and the recovery
The duration of the column experiment was 186 h. The use of the purest possible metals. Therefore, the treatment
of Milli-Q water as leachant is standard for this type of test. was executed without prior ageing of the bottom ash. The
In addition, artificial rainwater (AR) was used to make it process was realized in two plants in Germany, one near a
possible to compare with the lysimeter results. waste incineration plant and a second where the ash material
Batch tests were performed according to DIN 19529 was delivered by combined ship and truck transport. The
[34] (L/S 2 L/kg) and DIN EN 12457 [35] (L/S 10 L/kg). A capacity was in the range of 50–60 tons per hour. Details
representative sample mass of approximately 2.5 kg for each of the process are described elsewhere [21]. A sketch of the
test was split into several subsamples, which were shaken process is displayed in Fig. 1.
in several glass bottles for 24 h. After 15 min of settling, The mass balance was estimated over an 8-month
the supernatants were recombined. Pressure filtration was operation period in which more than 65,000 tons were
subsequently conducted through a 0.45-µm cellulose nitrate treated. The results are displayed in Table 1.
membrane filter for liquid–solid separation. All leaching The intended use as secondary building material was
tests were performed in at least duplicates. targeted in a ratio of 60% fine and 40% coarse mineral
material by the operator of the recycling plant in order
Analysis of Heavy Metals and Anions in Eluates to obtain the desired sieving line and improve the soil-
mechanical characteristics. All analyses and leaching
Leachates were aliquoted after sampling. A small subsample experiments in the present study were therefore performed
was analyzed immediately for conductivity, pH, turbidity, with a 60:40 mixture of the two fractions. However, the
and total organic carbon (TOC) as basic parameters. For mass balance for sulfate was estimated with the analyses
chemical analysis, one aliquot was preserved using concen- of the separate fractions. With the data in Table 1, it can be
trated nitric acid [36] for measurement of cations, and one calculated that 60.4% of the sulfate input is concentrated
aliquot remained untreated for anion analysis. The eluates in the filter cake (123,500 mg S O4/kg × 12.2%)/(24,966 mg
were stored at 4 °C until measurement. SO4/kg), see Table 1. Chloride can be removed from the
TOC concentration was determined with a TOC-VCPH initial material only by dissolution and not by separation of
analyzer (Shimadzu, Berlin, Germany) by the difference a certain grain-size fraction and is therefore dependent on
method with external calibration. pH values were measured the frequency of washing water renewal.
with a Schott CG 841 pH-meter equipped with a WTW Sen-
Tix 41 pH electrode [37], the electric conductivity with a
WTW LF 437 microprocessor conductivity meter [38], and
turbidity by a HACH 2100 N turbidity meter [39]. Table 1 Mass balance of the wet treatment process
Cations (Al, As, Ba, Ca, Cd, Co, Cr, Cu, Fe, Hg, K, Mg, Fraction Share (%) Sulfate (mg/kg)
Mn, Mo, Na, Ni, Pb, Sb, Sn, Sr, V, Zn, Se) were quanti-
fied on an iCAP 7000 ICP-OES equipped with an ASX-260 Filter cake (< 0.25 mm) 12.2 123,500
autosampler (Thermo Scientific, Dreieich) according to [40]. Fine aggregates (0.25–4 mm) 30.7 17,800
An external calibration with mixed standards was carried Coarse aggregates (4–60 mm) 53.8 6800
out for the ICP-OES. Anions (F−, Cl−, NO3−, Br−, NO2−, Fine non-ferrous metals (0.25–4 mm) 0.03
PO43−, SO42−) were determined on an IC320 ion chromato- Medium non-ferrous metals (4–16 mm) 0.9
graph with an AS 40 autosampler, an ASRS 300 suppressor, Coarse non-ferrous metals (> 16 mm) 0.7
an AS-9-HC separation column with column oven, and a Fine ferrous metals (nails, bolts, caps, 1.7
etc.)
conductivity detector according to DIN EN ISO 10304 [41].
Total 100 24,966
The separation was isocratic with a mixture of carbonate/
13Waste and Biomass Valorization
Bulk Parameters Table 2 Total content of substances in the test material in mg/kg
Substance Treated bottom ash Filter cake
For numerous elements, the pH value is the dominant fac- 0.25–45 mm < 0.25 mm
tor controlling the solubility [43]. Wet extracted bottom
Al 36,310.0 35,415.0
ash exhibits pH values above 12 before start of the ageing
As 4.3 7.3
processes (e.g. formation of C aCO3 from the reaction of
Ba 1,725.6 646.0
Ca(OH)2 with CO2 from the air transported by rainwater).
Ca 90,678.4 162,725.0
From the solubility of Ca(OH)2, a maximum pH value of
Cd 4.6 8.9
12.2 can be calculated. At such high pH values, high concen-
Co 64.1 34.8
trations of certain heavy metals can be measured in standard
Cr 436.9 270.1
leaching tests. Lead, for example, forms soluble hydroxy
Cu 3725.0 2654.0
complexes (Pb(OH)42−), resulting in concentrations above
Fe 57,188.2 28,185.0
0.2 mg/L in batch tests with L/S = 10 L/kg [44]. Below pH
K 2414.0 1826.0
12, the concentrations are considerably lower. In the pre-
Mg 7694.4 8670.0
sent work, the pH value was below 12 in all experiments
Mn 1098.2 723.0
after reaching equilibrium conditions (L/S > 0.21 L/kg), see
Mo 18.4 20.6
Fig. 2.
Na 6770.8 3054.0
In the batch test at L/S = 2 L/kg and L/S = 10 L/kg, only
Ni 249.3 147.1
the final pH values can be recorded (10.6 for L/S 2 and 10.7
Pb 1062.4 1583.0
for L/S 10).
Sb 47.9 103.7
Redox potential was measured continuously in the lysim-
Sn 40.1 50.2
eter experiment and was in the range of 20–40 mV. The
Sr 293.0 452.0
electrical conductivity dropped from maximum values above
V 56.2 58.4
20,000 µS/cm in the beginning by more than 90% to values
Zn 3413.4 4770.0
well below 2000 µS/cm.
Cl 2840.0 6700.0
SO4 13,400.0 123,500.0
Total Content of MSWI BA Constituents
CO3 33,140.0
Table 2 shows the total content of substances in the bot-
tom ash samples used for the leaching experiments. The
total content of the finest fraction that was removed by the not be significant, due to the common inhomogeneity of
wet-mechanical process step in the BA treatment plant is MSWI BA. However, at least the wet-mechanical process
displayed in Table 2 for comparison. Noticeable is the con- successfully reduced the sulfate content in the mineral
siderably higher content of Ca and sulfate in the filter cake. fraction above 0.25 mm foreseen for use (Table 1), since
Enrichment by other elements such as Pb and Sb might a high portion of sulfate is transferred to the filter cake
(Table 2).
12.0 11.5
11.5 11.0
11.0 10.5
10.5 10.0
pH value
pH value
10.0 9.5
Milli-Q 1
9.5 9.0
Milli-Q 2
9.0
AR 1
8.5
Lys1
AR 2
8.5 8.0 Lys2
8.0 7.5
0 2 4 6 8 10 0.0 0.5 1.0 1.5 2.0 2.5 3.0
L/S [L/kg dm]
L/S [L/kg dm]
Fig. 2 pH value as a function of the L/S ratio in the column experiments using MilliQ and AR as eluent (left, two replicates each) and the lysim-
eter experiment (right, two replicates)
13Waste and Biomass Valorization
Release of Contaminants allows us to assume that no significant preferential pathways
existed throughout the lysimeter experiments.
The irrigation scheme resulted in unsaturated conditions in The release of contaminants in the four conducted leach-
the lysimeters. Since the day of weekly irrigation changes ing tests was generally low and above 1% only for the alka-
randomly, the collected eluate volume in the 2-week sam- line or alkaline earth elements Na, K, Ca, and Sr, as well as
pling periods fluctuated, too. The collected eluate volume for the anions chloride and sulfate, see Table 3. Although the
was 1568 ± 226 mL on average for both lysimeters in all the same initial material was used in all leaching experiments,
experiments, i.e., it took approximately 12 weeks (12 irriga- the release of contaminants differs for some substances con-
tion and 6 sampling events) and an L/S span of about 0.16 to siderably, e.g. Al, Cr, Sb, Sn, and Zn. But the variation is
exchange one pore volume (18.4 L). not significant (max. value/min. value < 2) for Ca, Cu, K,
It turned out during the period of the tracer experiment Na, Sr, and sulfate. All the results from the four leaching
that the well measurable breakthrough (c/c0 > 0.1) of the tests are displayed in Fig. 3. Plotting all data in a log/log-
bromide tracer took a span of 5 sampling events and 0.13 diagram resulted in a fitted straight line with a slope of 1.09
difference in the L/S. and an intercept of 2.89 (y = 0.0013x1.09, with y = release
The bromide concentration then increased to a maximum and x = total content) with a fair correlation of 48%, see the
of about 870 mg/L after an L/S difference of 0.73 or after dotted line in Fig. 3. This behavior proves that all that can be
exchanging about 2.4 pore volumes. The full concentration predicted from the content is the magnitude of the release of
of bromide in the leachant was not measured in the elu- a certain element. Similar findings were obtained in the work
ates, probably due to sorption to the sample. After switching of Yin et al. [45]. Their correlation was in the range of 50%
back to the original composition of the AR (see Table S1), with somewhat lower slopes and intercepts. However, the
the bromide concentration decreased again, but was still authors performed leaching experiments at a L/S ratio of 10
enhanced (approximately 270 mg/L) after an L/S difference L/kg) only, at natural pH and several other static pH values.
of 0.2 (i.e., definitely more than one pore volume) at the time In batch tests, it is not possible to obtain any information
of writing this manuscript. Overall, the tracer experiment on the time-dependent release of a certain element, i.e., the
Table 3 Release of Bottom ash L/S 2 L/kg L/S 2.96 L/kg L/S 9.6 L/kg L/S 10 L/kg Min./max.
contaminates with incineration (0.25–60 mm) batch test lysimeter column test batch test
bottom ash in four different
leaching tests Content mg/kg % release % release % release % release
Al 36,310.0 0.003 0.004 0.075 0.182 50.7
As 4.3 0.627 0.006 0.233 102.3
Ba 1725.6 0.013 0.009 0.033 0.181 20.5
Ca 90,678.4 1.702 1.467 2.364 2.161 1.5
Cd 4.6 0.002 0.009 3.9
Co 64.1 0.076
Cr 436.9 0.002 0.010 0.055 0.032 5.8
Cu 3725.0 0.008 0.006 0.009 0.008 1.5
Fe 57,188.2 4.984E−04 9.439E−05 1.399E−05 35.6
K 2414.0 5.074 11.144 7.144 13.422 2.6
Mg 7694.4 0.018 0.003 0.010 0.019 6.0
Mn 1098.2 0.000 0.000 1.8
Mo 18.4 3.824 1.014 4.977 4.9
Na 6770.8 5.338 6.947 4.943 9.216 1.4
Ni 249.3 0.006 0.033 5.3
Pb 1062.4 4.560E−05
Sb 47.9 0.670 0.033 0.322 0.364 20.2
Sn 40.1 0.419 0.007 0.202 63.0
Sr 293.0 2.474 2.530 3.344 4.355 1.8
V 56.2 0.029 0.211 0.148 7.2
Zn 3413.4 1.172E−04 1.255E−03 7.617E−04 0.006 52.5
Cl 4236.2 53.628 37.315 29.887 46.739 2.8
SO4 8415.9 29.498 31.474 46.492 36.359 1.6
13Waste and Biomass Valorization
Fig. 3 Release of various cations and anions in four different leaching tests as a function of total content. There is only a fair correlation between
total content and release of the respective substances
release at other L/S ratios than that of the designated test. In release of antimony (Sb) was in the range of 2 µg/L for
column test and lysimeter investigations, leachate rates can the first 10,000 h of the experiment (L/S = 0.8 L/kg). Then
be obtained at different L/S ratios. Usually it is observed that a steep increase to 10 and more µg/L was observed. In
the highest concentrations are measured in the beginning of the same period, the Ca concentration dropped from val-
the experiment at low L/S ratios. Then the concentrations ues around 2000 mg/L to less than 500 mg/L, see Fig. 4.
drop to lower values. This behavior is displayed in Fig. S1 The reason for this is the proceeding carbonization of the
(Supporting Material) for chloride and copper. The cumu- material resulting in the formation of sparingly soluble
lative release can be calculated from the individual results CaCO3 from better soluble Ca compounds such as C aCl2
by simply adding the values of the fractions. In the case or Ca(OH)2.
of chloride, the cumulative release curve reaches an almost A correlation of Ca and Sb concentration was first
constant value soon, whereas for other elements the cumu- reported for a landfill leachate by Johnson et al. [24].
lative release increases on a longer time scale because the According to their results, the solubility of heavy metal
release does not approach a value close to zero [46, 47]. The oxyanions such as Sb(OH)6− could be controlled by Ca
concentration curves of chloride, sulfate, Ca, Sr, Ba, Cr, Mo, metallates. Plotting the measured concentrations of antimony
Cu, Sb, and V for the lysimeter and column experiments, versus the Ca concentration reveals the direct relation, see
together with the curves of cumulative release, are dis- Fig. 5. Johnson et al. proposed Ca(Sb(OH)6)2 as a solubility
played in the supporting material of this publication (Figs. controlling phase [24] with a Sb/Ca ratio of 2. However,
S2–S5). The concentrations of the illustrated substances in other Sb/Ca ratios, as well, are discussed in the literature
the eluates were all well above the respective LOQ (limits [23, 48], i.e., Sb/Ca = 2/1.13. Using the Solver module,
of quantification). It can be seen in the Figs. S2 and S4 for the experimental data for Sb and Ca from the lysimeter
these substances that the overall agreement between the two experiments were entered in a Microsoft Excel table (EA,
parallel lysimeter and column tests is quite good. evolutionary algorithm) according to the following equation
For some substances which are not illustrated the con- describing the solubility of Sb as a function of Ca:
centrations were not measurable (Hg, Mn) or very low and ]m [ ]2
KL = Ca2+ Sb(OH)−6
[
partly in the range of the respective LOQ which might have
influenced the variance of concentrations. This applies par-
ticularly for Cd. with KL the solubility product of calcium antimonate.
In the lysimeter experiment, a considerably different The best fit resulted in a value of 5.0 × 10⁻¹⁹ for K
L and
behavior of antimony and vanadium was observed. The 1.78 for the exponent m, see Fig. 5, left. With these values,
13Waste and Biomass Valorization
20 3000
18
2500
16
14
Concentration Ca [mg/L]
2000 Lys1
Concentration Sb [µg/L]
12
10 1500 Lys2
8
1000
6 Lys1
4
Lys2 500
2
0 0
0.0 0.5 1.0 1.5 2.0 2.5 3.0 0.0 0.5 1.0 1.5 2.0 2.5 3.0
L/S [L/kg dm] L/S [L/kg dm]
Fig. 4 Concentration of Sb and Ca as a function of the L/S ratio
1.40E-07 1.40E-03
1.20E-07 1.20E-03
1.00E-07 1.00E-03
Sb [mol/l]
8.00E-08 8.00E-04
V [mol/L]
6.00E-08 6.00E-04
4.00E-08 4.00E-04
2.00E-08 2.00E-04
0.00E+00 0.00E+00
0 0.02 0.04 0.06 0.08 0 0.02 0.04 0.06 0.08
Ca [mol/l] Ca [mol/L]
Fig. 5 Concentration of antimony and vanadium in the lysimeter experiment as a function of Ca concentration (circles). The crosses are the
result of a fit, see text
the chemical formula to balance positive and negative (2.8 × 10 –3 to 68.3 × 10 –3 mol/L) and the Sb concentra-
charges would be Ca(Sb(OH)6)2 × Ca0.78(OH)1.56. tions lower (0.1 × 10⁻⁷—1.3 × 10⁻⁷ mol/L). The lower Sb
Vanadium showed a comparable behavior in the lysimeter release might be due to the slight reduction of Sb in the
experiment, so that CaV2O6 could be assumed as a solubility tested mineral fraction as a result of enrichment of Sb in
controlling phase [49]. The best fit of the experimental data the filter cake, see Table 2.
was achieved with KL = 5.5 × 10⁻¹¹ and exponent m = 1.76, The solubility of antimony could surely also be influ-
see Fig. 5, right. enced by other solid phases controlling the solubility of Sb
]m that are involved in the present experiment [26] or by other
KL = Ca2+ [V2 O6 ]
[
parameters such as alkalinity, carbonate concentration, or
pH. The variation of pH in the lysimeter experiment inves-
The release of antimony and vanadium from bottom ash
tigation ranged between 8.5 and 10.5. In this limited pH
is clearly related to the concentration of calcium, as can be
range no clear correlation of pH and Sb concentration was
seen in Fig. 5. This has already been shown for antimony
observable. Influence of pH on the solubility of Sb in bot-
in the work of Johnson et al. [24]. Measured Sb concen-
tom ash was discussed in the literature [23]. The data from
trations in landfill leachates (Swiss bottom ash mono-
a field study by Sormunen et al. suggest that high Sb con-
fill) were in the range of 1.1 × 10⁻⁷ to 4.7 × 10⁻⁷ mol/L.
centrations occur when the amount of seepage water is low
The respective Ca concentrations were in a narrow range
and at pH values below 9 [20] (range investigated 8–11.5).
between 3.2 × 10 –3 and 16.2 × 10 –3 mol/L. In the pre-
However, the authors did not analyze the leachates for Ca.
sent work, the range of the Ca concentration was wider
13Waste and Biomass Valorization
The German draft ordinance for reuse of mineral waste that contain sulfate. Wet processing could improve the
[8] defines three recovery categories (HMVA-1, HMVA- quality of the secondary building material [50], but there are
2, HMVA-3) with decreasing demands on the release of reservations due to greater effort and, in the end, higher cost.
hazardous substances. The limit values for Sb concentration Antimony is present in residues from municipal solid
at an L/S of 2 L/kg using column tests or batch tests (DIN waste incineration [25]. The investigation of the long-term
19528 or DIN 19529) are 10, 60 and 150 µg/L respectively. leaching behavior of Sb was possible only in column and
The concentration of Sb in µg/L at L/S 2 L/kg can be lysimeter experiments and not in batch tests where temporal
retrieved from the value at L/S 2 L/kg on the cumulated resolution of the results cannot be obtained. An increase
release curve in mg/kg and dividing by 2 L/kg. The release of the Sb concentration was observed in the lysimeter
at L/S 2 L/kg for Sb in the lysimeter experiments is about experiment after 10,000 h at an L/S ratio of 0.75 L/kg and
0.015 mg/kg (see Fig. S5 in Supporting Information). in the column experiment at a L/S ratio of 4. The basic
Thus, the corresponding concentration can be calculated to characterization of waste materials according to DIN 19528
7.5 µg/L, close to the limit value of HMVA-1. The limit [33] with L/S ratios of 0.3, 1, 2, and 4 L/kg is therefore
value would be exceeded if the concentration at the final appropriate for revealing complex solubility behavior, rather
L/S of the experiment (2.96 L/kg) was taken for evaluation than the simpler compliance test up to an L/S of 2 L/kg only.
(release 0.026 mg/kg, resulting concentration 13 µg/L). In The leaching behavior of Sb might be critical in view of
case of V the limit value of HMVA-1 is also close to the reuse scenarios with comparably stringent limit values for Sb
limit value (limit values: 55, 150 and 200 µg/L; release such as planned in Germany (10 µg/L) [8], due to increasing
at L/S 2 L/kg = 0.063 mg/kg, resulting concentration is release of Sb with decreasing concentrations of Ca. The
31.5 µg/L). cumulative release of Sb at L/S 2.96 L/kg was 0.026 mg/
Limit value of HMVA-1 for Sb is exceeded in the kg dry matter (dm) and is still increasing. This could be an
standardized column test at an L/S of 2 L/kg (DIN 19528) effect of the removal of the finest fraction by wet treatment
with a concentration of 13 µg/L for Sb (cumulative release which contains approximately 20% of the initial Ca content.
0.026 mg/kg, see Figure S3 in Supporting Information). The addition of Ca compounds might not solve the problem,
With 13 µg/L for V, the concentration is below the limit because in the longer term any calcium species will be
values. transformed to sparingly soluble limestone anyway. Perhaps
The results from lysimeter experiment are closer to real additives containing iron, which lead to adsorption of Sb, to
field conditions than the column test due to larger sample iron hydroxide, or to the formation of Fe-antimonates, could
size and overhead irrigation rather than up-flow conditions. be an alternative [26]. However, further research is needed to
However, for the assessment of the environmental identify possible countermeasures for avoiding harmful Sb
compatibility the column test according to DIN 19528 is release in a later stage of the lifetime of constructions based
legally binding in Germany. Therefore, holding the German on waste materials.
limit value of Sb of HMVA-1 might be problematic for
MSWI BA, especially due to the inhomogeneous nature of Acknowledgements Open Access funding provided by Projekt DEAL.
Part of the work was funded with the Central Innovation Programme
material. In the present investigation the wet treatment of the for SMEs (ZIM) of the German Federal Ministry for Economic Affairs
ash could have an influence on Sb mobilization because the and Energy (HORECA, KF 2201051MF2)
Ca content is lower in the treated ash (high Ca content in the
filter cake, see Table 2). As explained above concentration Compliance with Ethical Standards
of Ca controls the mobilization of Sb.
Conflict of interest The authors declare that they have no conflict of
interest.
Conclusions
Open Access This article is licensed under a Creative Commons Attri-
bution 4.0 International License, which permits use, sharing, adapta-
The leaching experiments showed that the aim to reduce tion, distribution and reproduction in any medium or format, as long
Cl− and S O42− concentrations in the leachates by the wet as you give appropriate credit to the original author(s) and the source,
treatment technology could be reached [14], in contrast provide a link to the Creative Commons licence, and indicate if changes
were made. The images or other third party material in this article are
to untreated MSWI BA. More than 60% of the sulfate is included in the article’s Creative Commons licence, unless indicated
accumulated in the filter cake. This is an important effect otherwise in a credit line to the material. If material is not included in
when considering the suitability of the intended reuse of the article’s Creative Commons licence and your intended use is not
such material in construction. This finding might be even permitted by statutory regulation or exceeds the permitted use, you will
need to obtain permission directly from the copyright holder. To view a
more important for the treatment of construction and copy of this licence, visit http://creativecommons.org/licenses/by/4.0/.
demolition (C&D) waste. Sulfate content in C&D waste is
increasing because of the increasing use of building products
13Waste and Biomass Valorization
References 16. Hyks, J., Hjelmar, O.: Utilisation of incineration bottom ash
(IBA) from waste incineration: prospects and limits. In: Holm,
O., Thome-Kozmiensky, E. (eds.) Removal, Treatment and Utili-
1. Eurostat: Municipal Waste Statistics: Statistics Explained
sation of Waste Incineration Bottom Ash, pp. 11–24. TK Verlag,
(23/01/2019). https://ec.europa.eu/eurostat/statistics-explained/
Neuruppin (2018)
pdfscache/10360.pdf (2019).
17. van der Sloot, H.A., Kosson, D.S.: Use of characterisation leach-
2. Di Gianfilippo, M., Hyks, J., Verginelli, I., Costa, G., Hjelmar,
ing tests and associated modelling tools in assessing the hazardous
O., Lombardi, F.: Leaching behaviour of incineration bottom ash
nature of wastes. J. Hazard. Mater. 207–208, 36–43 (2012). https
in a reuse scenario: 12years-field data vs. lab test results. Waste
://doi.org/10.1016/j.jhazmat.2011.03.119
Manage. 73, 367–380 (2018). https://doi.org/10.1016/j.wasma
18. Hjelmar, O., Holm, J., Crillesen, K.: Utilisation of MSWI bottom
n.2017.08.013
ash as sub-base in road construction: first results from a large-
3. Luo, H., Cheng, Y., He, D., Yang, E.-H.: Review of leaching
scale test site. J. Hazard. Mater. 139(3), 471–480 (2007). https://
behavior of municipal solid waste incineration (MSWI) ash. Sci.
doi.org/10.1016/j.jhazmat.2006.02.059
Total Environ. 668, 90–103 (2019). https: //doi.org/10.1016/j.scito
19. Izquierdo, M., Querol, X., Josa, A., Vazquez, E., López-Soler, A.:
tenv.2019.03.004
Comparison between laboratory and field leachability of MSWI
4. Silva, R.V., de Brito, J., Lynn, C.J., Dhir, R.K.: Environmental
bottom ash as a road material. Sci. Total Environ. 389(1), 10–19
impacts of the use of bottom ashes from municipal solid waste
(2008). https://doi.org/10.1016/j.scitotenv.2007.08.020
incineration: a review. Resour. Conserv. Recycl. 140, 23–35
20. Sormunen, L.A., Kaartinen, T., Rantsi, R.: MSWI BA treated with
(2019). https://doi.org/10.1016/j.resconrec.2018.09.011
Advanced Dry Recovery: a field scale study on materials’ leaching
5. Verbinnen, B., Billen, P., Van Caneghem, J., Vandecasteele,
properties. Int. J. Sustain. Eng. 11(4), 261–271 (2018). https: //doi.
C.: Recycling of MSWI bottom ash: a review of chemical bar-
org/10.1080/19397038.2018.1444679
riers, engineering applications and treatment technologies.
21. Holm, O., Simon, F.G.: Innovative treatment trains of bottom
Waste Biomass Valoriz 8(5), 1453–1466 (2017). https: //doi.
ash (BA) from municipal solid waste incineration (MSWI) in
org/10.1007/s12649-016-9704-0
Germany. Waste Manage. 59, 229–236 (2017). https: //doi.
6. Xuan, D., Tang, P., Poon, C.S.: Limitations and quality upgrad-
org/10.1016/j.wasman.2016.09.004
ing techniques for utilization of MSW incineration bottom ash
22. Sormunen, L.A., Kalliainen, A., Kolisoja, P., Rantsi, R.: Combin-
in engineering applications: a review. Constr. Build. Mater.
ing mineral fractions of recovered MSWI bottom ash: improve-
190, 1091–1102 (2018). https://doi.org/10.1016/j.conbuildma
ment for utilization in civil engineering structures. Waste Biomass
t.2018.09.174
Valoriz. 8(5), 1467–1478 (2017). https://doi.org/10.1007/s1264
7. Sormunen, L.A., Kolisoja, P.: Construction of an interim storage
9-016-9656-4
field using recovered municipal solid waste incineration bottom
23. Cornelis, G., Gerven, T.V., Vandecasteele, C.: Antimony leach-
ash: field performance study. Waste Manage. 64, 107–116 (2017).
ing from MSWI bottom ash: modelling of the effect of pH and
https://doi.org/10.1016/j.wasman.2017.03.014
carbonation. Waste Manage. 32(2), 278–286 (2012). https://doi.
8. BMUB: 4: Referentenentwurf der Mantelverordnung: Verord-
org/10.1016/j.wasman.2011.09.018
nung zur Einführung einer Ersatzbaustoffverordnung, zur Neu-
24. Johnson, C.A., Kaeppeli, M., Brandenberger, S., Ulrich, A., Bau-
fassung der Bundes-Bodenschutz- und Altlastenverordnung und
mann, W.: Hydrological and geochemical factors affecting lea-
zur Änderung der Deponieverordnung und der Gewerbeabfallver-
chate composition in municipal solid waste incinerator bottom
ordnung, Stand: 06.02.2017. (2017)
ash: Part II. The geochemistry of leachate from Landfill Lostorf,
9. European Commission: M/366 Horizontal Complement to
Switzerland. J. Contam. Hydrol. 40(3), 239–259 (1999). https://
the Mandates for the Development of Horizontal Standardised
doi.org/10.1016/S0169-7722(99)00052-2
Assessment Methods for Harmonised Approaches Relating to
25. Okkenhaug, G., Almås, Å.R., Morin, N., Halea, S.E., Arp, H.P.H.:
Dangerous Substances under the Construction Products Direc-
The presence and leachability of antimony in different wastes and
tive (cpd) (2005)
waste handling facilities in Norway. Environ. Sci. Process Impacts
10. CEN/TS 16637–3: Construction Products: Assessment of Release
17(11), 1880–1891 (2015). https: //doi.org/10.1039/C5EM00 210A
of Dangerous Substances: Part 3: Horizontal Up-Flow Percolation
26. Van Caneghem, J., Verbinnen, B., Cornelis, G., de Wijs, J.,
test European Committee for Standardization (2016)
Mulder, R., Billen, P., Vandecasteele, C.: Immobilization of anti-
11. Dijkstra, J.J., van Zomeren, A., Susset, B.: Technical Principles
mony in waste-to-energy bottom ash by addition of calcium and
Underlying Limit Values for Release of Substances for the Per-
iron containing additives. Waste Manage. 54, 162–168 (2016).
colation Test TS3: Comparison DE and NL. https://www.nen.nl/
https://doi.org/10.1016/j.wasman.2016.05.007
Standa rdiza tion/ Join-us/Techni cal-commit tees- and-new-subjec ts/
27. Susset, B., Grathwohl, P.: Leaching standards for mineral recy-
TC-ConstructionBuilding/CENTC-351-EN.htm (2013)
cling materials: a harmonized regulatory concept for the upcom-
12. Burnley, S.J.: A review of municipal solid waste composition in
ing German Recycling Decree. Waste Manage. 31(2), 201–214
the United Kingdom. Waste Manage. 27(10), 1274–1285 (2007).
(2011). https://doi.org/10.1016/j.wasman.2010.08.017
https://doi.org/10.1016/j.wasman.2006.06.018
28. DIN 66137-2: Determination of solid state density—Part 2:
13. Hyks, J., Astrup, T.: Influence of operational conditions, waste
Gaspycnometry (Bestimmung der Dichte fester Stoffe—Teil
input and ageing on contaminant leaching from waste incinerator
2: Gaspyknometrie). German Institute for Standardization
bottom ash: a full-scale study. Chemosphere 76(9), 1178–1184
(Deutsches Institut für Normung) (2004)
(2009). https://doi.org/10.1016/j.chemosphere.2009.06.040
29. DIN 18128: Soil—Investigation and testing—Determination of
14. Keulen, A., van Zomeren, A., Harpe, P., Aarnink, W., Simons,
ignition loss (Baugrund—Untersuchung von Bodenproben—
H.A.E., Brouwers, H.J.H.: High performance of treated and
Bestimmung des Glühverlustes). German Institute for Standardi-
washed MSWI bottom ash granulates as natural aggregate replace-
zation (Deutsches Institut für Normung) (2002)
ment within earth-moist concrete. Waste Manage. 49, 83–95
30. DIN ISO 11466: Soil quality—Extraction of trace elements solu-
(2016). https://doi.org/10.1016/j.wasman.2016.01.010
ble in aqua regia (Bodenbeschaffenheit—Extraktion in Königs-
15. Astrup, T.: Pretreatment and utilization of waste incineration bot-
wasser löslicher Spurenelemente). German Institute for Stand-
tom ashes: Danish experiences. Waste Manage. 27(10), 1452–
ardization (Deutsches Institut für Normung) (1997)
1457 (2007). https://doi.org/10.1016/j.wasman.2007.03.017
13Waste and Biomass Valorization
31. DIN EN ISO 10693: Soil quality—Determination of carbonate spectroscopy (ICP-OES) (Wasserbeschaffenheit—Bestim-
content—Volumetric method (Bodenbeschaffenheit—Bestim- mung von ausgewählten Elementen durch induktiv gekoppelte
mung des Carbonatgehaltes—Volumetrisches Verfahren). German Plasma-Atom-Emissionsspektrometrie (ICP-OES)), German Insti-
Institute for Standardization (Deutsches Institut für Normung) tute for Standardization (Deutsches Institut für Normung) (2009)
(2014) 41. DIN EN ISO 10304-1: Water quality—Determination of dis-
32. Sanusi, A., Wortham, H., Millet, M., Mirabel, P.: Chemical com- solved fluoride, chloride, nitrite, orthophosphate, bromide, nitrate
position of rainwater in Eastern France. Atmos. Environ. 30(1), and sulfate ions, using liquid chromatography of ions—Part 1:
59–71 (1996). https://doi.org/10.1016/1352-2310(95)00237-S Method for water with low contamination (Wasserbeschaffen-
33. DIN 19528: Leaching of solid materials—Percolation method for heit—Bestimmung der gelösten Anionen Fluorid, Chlorid, Nitrit,
the joint examination of the leaching behaviour of organic and Orthophosphat, Bromid, Nitrat und Sulfat mittels Ionenchroma-
inorganic substances for materials with a particle size upto 32 tographie—Teil 1: Verfahren für gering belastete Wässer). Ger-
mm—Basic characterization using a comprehensive column test man Institute for Standardization (Deutsches Institut für Nor-
and compliance test using a quick column test (Elution von Fest- mung) (1995)
stoffen—Perkolationsverfahren zur gemeinsamen Untersuchung 42. DIN EN ISO 17294-2: Water quality—Application of inductively
des Elutionsverhaltens von organischen und anorganischen Stoffen coupled plasma mass spectrometry (ICP-MS)—Part 2: Determi-
für Materialien mit einer Korngröße bis 32 mm—Grundlegende nation of selected elements including uranium isotopes (Wasser-
Charakterisierung mit einem ausführlichen Säulenversuch und beschaffenheit—Anwendung der induktiv gekoppelten Plasma-
Übereinstimmungsuntersuchung mit einem Säulenschnelltest). Massenspektrometrie (ICP-MS) —Teil 2: Bestimmung von 62
German Institute for Standardization (Deutsches Institut für Nor- Elementen). German Institute for Standardization (Deutsches
mung) (2009) Institut für Normung) (2005)
34. DIN 19529: Leaching of solid materials—Batch test for the 43. Dijkstra, J.J., van der Sloot, H.A., Comans, R.N.J.: The leaching
examination of the leaching behaviour of inorganic and organic of major and trace elements from MSWI bottom ash as a function
substances at a liquid to solid ratio of 2 l/kg (Elution von Feststof- of pH and time. Appl. Geochem. 21(2), 335–351 (2006)
fen—Schüttelverfahren zur Untersuchung des Elutionsverhaltens 44. Simon, F.G., Schmidt, V., Carcer, B.: Alterungsverhalten von
von anorganischen und organischen Stoffen mit einem Wasser/ MVA-Schlacken. Müll Abfall 27(11), 759–764 (1995)
Feststoff-Verhältnis von 2 l/kg). German Institute for Standardiza- 45. Yin, K., Chan, W.P., Dou, X., Ren, F., Chang, V.W.-C.: Measure-
tion (Deutsches Institut für Normung) (2015) ments, factor analysis and modeling of element leaching from
35. DIN EN 12457-2: Characterization of waste—Leaching; Compli- incineration bottom ashes for quantitative component effects. J.
ance test for leaching of granular and sludges—Part 2: One stage Clean. Prod. 165, 477–490 (2017). https://doi.org/10.1016/j.jclep
batch test at a liquid to solid ratio of 10 l/kg with particle size ro.2017.07.164
below 4 mm (without or with size reduction) (Charakterisierung 46. Krüger, O., Kalbe, U., Berger, W., Simon, F.G., López Meza, S.:
von Abfällen—Auslaugung; Übereinstimungsuntersuchung für Leaching experiments on the release of heavy metals and PAH
die Auslaugung von körnigen Abfällen und Schlämmen—Teil from soil and waste materials. J. Hazard. Mater. 207–208, 51–55
2: Einstufiges Schüttelverfahren mit einem Flüssigkeits-/Festst- (2012). https://doi.org/10.1016/j.jhazmat.2011.02.016
offverhältnis von 10 l/kg und einer Korngröße unter 4 mm (ohne 47. López Meza, S., Kalbe, U., Berger, W., Simon, F.G.: Effect of con-
oder mit Korngrößenreduzierung)). German Institute for Stand- tact time on the release of contaminants from granular waste mate-
ardization (Deutsches Institut für Normung) (2003) rials during column leaching experiments. Waste Manage. 30(4),
36. DIN EN ISO 5667-3: Water quality—Sampling—Part 3: Guid- 565–571 (2010). https://doi.org/10.1016/j.wasman.2009.11.022
ance on the preservation and handling of water samples (Was- 48. Cornelis, G., Gerven, T.V., Snellings, R., Verbinnen, B., Elsen, J.,
serbeschaffenheit—Probenahme—Teil 3: Anleitung zur Konser- Vandecasteele, C.: Stability of pyrochlores in alkaline matrices:
vierung und Handhabung von Wasserproben). German Institute solubility of calcium antimonate. Appl. Geochem. 26(5), 809–817
for Standardization (Deutsches Institut für Normung) (2013) (2011). https://doi.org/10.1016/j.apgeochem.2011.02.002
37. DIN ISO 10390: Soil quality—Determination of pH (Bodenbe- 49. Parhi, P., Upreti, S., Ramanan, A.: Crystallization of calcium
schaffenheit—Bestimmung des pH-Wertes). German Institute for vanadate solids from solution: a metathetic route. Cryst. Growth
Standardization (Deutsches Institut für Normung) (2005) Des. 10(12), 5078–5084 (2010). https://doi.org/10.1021/cg100
38. DIN ISO 11265: Soil quality—Determination of the specific 703h
electrical conductivity (Bodenbeschaffenheit—Bestimmung der 50. Weimann, K., Giese, L.B., Mellmann, G., Simon, F.G.: Building
spezifischen elektrischen Leitfähigkeit). German Institute for materials from waste. Mater. Trans. 44(7), 1255–1258 (2003).
Standardization (Deutsches Institut für Normung) (1997) https://doi.org/10.2320/matertrans.44.1255
39. DIN EN ISO 7027: Water quality—Determination of turbidity
(Wasserbeschaffenheit—Bestimmung der Trübung). German Publisher’s Note Springer Nature remains neutral with regard to
Institute for Standardization (Deutsches Institut für Normung) jurisdictional claims in published maps and institutional affiliations.
(2000)
40. DIN EN ISO 11885: Water quality—Determination of selected
elements by inductively coupled plasma optical emission
Affiliations
Ute Kalbe1 · Franz‑Georg Simon1
1
* Ute Kalbe Bundesanstalt für Materialforschung und-prüfung (BAM),
ute.kalbe@bam.de Unter den Eichen 87, 12205 Berlin, Germany
13Electronic supplementary material
Waste and Biomass Valorization, Springer
Potential use of incineration bottom ash in construction – Evaluation
of the environmental impact
Ute Kalbe and Franz-Georg Simon
Bundesanstalt für Materialforschung und -prüfung (BAM), Unter den Eichen 87,
12205 Berlin, Germany
Corresponding author: ute.kalbe@bam.de
Table S1: Composition of artificial rainwater (AR)
Substance Concentration
(µmol/L)
KCl 40.0
CaSO4·2H2O 50.0
NH4Cl 39.9
NaNO3 60.0
MgSO4·7H2O 10.0
HNO3 (63%) 2.0
pH 5.7
1Fig. S1: Concentrations of chloride and calcium in leachate fractions taken from two replicates of
laboratory-scaled lysimeter experiments (Lys1, Lys2) at increasing L/S (liquid to solid) ratios
10000
8000
Concentration chloride [mg/L]
6000 Lys1
Lys2
4000
2000
0
0.0 0.5 1.0 1.5 2.0 2.5 3.0
L/S [L/kg dm]
800
600
Concentration Cu [µg/L]
Lys1
400
Lys2
200
0
0.0 0.5 1.0 1.5 2.0 2.5 3.0
L/S [L/kg dm]
2Fig. S2: Concentration of substances in eluate fractions taken from column percolation experiments
(two replicates S1, S2) at increasing L/S ratios using demineralized water MilliQ) and artificial rain
(AR) as eluent
3Figure S3: Cumulative release of substances as a function of L/S ratio in column percolation
experiments (two replicates S1, S2) using demineralized water (MilliQ) and artificial rain (AR) as
eluent
4Fig. S4: Concentration of substances in eluate fractions taken at increasing L/S ratios in lysimeter
experiments using artificial rain (AR) as eluent (two replicates Lys1, Lys2)
5Fig. S5: Cumulative release of substances as a function of L/S ratio in a lysimeter experiments using
artificial rain (AR) as eluent (two replicates Lys1, Lys2)
6You can also read