Scavenging malachite green dye from aqueous solution using durian peel based activated carbon
←
→
Page content transcription
If your browser does not render page correctly, please read the page content below
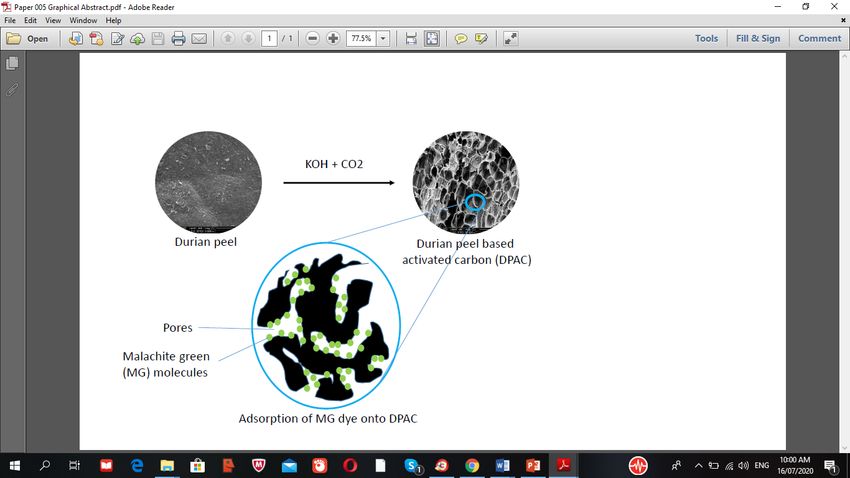
Yusop et al. / Malaysian Journal of Fundamental and Applied Sciences Vol. 17, No. 1 (2021) 95-103

 RESEARCH ARTICLE

Scavenging malachite green dye from aqueous solution using durian
peel based activated carbon
Mohamad Firdaus Mohamad Yusopa, Mohd Azmier Ahmada,*, Nur Ayshah Roslia, Fadzil Noor
Gonawana, Soran Jalal Abdullahb
a
 School of Chemical Engineering, Engineering Campus, Universiti Sains Malaysia, 14300 Nibong Tebal, Penang, Malaysia
b
 Department of Technology, Faculty of Innovative Design and Technology, Universiti Sultan Zainal Abidin, Gong Badak Campus, 21300 Kuala
 Nerus, Terengganu, Malaysia

* Corresponding author: chazmier@usm.my

 Article history Abstract
 Received 15 July 2020
 Revised 8 October 2020 Physiochemical activation consists of heat treatment coupling with CO2 gasification and KOH chemical
 Accepted 22 October 2020 treatment were applied in preparing durian peel based activated carbon (DPAC) to remove basic dye,
 malachite green (MG) from aqueous solution. Several parameters namely, effect of initial MG
 Graphical abstract concentration as well as contact time, solution temperature and initial solution pH were carried out in
 this study. Characterization study revealed that DPAC pose high BET surface area which is 886.31
 m2/g and its surface was found to be mesoporous in nature with heterogeneous type of pore structures.
 Eight isotherms and four kinetic models were utilized and it was revealed that the adsorpttion system
 followed Freundlich isotherm and pseudo-first order (PFO) kinetic model. Mechanism study using
 intraparticle diffusion and Boyd plot confirmed that adsorption of MG onto DPAC was controlled by the
 film-diffusion mechanism. Thermodynamic study indicated that the adsorption system was exothermic,
 spontaneous, feasible and governed by physical-type of adsorption.
 .
 Keywords: Adsorption, Activated Carbon, Malachite Green, Physicochemical Activation

 © 2021 Penerbit UTM Press. All rights reserved

INTRODUCTION such as cytotoxic, genotoxic and mutagenic (Bhatti et al., 2017). Not
 only in their original form, but the it breakdown products also can be
 Growing demand of clothes from increasing population around the toxic and carcinogenic to the aquatic life (Zhou et al., 2019). Hence, it
globe had accelerates the development in textile industries. This is essential to treat MG wastewater before entering the environment.
development is directly proportional to the dyes production. Dyes are Dyes removal techniques can be categorized into biological,
essential in giving a final beautification touch to the products (Aderemi chemical and physical treatments. Biological treatment can be further
et al., 2018). It is estimated that 100,000 dissimilar kind of dyes are subcategorized into two types; (i) aerobic process which require oxygen
commercially exist with yearly production of 0.7 million tons (Vega- for bacteria to perform degradation process (Khouni et al., 2020, Zhu
Negron et al., 2018). Textile industries encompass an integrated activity et al., 2020) and (ii) anaerobic process which operates in the absence of
ranging from pre-treatment, polymerization, spinning, texturizing, air (Bai et al., 2020, Berkessa et al., 2020). Although biological
dyeing, printing and made up textile goods. In dyeing operation, most treatment has advantages such as low cost and absence of chemical
of the wastewater comes from wash water, followed by spent dye bath. waste production, the dyes are not biologically degradable since
Due to dyes’ solubility in water, they are easily lost in the effluent microorganisms do not utilize the dyes as a source of food. Chemical
during the dyeing processing step (Ahmad et al., 2015). This has been treatment includes the use of coagulation and flocculation agent in
a major concern as it can promote eutrophication and reduce the removing dyes from wastewater. However, this method is ineffective
aesthetic value of the water bodies. Furthermore, the existence of dyes to treat dyes that have high solubility in water. Other examples of
in environment may hurt the textile industries due to their failure to chemical treatments are oxidation process (Mota et al., 2020),
comply with ISO 14000 certification of quality standard specifications photochemical (Bahadori et al., 2020) and electrochemical degradation
(Ayanda et al., 2018). (Pereira et al., 2020). The major drawback in chemical treatment is that
 One of the most popular dye utilized in textile industries is its application can cause concentrated sludge to accumulate, thus
malachite green (MG), a dye that belongs to basic dye group and known required a further treatment or disposal method.
as cationic dye. It produces colored cation in solution due to the present Physical treatments on the other hand, comprises of adsorption
of positively charged nitrogen or sulfur atom. MG is applied to paper, process. Posing several advantages such as simplicity in design, fast,
polyacrylonitrile, modified nylons, polyesters, silk, wool and tannin- easy to operate, relatively low operating cost and stable towards toxic
mordanted cotton by forming salt linkages (ionic bonds) with anionic substance had cause adsorption process to be a popular choice in
groups in the fiber. Despite of its versatility, numerous concerns had treating dye wastewater (Machrouhi et al., 2017). Plus, only half or
arisen regarding the expanding use of MG due to its toxicity effects quarter space is required in adsorption process compared to biological

 95
Yusop et al. / Malaysian Journal of Fundamental and Applied Sciences Vol. 17, No. 1 (2021) 95-103

system. Among of the adsorbents, activated carbon is proved to be the reached, at flow rate of 150 cm3/min and held for certain activation
most effective one as it has very porous structure resulting large surface time. The reactor was then allowed to reach room temperature with
area in range 500–2000 m2/g. This large surface area provides plenty of nitrogen gas purging through it. Hot deionized water together with 0.1
active sites for the adsorption process to take place. Commercially M hydrochloric acid were used to wash the sample in order to recover
available activated carbon is produced from non-renewable precursor excess KOH that attached to the sample. The aim in washing step is to
such as lignite and bituminous coal. These precursors are relatively obtain pH of washing solution between 6.5 and 7.
expensive, thus increasing the total production cost of activated carbon. Samples was characterized by using surface area analyzer, scanning
 There is a growing interest for researchers to convert renewable electron microscopy (SEM), simultaneous thermogravimetric analyzer
sources of agricultural wastes into adsorbent. Usually, these wastes are (STA) and Fourier transform infrared spectroscopy (FTIR).
creating disposal problem due to their limitation in application (Aziz et Characterization of DPAC was made in terms of surface area, pore
al., 2018). Examples of agricultural wastes include rice straw (Zhu et volume and average pore diameter by employing adsorption isotherm
al., 2018), kernel shell (Zhi and Zaini, 2019), coconut pith (Rahim et of nitrogen at temperature of 77 K by using surface area analyser
al., 2019), coconut flesh waste (Noor et al., 2019), maize corncob (Micromeritics, Model ASAP 2020, USA). On the other hand,
(Farnane et al., 2017), olive stone (Alslaibi et al., 2015) and African Brunauer-Emmet-Teller (BET) equation was employed to calculate
palm shell (Moreno-Marenco et al., 2020). In this study, durian DPAC’s BET surface area. SEM was used to study the surface
(Duriozibethinus L.) peel is selected to be converted into activated morphology of the sample. The analysis was carried out using a SEM
carbon. Durian is a tropical fruit that can easily found in Malaysia and analyzer (Model Quanta 450 FEG, Netherland). Proximate analysis of
other Southeast Asia countries. Due to the enormous demand of this the sample was conducted using STA (Model Perkin Elmer STA 6000,
fruit especially in Malaysia, the amount of its peel which poses no USA) whereas the surface chemistry of the sample was measured using
economic value and creating disposal problems to the community had FTIR spectroscope (Model IR Prestige 21 Shimadzu, Japan).
increased too. Thus, an effort was done in this study to convert the
durian peel (DP) into activated carbon to remove MG dye. Adsorption studies
Physiochemical activation approach comprising of heat treatment Batch equilibrium studes for MG-DPAC adsorption system was
together with CO2 gasification and KOH chemical treatment were conducted by focusing on several important parameters namely, effect
employed in this study to create durian peel based AC (DPAC) with of MG initial concentration, effect of contact time between adsorbate
good adsorbent characteristic. and adsorbent, effect of MG solution temperature and lastly, effect of
 MG solution pH. Accurately weighted 1.00 g of MG in powder form
EXPERIMENTAL was mixed with 1000 mL deionized water to produce 1000 mg/L of
 stock solution. The sample solution was withdrawn at the point of
Materials equilibrium so that the residual concentration can be determined. UV-
 Basic dye, MG used in this study as an adsorbate was obtained from Visible spectrophotometer (Model Shidmadzu UV-1800, Japan) was
Sigma-Aldrich (M) Malaysia. Its chemical formula is C23H26N2O·HCl used to measure the sample concentration at maximum wavelength of
and its molecular weight is 382.93 g/mol. Deionized water used to 615 nm. MG dye adsorbed at the point of equilibrium, qe (mg/g) was
prepare solutions was supplied by USF ELGA water treatment system. computed according to Eq. (2) and MG percetage removal was
The structural formula of MG is given in Fig. 1. calculated as expressed in Eq. (3):

 (01203 )5
 . = (2)
 6

 (?@ 2?A )
 % Removal = x 100% (3)
 ?@

 Fig. 1 Chemical structure of MG dye where Co and Ce are the MG dye concentration at initial and at
 equilibrium (mg/g), respectively, V is the volume of MG dye solution
Synthesis and characterization of DPAC (ml) and W is the mass of DPAC (g).
 The DP collected locally in the area of Seberang Jaya, Penang, 200 mL of adsorbate solutions of pre-determined initial
Malaysia was washed thoroughly to remove dirt on its surfaces. Clean concentratios (25–300 mg/L) were created and filled in six Erlenmeyer
DP was then subjected with dehydrating process at temperature of 110 flasks with a volume of 250 mL each. The mass of DPAC that was
°C by using an oven (Model Memmert 600, Germany), before being inserted in each flasks containing MG solution was fixed at 0.2 g. The
ground and sieved (size of 1-2 mm). flasks were covered with aluminium foil and loaded in an isothermal
 50 g of dried precursor was inserted in the center of the vertical water bath shaker. The speed of the rotation for the water bath shaker
tubular reactor and purging through the reactor was nitrogen gas that was fixed at 120 rpm while its temperature was held constant at 30 °C.
flows at 150 cm3/min. The temperature of the furnace was raise to 550 The process was continue until the MG concentration reading gave an
°C, then held constant for 1 hour. After that, the temperature of the indication that the equilibrium point has been reached. For this
reactor was let to decrease back to room temperature with nitrogen gas particular study, pH of MG solution was not altered.
purging through the reactor still. The resulted char was collected from To study the performance of MG-DPAC system under the influence
the reactor and was impregnated with chemical ativation agent, of temperature, MG solution temperature was change from 30 to 45 and
potassium hydroxide (KOH) at different impregnation ratio (IR), which lastly, 60 °C. At these 3 different temperature conditions, parameters
can be computed using Eq. (1): namely solution pH, rotating speed and dosage of DPAC were fixed at
 constant values.
 =
 %&'(
 (1) Similarly, the pH of MG solution was change from pH 4 to 10 in
 %)*+, order to study the adsorption performance of MG-DPAC system under
 the influence of pH. The alteration of pH of MG solution was made by
where wKOH and wchar represent the KOH pellets (dry weight) and char the aid of 0.1 M HCl (hydrochloric acid) and/or 0.1 M NaOH (sodium
(dry weight), respectively. Char and KOH pellets were mixed together hydroxide) and pH reading was obtained by using pH meter (Model
with deionized water using beaker of the size of 250 mL. The mixture Delta 320, Mettler Toledo, China). The parameters of initial MG
was agitated and then kept in oven overnight (110 °C) for dehydrating concentration, adsorbent dosage and solution temperature were fixed at
purposes. Then, the sample was loaded inside the vertical tubular 50 mg/L, 0.2 g/200 mL and 30 °C, respectively.
reactor once again, so that the activation step which is quite similar with In kinetic studies, relatively alike procedure as batch equilibrium
carbonization process, could take place. This time, nitrogen gas was studies was performed. However, the sample was taken out for reading
changed to carbon dioxide (CO2) once the activation temperature was

96
Yusop et al. / Malaysian Journal of Fundamental and Applied Sciences Vol. 17, No. 1 (2021) 95-103

at preset time interval. Quantity of MG dye removed at time t, qt was Proximate analysis for samples is tabulated in Table 2. DP contains
computed using the following equation: 20.69 % of fixed carbon which can be considered moderate and suitable
 to be converted to AC at the first place. Other agricultural wastes
 (0120F )5 contained wide range of fixed carbon from 11 % of kenaf fiber
 E = (4)
 6 (Shamsuddin et al., 2016) to 34.80 % of orange peel (Lam et al., 2017).
 After activation processes, DPAC showed a significant increase in
where Co and Ct are the MG dye concentration at initial and at time t
 fixed carbon and a drastic decreased in volatile composition. At high
(mg/g), respectively, V is the volume of MG dye solution (ml) and W is
 activation temperature, most of the volatile and moisture were removed
the mass of DPAC (g). The normalized standard deviation Δqt (%) for
 from the sample and leave behind high carbon content.
validation of kinetic model was calculated using (Weng et al., 2009):
 ∑JKLF,3NO2LF,)+P Q/LF,3NOS
 T Table 2 Proximate analysis of samples.
∆ E (%) = 100 H (5)
 (U2V)
 Sample Proximate analysis (%)
 Moisture Volatile Fixed Ash
where n is data points while measured MG and calculated MG adsorbed carbon
at time t were denoted by qt,exp and qt,cal, respectively. DP 12.70 65.22 20.69 1.39
 DP char 4.81 37.81 55.80 1.58
RESULTS AND DISCUSSION
 DPAC 1.54 23.60 73.20 1.66
Characteristics of samples
 The values of surface area (BET and mesopores) and pore The surface chemistry of DP and DPAC is given in Fig. 3. It was
characteristics (volume and diameter) for DP, DP char and DPAC were observed that DP was having bandwidth at 3233 and 3459 cm-1 (O-H
tabulated in Table 1. The surface area for DPAC was 886.31 m2/g functional group) (Ghaedi et al., 2015), 2351 cm-1 (C≡C stretching of
whereas the surface area for DP was not available since there was no alkyne group) (Georgin et al., 2016), 1647 cm-1 (C=C alkene group)
pore identified. Surface area obtained was considered average (Zhou et al., 2017), 1420 and 1498 cm-1 (C-O stretching of ether)
compared to ACs derived from Egyptian wood of 603 m2/g (Ilnicka et (Kumar and Jena, 2016), 1053 cm-1 (carboxylic acid or ester group)
al., 2020), durian seed of 980.62 m2/g (Ab Razak et al., 2015) and spent (Gautam et al., 2015) and 616-825 cm-1 (C-H out of plane bonding in
mushroom compost of 1419.11 m2/g (Karadirek and Okkay, 2018). The benzene derivatives) (Lin et al., 2017). The surface chemistry of the
average pore diameter for DPAC was 2.57 nm which belong to DPAC was contradicted from its precursor since several functional
mesopores region according to the IUPAC classification. KOH groups had shifted or disappeared after the activation processes.
impregnation and CO2 gasification applied during the activation steps Spectrum of DPAC shows that a few peaks located in the region of
had developed new pores and widening existing pores thus contributing 2351 cm-1 (C≡C alkyne group) and 1647 cm-1 (C=C alkene group) were
to the surface area enhancement in DPAC. Dehydration of KOH diminished. It was noticed that the peaks in the region of 614-827 cm-1
produced K2O which subsequently reacted with CO2 to yield K2CO3. which signified C-H out-of-plane bonding in benzene derivatives for
K2CO3 was mobile and penetrated deep into the DPAC’s skeleton and DPAC was disappeared. Aromatic group diminished because of
causing an increase to both surface area and pore volume. oxidative breakdown of benzene during pyrolysis and activation
 processes.
Table 1 Surface area and pore characteristics of samples.
 0.25
 Sample BET Mesopore Total Average
 surface surface pore pore
 1498
 area area (m2/g) volume diameter 1274 0.2
 (m2/g) (cm3/g) (nm) 616
 DP 2.07 - - - 704
 827
 DP char 177.64 85.68 0.17 2.49 DP raw 0.15
 1647
 DPAC 886.31 547.85 0.50 2.57

 Abs
 2351 1420 1055

 3459 0.1
 Fig. 2 provides the morphology of DP and DPAC. The surface of 3233
DP (Fig. 2(a)) was rough with minimal existence of small size of pores.
The surface of DPAC (Fig. 2(b)) was observed to be highly porous with DPAC
 0.05
cavities scattered irregularly across the whole surface. These
heterogeneous cavities were resulted from the evaporation of
impregnated KOH-derived compounds. Combination of CO2 and KOH 0
treatments were succeeded in aiding the well-development of pores on 4000 3500 3000 2500 2000 1500 1000 500 0
DPAC’s surface. (1/cm)

 (b) Fig. 3 FTIR spectrums for DP and DPAC.
 (a)

 Batch equilirium studies
 Figs. 4 and 5 show the MG adsorption uptake and MG removal by
 DPAC at 30 °C, respectively. In the beginning, DPAC has excess
 surface sites which were available for the adsorption to occur. The
 amount of MG adsorbed together with the MG removal were found to
 rise with time until reached the equilibrium point. This point indicated
 that DPAC had became saturated, thus no more MG dye can be
 adsorbed. Plus, the repulsion that occur between MG dye in solid phase
 10000x 10000x and bulk phase increase the difficulty of the remaining active sites on
 DPAC to be filled by MG dye. MG adsorption uptakes by DPAC was
 noticed to rise from 23.50 to 211.32 mg/g as the MG dye initial
 concentration increased from 25 to 300 mg/L. This was due to the
Fig. 2 SEM images of (a) DP and (b) DPAC.
 occurrence of larger mass transfer driving force for higher MG

 97
Yusop et al. / Malaysian Journal of Fundamental and Applied Sciences Vol. 17, No. 1 (2021) 95-103

concentration, resulted in higher MG uptake. However, as the initial Fig. 7 illustrates the influence of initial pH on the MG adsorption
concentration of adsorbate was altered from 25 to 300 mg/L, the by DPAC. The MG removal by DPAC was increased as the pH
removal of MG decreased. The MG removal of higher than 84 % was increased from 4 to 8. The highest removal was obtained at pH 8 of
obtained for low initial concentration (25 to 100 mg/L) as the ratio of
 90.63 %, which proved that the MG adsorption was favor at alkaline
initial number of dye molecules to the accessible surface area was high.
 condition. At acidic condition, the removal was low due to the existence
 of extra hydrogen ions competed with the MG ions for adsorption
 25 mg/L 50 mg/L 100 mg/L (Shakib et al., 2017). At higher pH, active sites with negative charge
 200 mg/L 250 mg/L 300 mg/L
 increased while active sites with positive charge decreased. This
 250
 diminished the electrostatic repulsion between DPAC’s active sites and
 200 MG positive ions, thus resulted in an increased of MG adsorption
 qt (mg/g)

 150 uptakes.

 100
 100

 MG removal
 50 90

 (%)
 0 80
 0 5 10 t (h) 15 20 25
 70
 60
 2 4 6 8 10 12
Fig. 4 MG adsorption uptake by DPAC versus the time at 30°C. Initial pH

 Fig. 7 MG removal by DPAC at different solution pH.

 100 Isotherms studies provide valuable information about the
 relationship between adsorbate molecules in bulk phase and solid
 80 phase. In this study, eight isotherms were employed namely Langmuir,
MG removal

 60 Freundlich, Temkin, Dubinin-Radushkevich (DR), Koble-Corrigan
 (%)

 25 mg/L 50 mg/L (KC), Vieth-Sladek (VS), Sips and Brouers-Sotolongo (BS).
 40 Langmuir isotherm was developed by assuming the adsorbate
 100 mg/L 200 mg/L
 formed a monolayer coverage on adsorbent’s surface. One of the most
 20 250 mg/L 300 mg/L vital information can be obtained from this isotherm is the Langmuir
 0 monolayer adsorption capacity. The following equation gave the linear
 0 5 10 15 20 25 form of Langmuir isotherm (Langmuir, 1918):
 t (h)
 03 03 V
 = + (6)
 L3 LW YZ LW
Fig. 5 MG percent removal by DPAC versus the time at 30°C.
 where qe is the quantity of MG dye removed at equilibrium (mg/g), qm
 Longer contact time was needed by the MG solution to attain
equilibrium for higher MG initial concentration. For the lower initial is the monolayer adsorption capacity (mg/g), Ce is the MG dye
concentrations (25 to 100 mg/L), DPAC required 4 to 5 hours whereas concentration at equilibrium (mg/L) and KL is the Langmuir adsorption
for higher initial concentrations (200 to 300 mg/L), 22 to 24 hours was constant (L/mg).
required to reach equilibrium. Freundlich isotherm was developed by assuming that the adsorbate
 The impact of solution temperature on MG adsorption by the DPAC formed a multilayer coverage on adsorbent’s heterogeneous surface and
is shown in Fig. 6. Adsorption of MG dye onto DPAC showed an its linear form was expressed as follows (Freundlich, 1906):
exothermic nature where the adsorption uptakes were decreased as the
solution temperature increased (Eltaweil et al., 2020). The decreasing V
 log . = U log . + log _ (7)
trend in MG adsorption uptakes when temperature was increased was \

expected to be caused by the intensification of desorption step in the
sorption mechanis (Doumic et al., 2015). This phenomenon was also where qe is the quantity of MG dye removed at equilibrium (mg/g), Ce
contributed by the decrease in intensity of sorptive forces that occurred is the MG dye concentration at equilibrium (mg/L), KF is the Freundlich
in MG-DPAC adsorption system. adsorption constant (mg/g)(L/mg)1/n and nF is the heterogeneity factor.
 The equation of Temkin isotherm was built by considering the
 effect of uniformly distributed binding energies between adsorbent and
 adsorbate. It is assumed that the heat of adsorption would dropped
 250
 linearly with adsorbate’s coverage on adsorbent. Simplified linear
 MG adsorption capacity

 200 equation of Temkin isotherm is expressed as follows (Temkin and
 150 Pyzhev, 1940):
 (mg/g)

 100
 . = a ln a + a ln . (8)
 50
 0 where qe is the quantity of MG dye removed at equilibrium (mg/g), Ce
 35 45 60 is the MG dye concentration at equilibrium (mg/L), T is the absolute
 temperature (K), R is the universal gas constant (8.314 J/mol.K), AT is
 Solution temperature ̊ C the equilibrium binding constant (L/mg) and BT is the constant which
 related to the adsorption heat (L/mg).
Fig. 6 MG removal by DPAC at different solution temperature. DR isotherm estimates the characteristic porosity of the adsorbent,
 plus with adsorption’s apparent energy. When the free energy, EDR

98
Yusop et al. / Malaysian Journal of Fundamental and Applied Sciences Vol. 17, No. 1 (2021) 95-103

obtained is in between of 8 and 16 kJ/mol, it signifies chemisorption. monolayer capacity, qm values from the models obtained were in range
On the other hand, the value that below 8 kJ/mol inidcates 231.17 to 241.66 mg/g.
physisorption process. The equation of DR isotherm is expressed as
follows (Dubinin and Radushkevich, 1947): Table 3 Parameters of isotherms.
 T
 . = d 2fg (9)
 Langmuir Freundlich Temkin Dubinin-
 V Radushkevich
ɛ = ln j1 + 0 k (10) qm = 231.17 KF =19.08 BT = 46.73 EDR = 2236.07
 3
 kL = 0.11 nF = 3.06 AT = 0.06 BDR = 0.0070
Free energy EDR of sorption was calculated as follows: R2 = 0.98 R2 = 0.99 R2 = 0.94 R2 = 0.72
 Koble- Vieth-Sladek Brouers- Sips
 V
 mn = (11) Corrigan Sotolongo
 opqrs
 aKC= 38.13 kVS = 0.96 qm = 243.33 qm = 245.85
 bKC = 0.0010 qm = 241.66 kBS = 0.030 kS = 0.00012
where qe is the quantity of MG dye removed at equilibrium (mg/g), qm
 nKC = 0.34 βVS = 1.05 α = 0.35 mS= 0.37
is the monolayer adsorption capacity (mg/g), Ce is the MG dye
 R2 = 0.90 R2 = 0.89 R2 = 0.90 R2 = 0.89
concentration at equilibrium (mg/L), T is absolute temperature (K), R
is the universal gas constant (8.314 J/mol K) and BDR is DR constant.
 Isotherm model of Koble-Corrigan (KC) is an empirical model with Additional analysis of the Langmuir isotherm can be computed by
3 parameters. This model is given by following equation (Koble and using the following equation to find separation factor, RL:
Corrigan, 1952): V
 ‚ = VwY (16 )
 v Z 01
 t&u 03 &u
 . = v (12)
 Vw x&u 03 &u
 where Co is the initial concentration of MG dye (mg/L). Different value
 of RL indicates different condition: 0 < RL < 1 indicates favourable
where qe is the quantity of MG dye removed at equilibrium (mg/g), Ce adsorption, RL > 1 indicates unfavourable adsorption, RL = 1 indicates
is the MG dye concentration at equilibrium (mg/L) and aKC, bKC and linear adsorption and RL = 0 indicates irreversible adsorption. Fig. 8
nKC are the KC parameters. If the value of parameter nKC is close to 1, shows the graph of the RL versus MG initial concentrations. From Fig.
it signifies that the isotherm is becoming more of Langmuir isotherm. 9, it can be seen that RL values obtained were in favorable region. As
 The Vieth-Sladek (VS) isotherm equation is expressed as follows the initial concentration rises from 25 to 300 mg/L, a gradual drop of
(Vieth and Sladek, 1965): RL was spotted, which signified that adsorption process at higher initial
 MG dye concentration was preferred.
 L f 0
 . = 5z . + Vwf
 W {| 3
 0
 (13)
 {| 3
 0.3
where qe is the quantity of MG dye removed at equilibrium (mg/g), qm 0.25
is the monolayer adsorption capacity (mg/g), Ce is the MG dye 0.2
concentration at equilibrium (mg/L) and kVS and βVS are VS constants.
 0.15
 Sips isotherm equation is given as (Sips, 1948):
 RL

 0.1
 0.05
 LW (}~03 )W~
 . = (14) 0
 Vw (}~03 )W~
 0 100 200 300 400
where qe is the quantity of MG dye removed at equilibrium (mg/g) and Ce (mg/L)
Ce is the MG dye concentration at equilibrium (mg/L) and qm, mS, kS
and nS are Sips parameters. When mS equals to unity, the Sips isotherm Fig. 8 Plots of separation factor for different initial concentration.
becomes Langmuir isotherm. On the other hand, deviation of mS value
from unity indicates heterogenous surface. Adsorption kinetics
 The Brouers-Sotolongo (BS) isotherm is given by (Gregg and Kinetic studies provides the rate of reaction for adsorption process.
Sing, 1967): This study employed 4 kinetic models namely, pseudo-first-order
 • (PFO) model, pseudo-second-order (PSO) model, Elovich model and
 . = d K1 − 2}€|03 Q (15) Avrami model.
 The pseudo-first-order (PFO) model is given as (Lagergen and
where qe is the quantity of MG dye removed at equilibrium (mg/g), Ce Svenska, 1898):
is the MG dye concentration at equilibrium (mg/L) and kBS, α and qm
are BS parameters. The parameters qm, kBS and α can be determined by ln( . – E ) = ln . – V (17)
a non-linear curve fitting procedure. The exponent signifies the energy
heterogeneity of the surface of adsorbent. where qe and qt are the quantity of MG dye removed at equilibrium and
 The summary of the isotherm constants for MG-DPAC adsorption at time t (mg/g), respectively, k1 is the rate constant for PFO model
system were given in Table 3. Comparison on R2 values revealed that (1/min) and t is time (min).
adsorption data matched the isotherm models in the sequence of Equation for pseudo-second-order (PSO) model is given as follows
Freundlich > Langmuir > Temkin > KC > BS > Sips > VS > DR. (Ho and Mckay, 1999):
Freundlich isotherm fitted well with the data (R2 > 0.99), which
signifies that a multilayer sorption was occurred at DPAC’s E V
 = L T} +L
 V
 (18)
heterogenous surface. The values of nF was 3.06 which indicative of LF 3 T 3

high adsorption intensity (Tunc et al., 2009). The heterogeneity in the
surface of the DPAC significantly affect the MG adsorption. The high where qe and qt are the quantity of MG dye removed at equilibrium and
KF values of 19.08 indicate the higher adsorption capacity. Freundlich at time t (mg/g), respectively, k2 is the rate constant for PSO model
isotherm was preferred by other studies of basic blue removal by (g/mg h) and t is time (min).
pineapple plant stem based AC (Chan et al., 2016). The maximum Equation of Elovich kinetic model is as follows (Aharoni and
 Tompkins, 1970):

 99
Yusop et al. / Malaysian Journal of Fundamental and Applied Sciences Vol. 17, No. 1 (2021) 95-103
where qt is the quantity of MG dye removed at time t (mg/g), kdiff is the
V V rate constant (mg/g h1/2) and C is the boundary layer thickness. Fig. 9
E = q ln( † † ) + q ln( ) (19)
… … shows the plot of intraparticle diffusion for MG-DPAC adsorption
system for various MG initial concentrations. This plot formed a multi-
where qt is the MG dye adsorbed at time t (mg/g), A is the rate of initial linear lines with three distinctive sections. The first sharper section
sorption (mg/g h), B is the parameter related to surface coverage represents the external mass transfer which completed within 15
extension (g/mg) and 1/BE reflects the number of sites available for minutes owing to powerful electrostatic attraction betwixt MG dye and
adsorption. DPAC’s external surface.
Avrami kinetic model is given as (Putniss, 1995):
E = . (1 − exp(− ˆ5 )U‰{ ) (20)
200
In simpler form, this equation becomes:
25 mg/L
E ‹ (1 − exp(− ˆ5 )U‰{ ) (21) 150
50 mg/L
qt
The linearized form of this equation is: 100 mg/L
100
ln(− ln(1 − E )) = ˆ5 ln ˆ5 + ˆ5 ln (22) 200 mg/L
50 250 mg/L
where qe and qt are the quantity of MG dye removed at equilibrium and
at time t (mg/g), respectively, kAV is the Avrami kinetic constant, nAV is 300 mg/L
the constant that reflects the adsorption mechanism changes and αt is
0
the adsorption fraction of qt/qe. Table 4 shows the kinetic parameters
for the MG adsorption onto DPAC. Based on Table 4, PFO kinetic -1 1 3 5
model was revealed to match the data the best as shown by the highest
R2 values with small standard deviation, Δqt. Furthermore, the values Fig. 9 Intraparticle diffusion plot for MG adsorption onto DPAC.
of qe calculated using PFO equation is comparable to those obtained
from the experiment which resulted Δqt to be ranging from 0.69 to 8.50 The next section where the rate limiting step is caused by
%. There were consistent decreasing trends in the k1 values obtained intraparticle diffusion is known as gradual adsorption. The third section
with the increasing of MG initial concentrations. A low adsorption rate which is known as final equilibrium stage signifies a drop in
was noticed at higher MG dye concentration owing to the highly intraparticle diffusion because of exceptionally low MG dye
competitive of MG dye to compete for DPAC’s active sites. concentration left in the solution. It can be concluded that intraparticle
diffusion was not the only rate-limiting step in the second and third
Table 4 Kinetic parameters for MG adsorption onto DPAC.
sections since the linear lines do not pass through the origin. Table 5
MG initial concentration (mg/L) tabulates the values of the intraparticle diffusion model constants (kpi
25 50 100 200 250 300 and Ci) for the three regions from the plots of qt versus t1/2 together with
P qe, exp 24.70 48.68 86.23 144.29 168.13 186.42 the R2 values. From Table 5, it can be seen that kpi for all sections
F (mg/g)
increased with the increased of initial dye concentrations. The
O qe, cal 23.35 44.54 85.63 138.40 163.69 172.43
(mg/g) explanation behind this is that an increasing in adsorbate concentration
k1 0.85 0.70 0.53 0.51 0.49 0.47 caused the driving force to increase, thus lead to an increase in the MG
R2 0.99 0.98 0.99 0.95 0.97 0.96
diffusion rate. Besides kpi, Ci was also found to increase as the MG
Δqt (%) 5.47 8.50 0.69 4.08 2.64 7.50
initial concentrations increase which indicates an increase of the
P qe, cal 37.04 71.43 142.86 225.56 275.72 313.42 boundary layer thickness and increase of the chance of internal mass
S (mg/g) transfer (Marrakchi et al., 2017).
O k2 0.017 0.0085 0.0023 0.00028 0.00029 0.00030 Boyd kinetic model is applied to decide the slowest step in the
R2 0.91 0.91 0.98 0.84 0.60 0.64 adsorption process, as described in (Boyd et al., 1947):
Δqt (%) 49.96 46.73 65.67 56.32 63.99 68.13
L
E qe,cal 27.00 52.85 91.64 156.21 179.55 199.97 E = −0.4977 − ln ”1 − LF • (24)
3
l (mg/g)
o AE 10.27 3.66 0.61 0.35 0.21 0.20
where qe and qt are the quantity of MG dye removed at equilibrium and
v BE 3.93 8.05 16.69 28.56 34.71 38.49
R2
0.82 0.86 0.94 0.91 0.93 0.92
at time t (mg/g), respectively. Fig. 10 illustrates the Boyd plots and from
i
c Δqt (%) 9.31 8.57 6.27 8.26 6.80 7.27 the plot, the linear lines did not passing through the origin, for all MG
h initial concentrations. Therefore, it can be said that the adsorption of
MG dye onto DPAC was mainly regulated by the processes that were
A qe, cal 23.29 45.54 80.01 122.33 135.64 154.30 managed by film diffusion.
v (mg/g)
r kAV 0.011 0.0095 0.0055 0.0057 0.0047 0.0049
Thermodynamic studies
a nAV 0.50 0.52 0.62 0.65 0.69 0.69
R2 0.61 0.66 0.78 0.75 0.79 0.78
Three important parameters in thermodynamic studies; enthalpy of
m
i Δqt (%) 5.71 6.45 7.21 15.22 19.32 17.23
adsorption (ΔH°), free energy (ΔG°) and entropy (ΔS°) were discovered
and given in Table 5 together with activation energy value, Ea. The
value of ΔH° and ΔS° can be obtained from equation given below:
The mechanism of MG diffusion was investigated by using
Intraparticle diffusion and Boyd models. Intraparticle diffusion model ∆z° ∆—°
is usual to majority of adsorption process where the uptake of adsorbate ln ‚ = n
− na
(25)
differs nearly proportional with t1/2. The equation of this model
expressed as (Weber and Morris, 1962): The next following equation can be applied to obtain the value of ΔG°
is:
E = •Ž• V/p + (23)
° = − ln ‚ (26)
100Yusop et al. / Malaysian Journal of Fundamental and Applied Sciences Vol. 17, No. 1 (2021) 95-103 2.5 and kinetic studies revealed that Freundlich isotherm and PFO kinetic model fit the data the best. Further analysis using Boyd plot confirmed 2 25 mg/L that adsorption of MG onto DPAC was mainly governed by the film 50 mg/L diffusion controlled mechanism. Thermodynamic studies revealed low 1.5 value of activation energy, Ea which indicates that the rate-limiting step 100 mg/L in MG adsorption was physically control type. DPAC was found to be 1 Bt suitable to remove MG dye from aqueous solution due to high 200 mg/L maximum adsorption capacity that it poses. 0.5 250 mg/L 0 0 2 4 300 mg/L Table 6 Summary of other AC adsorbents in adsorbing MG dye. -0.5 -1 Adsorption t (h) Precursor capacity (mg/g) Isotherm Kinetic Thermodynamic References Durian 231.17 Freundlich PFO Exothermic This study peel Fig. 10 Boyd plot for MG adsorption onto DPAC. Pinus 250.00 Langmuir PSO - (Sharma et roxburghii al., 2019) cone where R is the universal gas constant (8.314 J/mol K), T is absolute Apple 706.72 Liu General Exothermic (Adebayo et seed order al., 2020) solution temperature (K) and KL is the Langmuir isotherm constant model (L/mg). Activation energy of adsorption refers to the lowest energy Lichen 666.22 Freundlich PSO Endothermic (Koyuncu Cetraria and Kul, which is required by reactant for the reaction to progress. This energy islandica 2020) can be determined by employing Arrhenius equation which is given as Spent 2.55 Langmuir PSO Exothermic (Chanzu et grain al., 2019) follows: Walnut 11.76 Langmuir PSO - (Hajialigol shell and † Masoum, ln p = ln − na+ (27) 2019) Coffee 263.00 Sips PSO Endothermic (Krishna husk Murthy et where k2 is the rate constant of PSO model (g/mg h), Ea is the Arrhenius al., 2019) Luffa 78.79 Langmuir PSO Endothermic (Mashkoor activation energy of adsorption (kJ/mol), A is the Arrhenius factor, R is aegyptica and Nasar, the universal gas constant (8.314 J/mol K) and T is the absolute peel 2019) Chrysopo 128.10 Freundlich PSO - (Thanarasu temperature (K). From Table 5, negative value of ΔH° signified nature gon et al., 2020) of exothermic process. This result was in agreement with those results zizanioide s roots obtained in effect of solution temperature section in 3.3. Exothermic nature occurs due to the fact that physical bonding between MG dye and DPAC’s active sites got reduced as temperature increased. Apart ACKNOWLEDGEMENT from that, solubility of MG dye was enhanced owing to a greater interaction forces between MG dye and water as compared to a weaker This research was supported by the University Grant interaction forces between MG dye and DPAC, hence the solute was (1001/PJKIMIA/8014061 and 304/PJKIMIA/6050434/I136) from more difficult to be adsorbed. Exothermic nature can be observed in the Universiti Sains Malaysia. studies of Basic Blue 3 adsorption onto pineapple plant stem based AC (Chan et al., 2016). The negative value of ΔS°, suggest the decrease in adsorbate concentration in solid-liquid interface, which signified that REFERENCES there is an increase in adsorbate concentration onto the solid phase. It Ab Razak, N. H., Praveena, S. M., Aris, A. Z., Hashim, Z. 2015. Drinking water can also be deduced that the randomness at the solid-liquid interface studies: A review on heavy metal, application of biomarker and health risk had decreased during adsoprtion process. This phenomenon is common assessment (A Special Focus In Malaysia). J. Epidemiol. Glob. Health, 5, 297- for physical-type of adsorption where the adsorption process was 310. driven by electrostatic interaction. Adebayo, M. A., Adebomi, J. I., Abe, T. O., Areo, F. I. 2020. Removal of Low activation energy between 5–40 kJ/mol indicates physical aqueous congo red and malachite green using ackee apple seed–bentonite adsorption. On contrary, energy between 40–800 kJ/mol proposes composite. Colloid Interface. Sci. Commun., 38, 100311. Aderemi, H. B., Nasri, N. S., Zainia, M. A. A. 2018. Physicochemical properties chemisorption. Activation energy, Ea for MG-DPAC system was found of char derived from palm fatty acid distillate. Mal. J. Fund. Appl. Sci., 14, to be positive and below than 40 kJ/mol, thus indicated that the rate 403-406. limiting step was physically control type. ∆G° with negative values as Aharoni, C., Tompkins, F. C. 1970. Advances in catalysis and related subjects. obtained in this study signified that MG-DPAC adsorption process had Academic Press, 31. a spontaneous and feasible nature. Table 6 shows the summary of other Ahmad, M. A., Ahmad, N., Bello, O. S. 2015. Adsorption kinetic studies for the AC adsorbents in adsorbing MG dye. removal of synthetic dye using durian seed activated carbon. J. Dispers. Sci. Technol., 36, 670-684. Table 5 Thermodynamic parameters for MG adsorption onto DPAC. Alslaibi, T. M., Abustan, I., Ahmad, M. A., Abu Foul, A. 2015. Comparative studies on the olive stone activated carbon adsorption of Zn2+, Ni2+, and Cd2+ ΔH° ΔS° Ea ΔG° (kJ/mol) from synthetic wastewater. Desalination Water Treat., 54, 166-177. (kJ/mol) (J/mol) (kJ/mol) Ayanda, O. S., Amodu, O. S., Adubiaro, H., Olutona, G. O., Ebenezer, O. T., Nelana, S. M., Naidoo, E. B. 2018. Effectiveness of termite hill as an 303K 318K 333K economic adsorbent for the adsorption of alizarin red dye. J. Water Reuse -30.15 -0.12 29.94 -1.19 -0.73 -0.28 Desalination, 9, 83-93. Aziz, N. S. M., Shariff, A., Abdullah, N., Noor, N. M. 2018. Characteristics of CONCLUSION coconut frond as a potential feedstock for biochar via slow pyrolysis. Mal. J. Fund. Appl. Sci., 14, 408-413. In this study, the adsorption of MG dye onto DPAC was increased with Bahadori, E., Rapf, M., Di Michele, A., Rossetti, I. 2020. Photochemical vs the increase of contact time and dye initial concentration. The photocatalytic azo-dye removal in a pilot free-surface reactor: is the catalyst adsorption system poses exothermic nature as the adsorption uptakes effective? Sep. Purif. Technol., 237, 116320. was decreased as the solution temperature increased. pH 8 was found Bai, Y.-N., Wang, X.-N., Zhang, F., Wu, J., Zhang, W., Lu, Y.-Z., Fu, L., Lau, T.-C., Zeng, R. J. 2020. High-rate anaerobic decolorization of methyl orange to be the optimum pH for the MG dye adsorption onto DPAC. Isotherm 101
Yusop et al. / Malaysian Journal of Fundamental and Applied Sciences Vol. 17, No. 1 (2021) 95-103

 from synthetic azo dye wastewater in a methane-based hollow fiber membrane innovative method to convert orange peel into activated carbon with improved
 bioreactor. J. Hazard. Mater., 388, 121753. properties as dye adsorbent. J. Clean. Prod., 162, 1376-1387.
 Berkessa, Y. W., Yan, B., Li, T., Jegatheesan, V., Zhang, Y. 2020. Treatment of Langmuir, I. 1918. The adsorption of gases on plane surfaces of glass, mica and
 anthraquinone dye textile wastewater using anaerobic dynamic membrane platinum. J. Am. Chem. Soc., 40, 1361.
 bioreactor: performance and microbial dynamics. Chemosphere, 238, 124539. Lin, Q., Gao, M., Chang, J., Ma, H. 2017. Highly effective adsorption performance
 Bhatti, H. N., Jabeen, A., Iqbal, M., Noreen, S., Naseem, Z. 2017. Adsorptive of carboxymethyl cellulose microspheres crosslinked with epichlorohydrin. J.
 behavior of rice bran-based composites for malachite green dye: isotherm, Appl. Polym. Sci., 2, 134.
 kinetic and thermodynamic studies. J. Mol. Liq., 237, 322-333. Machrouhi, A., Farnane, M., Elhalil, A., Elmoubarki, R., Abdennouri, M.,
 Boyd, G. E., Adamson, A. W., Myers, L. S. 1947. The exchange adsorption of Qourzal, S., Tounsadi, H., Barka, N. 2017. Effectiveness of beetroot seeds and
 ions from aqueous solutions by organic zeolites II. J. Am. Chem. Soc., 69, 11, H3PO4 activated beetroot seeds for the removal of dyes from aqueous solutions.
 2836-2848. J. Water Reuse Desalination, 8, 522-531.
Chan, S.-L., Tan, Y. P., Abdullah, A. H., Ong, S.-T. 2016. Equilibrium, kinetic Marrakchi, F., Ahmed, M. J., Khanday, W. A., Asif, M., Hameed, B. H. 2017.
 and thermodynamic studies of a new potential biosorbent for the removal of Mesoporous-activated carbon prepared from chitosan flakes via single-step
 basic blue 3 and congo red dyes: pineapple (ananas comosus) plant stem. J. hydroxide activation for the adsorption of methylene blue. Int. J. Biol.
 Taiwan Inst. Chem. Eng., 61, 306-315. Macromol., 98, 233-239.
Chanzu, H. A., Onyari, J. M., Shiundu, P. M. 2019. Brewers’ spent grain in Mashkoor, F., Nasar, A. 2019. Preparation, characterization and adsorption
 adsorption of aqueous congo red and malachite green dyes: batch and continuous studies of the chemically modified luffa aegyptica peel as a potential
 flow systems. J. Hazard. Mater., 380, 120897. adsorbent for the removal of malachite green from aqueous solution. J. Mol.
Doumic, L., Salierno, G., Cassanello, M., Haure, P., Ayude, M. 2015. Efficient Liq., 274, 315-327.
 removal of orange g using prussian blue nanoparticles supported over alumina. Moreno-Marenco, A. R., Giraldo, L., Moreno-Piraján, J. C. 2020. Adsorption of
 Catal. Today, 240, 67-72. n-butylparaben from aqueous solution on surface of modified granular
Dubinin, M. M., Radushkevich, L. V. 1947. The equation of the characteristic activated carbons prepared from African palm shell: thermodynamic study of
 curve of activated charcoal. Proc. USSR Acad. Sci.; Physical Chemisty Section, interactions. J. Environ. Chem. Eng., 103969.
 55, 331-337. Mota, H. P., Quadrado, R. F. N., Burgo, T. A. L., Iglesias, B. A., Fajardo, A. R.
Eltaweil, A. S., Elgarhy, G. S., El-Subruiti, G. M., Omer, A. M. 2020. 2020. Polysaccharide/Fe(III)-porphyrin hybrid film as catalyst for oxidative
 Carboxymethyl cellulose/carboxylated graphene oxide composite microbeads decolorization of toxic azo dyes: An approach for wastewater treatment. Arab.
 for efficient adsorption of cationic methylene blue dye. Int. J. Biol. Macromol., J. Chem., 13, 7, 5923-5938.
 154, 307-318. Noor, N. M., Shariff, A., Abdullah, N., Aziz, N. S. M. 2019. Temperature effect
Farnane, M., Tounsadi, H., Machrouhi, A., Elhalil, A., Mahjoubi, F. Z., Sadiq, M., on biochar properties from slow pyrolysis of coconut flesh waste. Mal. J.
 Abdennouri, M., Qourzal, S., Barka, N. 2017. Dye removal from aqueous Fund. Appl. Sci., 15, 153-158.
 solution by raw maize corncob and H3PO4 activated maize corncob. J. Water Pereira, L. A., Couto, A. B., Almeida, D. A. L., Ferreira, N. G. 2020. Singular
 Reuse Desalination, 8, 214-224. properties of boron-doped diamond/carbon fiber composite as anode in
Freundlich, H. M. F. 1906. Over the adsorption in solution. J. Phys. Chem., 57, brilliant green dye electrochemical degradation. Diam. Relat. Mater., 103,
 385-471. 107708.
Gautam, R. K., Gautam, P. K., Banerjee, S., Rawat, V., Soni, S., Sharma, S. K., Putniss, A. 1995. Introduction To Mineral Sciences. Cambridge University
 Chattopadhyaya, M. C. 2015. Removal of tartrazine by activated carbon Press, Melbourne.
 biosorbents of lantana camara: kinetics, equilibrium modeling and Rahim, A. R. A., Kuanaseaan, K., Shehzad, N., Rabat, N. E., Johari, K., Mat, H.
 spectroscopic analysis. J. Environ. Chem. Eng., 3, 79-88. 2019. Synthesis and characterization of coconut pith char adsorbents for
Georgin, J., Dotto, G. L., Mazutti, M. A., Foletto, E. L. 2016. Preparation of carbon dioxide capture. Mal. J. Fund. Appl. Sci., 15, 803-805.
 activated carbon from peanut shell by conventional pyrolysis and microwave Shakib, F., Dadvand Koohi, A., Kamran Pirzaman, A. 2017. Adsorption of
 irradiation-pyrolysis to remove organic dyes from aqueous solutions. J. Environ. methylene blue by using novel chitosan-g-itaconic acid/bentonite
 Chem. Eng., 4, 266-275. nanocomposite – equilibrium and kinetic study. Water Sci. Technol., 75, 1932-
Ghaedi, M., Nasab, A. G., Khodadoust, S., Sahraei, R., Daneshfar, A. 2015. 1943.
 Characterization of zinc oxide nanorods loaded on activated carbon as cheap and Shamsuddin, M. S., Yusoff, N. R. N., Sulaiman, M. A. 2016. Synthesis and
 efficient adsorbent for removal of methylene blue. J. Ind. Eng. Chem., 21, 986- characterization of activated carbon produced from kenaf core fiber using
 993. H3PO4 activation. Procedia Chem., 19, 558-565.
Gregg, S. J., Sing, K. S. W. 1967. Adsorption, surface area and porosity. New York: Sharma, G., Sharma, S., Kumar, A., Naushad, M., Du, B., Ahamad, T., Ghfar,
 Academic Press, 208. A. A., Alqadami, A. A. J., Stadler, F. 2019. Honeycomb structured activated
Hajialigol, S., Masoum, S. 2019. Optimization of biosorption potential of nano carbon synthesized from pinus roxburghii cone as effective bioadsorbent for
 biomass derived from walnut shell for the removal of malachite green from toxic malachite green dye. J. Water Process Eng., 32, 100931.
 liquids solution: experimental design approaches. J. Mol. Liq., 286, 110904. Sips, R. 1948. Combined form of Langmuir and Freundlich equations. J. Chem.
Ho, Y. S., Mckay, G. 1999. Sorption of dye from aqueous solution by peat. Chem. Phys., 16, 490-495.
 Eng. J., 70, 115-124. Temkin, M. I., Pyzhev, V. 1940. Kinetics of ammonia synthesis on promoted
Ilnicka, A., Kamedulski, P., Aly, H. M., Lukaszewicz, J. P. 2020. Manufacture of iron catalyst. Acta Physiochimica U.S.S.R., 12, 327-356.
 activated carbons using Egyptian wood resources and its application in Thanarasu, A., Periyasamy, K., Manickam Periyaraman, P., Devaraj, T.,
 oligothiophene dye adsorption. Arab. J. Chem., 13, 5284-5291. Velayutham, K., Subramanian, S. 2020. Comparative studies on adsorption of
Karadirek, Ş., Okkay, H. 2018. Statistical modeling of activated carbon production dye and heavy metal ions from effluents using eco-friendly adsorbent. Mater.
 from spent mushroom compost. J. Ind. Eng. Chem., 63, 340-347. Today. In press.
Khouni, I., Louhichi, G., Ghrabi, A. 2020. Assessing the performances of an Tunc, O., Tanac, H., Aksu, Z. 2009. Potential use of cotton plant wastes for the
 aerobic membrane bioreactor for textile wastewater treatment: influence of dye removal of remazol black B reactive dye. J. Hazard. Mater., 163, 187-198.
 mass loading rate and biomass concentration. Process Saf. Environ. Prot., 135, Vega-Negron, A. L., Alamo-Nole, L., Perales-Perez, O., Gonzalez-Mederos, A.
 364-382. M., Jusino-Olivencia, C., Roman-Velazquez, F. R. 2018. Simultaneous
Koble, R. A., Corrigan, T. E. 1952. Adsorption isotherm for pure hydrocarbons. adsorption of cationic and anionic dyes by chitosan/cellulose beads for
 Ind. Eng. Chem., 44, 383-387. wastewaters treatment. Int. J. Environ. Res., 12, 59-65.
Koyuncu, H., Kul, A. R. 2020. Synthesis and characterization of a novel activated Vieth, W. R., Sladek, K. J. 1965. A model for diffusion in glassy polymer.
 carbon using nonliving lichen cetraria islandica (l.) ach. and its application in Journal Of Colloid Science, 20, 1014-1033.
 water remediation: equilibrium, kinetic and thermodynamic studies of malachite Weber, W. J., Morris, J. C. 1962. Kinetics of adsorption on carbon from solution.
 green removal from aqueous media. Surf. Interfaces, 21, 100653. J. Sanit. Eng. Div., 89, 31-59.
Krishna Murthy, T. P., Gowrishankar, B. S., Chandra Prabha, M. N., Kruthi, M., Weng, C. H., Lin, Y. T., Tzeng, T. W. 2009. Removal of methylene blue from
 Hari Krishna, R. 2019. Studies on batch adsorptive removal of malachite green aqueous solution by adsorption onto pineapple leaf powder. J. Hazard. Mater.,
 from synthetic wastewater using acid treated coffee husk: equilibrium, kinetics 170, 417-424.
 and thermodynamic studies. Microchem. J., 146, 192-201. Zhi, L. L., Zaini, M. A. A. 2019. Rhodamine B dyes adsorption on palm kernel
Kumar, A., Jena, H. M. 2016. Preparation and characterization of high surface area shell based activated carbons. Mal. J. Fund. Appl. Sci., 15, 743-747.
 activated carbon from fox nut (euryale ferox) shell by chemical activation with Zhou, L., Yu, Q., Cui, Y., Xie, F., Li, W., Li, Y., Chen, M. 2017. Adsorption
 H3PO4. Results Phys., 6, 651-658. properties of activated carbon from reed with a high adsorption capacity. Ecol.
Lagergen, S., Svenska, K. 1898. About the theory of so-called adsorption of Eng., 102, 443-450.
 soluble substances. Acta Holmensia, 24, 1-39. Zhou, X., Zhang, J., Pan, Z., Li, D. 2019. Review of methods for the detection
Lam, S. S., Liew, R. K., Wong, Y. M., Yek, P. N. Y., Ma, N. L., Lee, C. L., Chase, and determination of malachite green and leuco-malachite green in
 H. A. 2017. Microwave-assisted pyrolysis with chemical activation, an aquaculture. Crit. Rev. Anal. Chem., 49, 1-20.

 102
Yusop et al. / Malaysian Journal of Fundamental and Applied Sciences Vol. 17, No. 1 (2021) 95-103

Zhu, M., Yin, X., Chen, W., Yi, Z., Tian, H. 2018. Removal of sulphate from
 mine waters by electrocoagulation/rice straw activated carbon adsorption
 coupling in a batch system: optimization of process via response surface
 methodology. J. Water Reuse Desal., 9, 163-172.
Zhu, Y., Wang, W., Ni, J., Hu, B. 2020. Cultivation of granules containing
 anaerobic decolorization and aerobic degradation cultures for the complete
 mineralization of azo dyes in wastewater. Chemosphere, 246, 125753.

 103
You can also read