Subsuns and rainbows during solar eclipses - Amazon S3
←
→
Page content transcription
If your browser does not render page correctly, please read the page content below
Research Article                                                                       Vol. 59, No. 21 / 20 July 2020 / Applied Optics   F1

Subsuns and rainbows during solar eclipses
G              P. K            ,1, * G          S                ,2 E        H. Z            ,3   AND   P          L                4

1
  Royal Netherlands Meteorological Institute (KNMI), The Netherlands (retired)
2
  Steward Observatory and Dept of Astronomy, The University of Arizona, Tucson, Arizona 85721, USA
3
  Totality Software, Inc., San Diego, California 92131, USA
4
  Finnish Meteorological Institute, Finland
*Corresponding author: konnen@planet.nl

Received 9 January 2020; revised 14 April 2020; accepted 19 April 2020; posted 20 April 2020 (Doc. ID 387716); published 29 May 2020

      A photographic observation sequence was obtained of a subsun before, during, and after the total phase of the 2016
      solar eclipse. The time-resolved images were obtained from a high-altitude jet aircraft. The image sequence was
      searched for the possible presence of a solar corona-generated subsun during totality. Although the subsun-creating
      conditions apparently persisted during totality, the drop in signal intensity compared to the local background
      prevented its detection. Separately, we document a visual observation from the 1977 total solar eclipse of a rainbow
      that faded, in the last a few seconds before totality, from being normally multicolored to monochromatic red from
      water drops then predominantly illuminated by light from the solar chromosphere. A similar transition in the final
      seconds before, and after, totality is expected to occur for parhelia. The posited short-living monochromatic red
      parhelion resulting from the momentary illumination of ice crystals by the solar chromosphere is still waiting to be
      observed. © 2020 Optical Society of America
      https://doi.org/10.1364/AO.387716

1. INTRODUCTION                                                          depending on their shape, to assume a certain preferential ori-
During the progress of the partial phase of a solar eclipse, the         entation in the sky. The transition from random to preferential
partially eclipsed solar disk—or, more precisely, the partially          orientation causes the 22 circular halo to break up in a variety
eclipsed solar photosphere—remains for the majority of time              of noncircular halos shaped as arcs or spots. These structures are
the dominant light source. This means that the signal-to-                positioned near the circular halo to which they are associated
background ratio of atmospheric-optical phenomena like                   [5–7], the most prominent of them being the parhelia (“mock
rainbows or halos remains the same. So, although during the              suns”), which are situated on either side of the Sun and the upper
progress of the partiality the overall light level of the envi-          and lower tangent arcs to the 22 circular halo.
ronment decreases, the contrast and, thus, visibility of such               Parhelia and the tangent arcs are less well known but are
atmospheric phenomena remain essentially constant. This                  intrinsically much brighter than the 22 circular halo to which
situation changes during the last ⇠30 s before totality, when            they are associated [8] and, therefore, belong to the best can-
the solar photosphere loses its role as the primary light source         didates among the refraction halos to remain visible during
and its role is overtaken by the ⇠106 times fainter solar corona.        totality. A halo phenomenon of intrinsic brightness that even
However, during totality, the intensity of skylight has decreased        may surpass that of a parhelion is the so-called subsun [5–7],
by merely a factor 103 104 compared with the normal day                  which belongs to the class of reflection halos and arises from
value [1–4], with ⇠4000 as the typical central value [1]. A pre-         reflections of light in a swarm of preferentially oriented ice
vious study [1] indicated that certain intrinsically bright halos
                                                                         crystals having at least one face horizontal. However, this
may survive the accompanying drop of a factor 250 in signal-
                                                                         halo appears below the horizon and is therefore only vis-
to-background ratio, and that rainbows formed from the light
of the solar corona are most likely doomed to disappear in the           ible for observers who happen to be situated higher than the
residual brightness of the eclipse sky.                                  subsun-generating crystals (see Fig. 1).
   Among the brightest halos are those caused by refraction of              In most cases, the crystals that create the subsun are shaped
(Sun)light by two faces of hexagonal ice crystals forming a prism        as thin hexagonal plates, like the one depicted in Fig. 1. There
with wedge angle 60 . If the crystals are randomly oriented, this        are three different subsun-making light paths via this kind
results in a colored circular halo with a radius 22 and centered         of crystal. For two of them, the reflection takes place at the
at the light source [5–7]. This so-called 22 circular halo is well       (horizontally oriented) lower basal face of the crystal; for the
known by the general public. However, falling ice crystals are           third and simplest subsun-making path, the reflection takes
subject to aerodynamic forces, which may cause some crystals,            place at the (horizontally oriented) upper basal face of the crystal

1559-128X/20/2100F1-10 Journal © 2020 Optical Society of America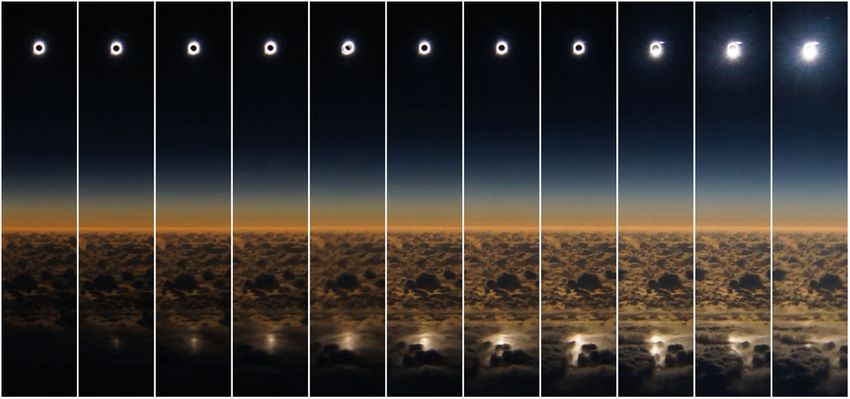
F2      Vol. 59, No. 21 / 20 July 2020 / Applied Optics                                                             Research Article

                                                                              rainbows, unlike halos or diffraction coronas, are very unlikely
                                                                              to remain visible during the totality stage of a solar eclipse.
                                                                              So far, no counterexample to this conclusion is reported, but it
                                                                              appears that a rainbow can undergo a spectacular transforma-
                                                                              tion just before it disappears and/or reappears after third contact
                                                                              (end of totality). We document a visual observation, taken just
                                                                              seconds prior to the totality phase of the October 1977 solar
                                                                              eclipse, of a monochromatic red rainbow resulting from the
                                                                              illumination of raindrops by the solar chromosphere at the stage
Fig. 1. A subsun arises from preferential oriented ice crystals with          when the photosphere was already completely covered by the
at least one of its faces horizontally oriented. In most cases, the subsun-   lunar disk.
generating crystals are hexagonal plates, oriented as depicted in this            The organization of the current paper is as follows. First, we
diagram. External reflection of Sun light at the horizontally oriented
                                                                              analyze and discuss the appearance of the subsun near and dur-
upper face creates a subsun.
                                                                              ing the total phase of the 2016 solar eclipse in order to refine the
                                                                              previous conclusions [1] about the visibility of halos during total
                                                                              solar eclipses. Second, we describe and discuss the appearance
and consists of a simple external reflection (see [5]). The direc-
                                                                              of a monochromatic red rainbow just prior to the totality of
tion of the outgoing ray for all three paths is the same, being the
                                                                              the 1977 solar eclipse and discuss which halos may undergo a
same as in the case of reflection off a horizontal (water) surface.
                                                                              similar multispectral-to-monochromatic-red transformation in
   The ensemble of horizontally oriented crystal faces in the air
                                                                              the very last seconds before totality.
mass below the observer acts as a giant three-dimensional mirror,
                                                                                  By absence of an established nomenclature for rainbows
in which the mirror image of celestial objects like the Sun or the
                                                                              and halos generated by light sources other than the Sun or
Moon [9], or even Jupiter, [10] may appear.
                                                                              Moon, we adopt in this paper a system in which the nature of
   The subsun is frequently seen by air passengers seated on the
                                                                              the primary light source is indicated by a prefix: in our case
Sun-side of an airplane. When the subsun occurs, it appears at
                                                                              “coronal” or “chromospheric.” So, if the primary light source
the so-called subsun point—the point on the celestial sphere
                                                                              is the solar corona, then scattering by raindrops may result in a
whose azimuth is the same as that of the Sun, and whose eleva-
                                                                              coronal rainbow, and scattering by ice crystals in coronal halos,
tion is minus that of the Sun with respect to the true horizon.
                                                                              a coronal subsun, or coronal parhelia. Similarly, if the primary
This is the same point where the sunglint [11]—the mir-
                                                                              light source is the solar chromosphere, then we may have a
ror image of the Sun in a still lake—appears. The difference
                                                                              chromospheric rainbow, chromospheric halos, a chromospheric
between a reflection by a water surface and a reflection by a
                                                                              subsun, or chromospheric parhelia. However, if the primary
three-dimensional set of horizontal reflecting crystal faces is that
                                                                              light source is the solar photosphere, then no prefix is added,
the latter is incapable of producing a mirror image of a nearby
                                                                              which is consistent with common terminology [5].
object, for instance, of a passing aircraft.
   Usually, the subsun is somewhat elongated [5–7] instead of
being perfectly round—just like the Sun’s mirror image in rip-                2. SUBSUN DURING THE SOLAR ECLIPSE
pled water [11]. This happens because the horizontal alignment                OF 9 MARCH 2016 (UTC)
of the subsun-generating crystal faces is usually not absolutely
                                                                              A. Subsun Observation
perfect. If the subsun-generated crystals are in a layer of the
atmosphere with much turbulence, like near the tops of cumu-                  The observation of the eclipse-related subsun took place dur-
lus clouds, then the subsun assumes an irregular and temporally               ing a commercial daytime flight from Anchorage (61.17
variable shape [12].                                                          N, 150.00 W) to Honolulu (21.33 N, 157.92 W), oper-
   Observing a subsun created by the light of the solar corona                ated by Alaska Airlines. The Boeing 737-800 of flight AS870
requires the observer to be positioned higher than the halo-                  originating on 8 March 2016, took off at 23:15 UTC.
generating ice crystals during a total solar eclipse—a condition                 The aircraft heading was basically south, with a deviation
which will be rarely fulfilled by chance. However, during the                 to its usual track on the approach to, and through, the lunar
March 2016 total solar eclipse, a deliberately [13] 25-min-                   umbral shadow. As planned [13], the aircraft at flight level
delayed Alaska Airline Anchorage–Honolulu flight intercepted                  (FL) 350 (corresponding to 35,000 feet = 10.7 km above
the lunar umbra, and the totally eclipsed Sun was seen from the               mean sea level) and groundspeed of 447 kts (828 km/h or
plane, as planned in detail by one of us (G. S.; see [13]). One of            0.23 km/s) crossed nearly perpendicular to the centerline-track
us (E. Z.), on board the plane, obtained a constant-cadence time              of the 107 km wide umbral shadow at 03:36:00 (±2 s) UTC
series of wide-angle pictures flanking and during the 1 m 52 s                at 31.30 N, 156.18 W. At that location, the magnitude of
of totality seen. The pre- and post-totality images of that series            the eclipse was 1.0155. The lunar shadow that had approached
show a subsun. It seems plausible that the conditions causing                 and overtaken the aircraft from azimuth 261 was traveling at
the subsun persisted during totality itself. This provides a first            5.16 km/s (18,600 km/h) at mid-eclipse. During the 112 s of
opportunity to empirically check the apparent (non)persistence                totality, the Sun altitude angle above the true horizon went from
of a subsun during totality.                                                  10.5 to 10.1 , and its azimuth went from 258.2 to 258.6
   In the previous study about the visibility of atmospheric-                 while the aircraft covered a distance of 26 km. The aircraft’s true
optical phenomena during eclipses [1], it was concluded that                  heading of 168.5 offered the passengers seated on the right side
Research Article Vol. 59, No. 21 / 20 July 2020 / Applied Optics F3
Fig. 2. Blue stippled line: path of the aircraft during the last 9 min
before and the 9 min after the instant of its mid-eclipse intercept (MEI,
on 03:36:00 UTC). Yellow solid line: aircraft’s path during totality.
The gray area is, for 03:36:00 UTC, the projection of the Moon’s
umbral shadow onto the Earth (at elevation 10.7 km above mean sea
level). The upper, lower, and middle parallel dashed lines, respectively,
represent the path of totality’s N, S limits, and centerline. The lunar
umbra moves along this path from W (left) to E (right) with a speed of
5.2 km/s. The orange arrow at the MEI-position shows the direction
toward the Sun, which is in the direction in which the Moon’s shadow
approached the aircraft.
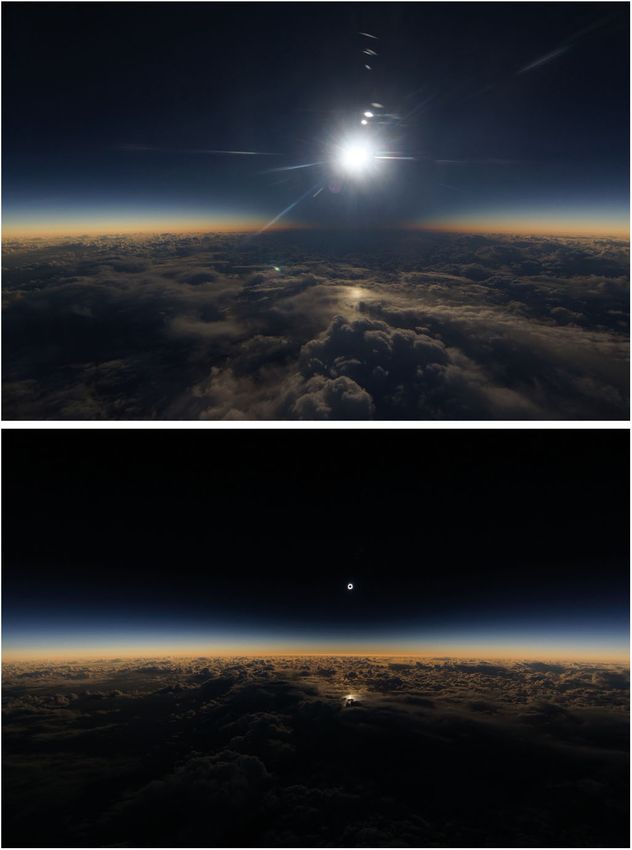
of the plane an optimal view to the eclipse: in that geometry, the Fig. 3. Top: pretotality. The white spot straight under the Sun is
umbral shadow approached and enveloped the subsun point the subsun. The dark patch on the clouds under the Sun is the rapidly
and (later) the aircraft from the horizon essentially along the approaching lunar umbra. The green spot is an artifact due to internal
direction of the line of site to the Sun as seen “straight out” reflections in the camera lens (frame ID #3668, taken 28 s before
totality). Bottom: During the final moments of totality, the subsun
the Sun-side aircraft windows. Figure 2 depicts the path of the reappeared superimposed upon the clouds below that are already
aircraft for 9 minutes before and after its mid-eclipse intercept directly lit by the solar photospheric light (frame ID #3734, taken
and the position of the Moon’s umbral shadow at the instant of 2 s before totality ended). Pictures taken by Evan Zucker, 9 March
the aircraft’s mid-eclipse intercept. 2016 (UTC); horizontal field of view is 115 . A video showing the
The photographic observation started 11 min before total- time-lapse sequence of the images recorded before, during, and after
ity. Until 4 min before totality, five test pictures plus one test totality [3 frames/second, date/time according to Hawaiian Standard
Time (UTC-10)] can be viewed in Visualization 1.
burst consisting of three frames were taken. These six initial
observations, taken at irregular intervals, covered the 7 min test
phase with a time resolution of ⇠1 2 min. The camera used
was a Sony SLT-A77V Camera. It was mounted on the aircraft its total intensity. Table 1 gives the times of the key moments of
window and could be operated automatically. The actual eclipse the observation.
run started 3 min later: from 1 min before totality until 1 min
after totality, 135 pictures were taken with fixed intervals of
B. Meteorological Conditions
2 s. Exposure time (1/90 s), aperture ( f /4.0), and ISO (400)
remained fixed throughout the observation. The focal length The ERA5 [ERA stands for European Centre for Medium-
of 11 mm (corresponding to 16 mm for 35 mm frames) corre- Range Weather Forecasts (ECMWF) re-analysis] dataset
sponds to horizontal and vertical fields of view of the pictures provides temperature, specific humidity, and wind at an hourly
of 115 and 75 , respectively. The uncertainty of the absolute time resolution on a worldwide grid of 31 km spatial resolution,
UTC calibration for each image frame was ±2 s; a relative for 137 atmospheric layers between 10 m and 80 km above
uncertainty of about ±1.5 s is estimated for the duration of ground level [14]. This new reanalysis project is currently in
totality (difference in UTC between C3 and C2) as determined progress by the ECMWF and aims to cover the period 1950
from the images acquired with an interframe cadence of 2 s. until present. Sea surface temperatures are provided also. At the
The pretotality pictures clearly show a bright subsun straight moment of writing, the data from year 2000 onward are already
under the Sun, superimposed upon the cloud tops (Fig. 3, top). available. The temperature and humidity data of 03:00 and
This subsun disappeared 14 s before totality as seen from the 04:00 UTC of 9 March 2016, were downloaded and interpo-
aircraft. 12 s before totality ended, light at the subsun spot lated by layer to the aircraft’s position at mid-eclipse (31.3 N,
reappeared (Fig. 3, bottom). 6 s later, thus 6 s before the end of 156.2 W). Figure 4 shows the 03:00 UTC vertical temperature
totality as seen from the aircraft, there is an increase in the size of (T) and dew point (Td ) vertical profiles; Table 2 shows the main
the lighting area at the subsun spot, resulting in an extra gain in characteristics of the 03:00 and 04:00 UTC profiles.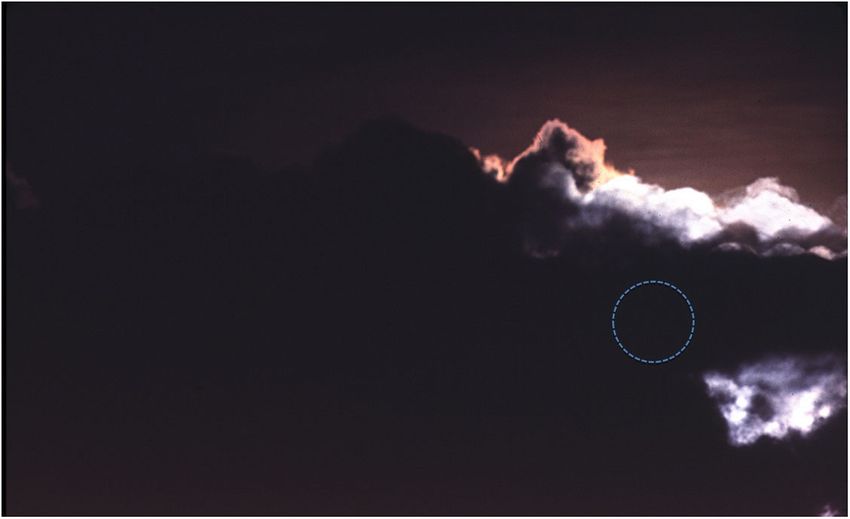
F4       Vol. 59, No. 21 / 20 July 2020 / Applied Optics                                                                  Research Article

Table 1.                Timeline of Zucker’s Observation (Flight AS 870, Anchorage–Honolulu)
Frame ID #                                                           Event                                        UTC                     Time from C2
–                                                               take off (8 March)                               23:15:54                       –
3645–3652                                                      8 test pictures taken                           03:24–03:31              11 min until 4 min
3653                                                          start photo sequence                               03:33:56                    1 min 6 s
3676                                                      subsun disappears in umbra                             03:34:48                       14 s
3682–3683                                                       start totality (C2)                              03:35:02                      0s
3709–3710                                                           mid totality                                03:36:00                     +58 s
3729                                                      light returns at subsun point                         03:36:42                   +1 min 40 s
3732                                               light at subsun point gains extra intensity                  03:36:48                   +1 min 46 s
3735                                                             end totality (C3)                               03:36:54                  +1 min 52 s
3787                                                             last picture taken                              03:39:46                  +3 min 44 s
–                                                                      landing                                   05:34:31                       –

    The most prominent tropospheric feature in the vertical pro-                             atmospheric instability higher up and feeding convective activ-
files is the subtropical subsidence inversion at a height of 5 km,                           ity with formation of cumuliform clouds. The presence of the
which forms the border between very dry (dew point depression                                two inversion layers indicates cloud formation in two atmos-
T Td > 25 C) air higher up, and moist air (T Td < 3 C)                                       pheric levels, which is in accordance with the photographic pre-
below it, the latter air mass extending down to ground level.                                and post-totality observations (see Section 2.C). According to
A second inversion layer is present at ⇠600 m, being a (weak)                                the temperature profile, the lower clouds have their tops at the
boundary layer inversion. The sea surface temperature is con-                                boundary layer inversion (⇠600 m); the higher clouds have
siderably (by 5 C) higher than the 10 m air temperature. This is                             their tops at subtropical inversion layer (⇠5 km), where the
caused by the presence of a highly superadiabatic atmospheric                                temperatures are amply below freezing. The aircraft flew in a dry
surface layer (thickness typically of order 50 m)—triggering                                 air mass (at 10.7 km), thus amply above the atmospheric levels
                                                                                             where cloud formation could occur. A comparison of the 03:00
                                                                                             and 0:400 UTC profiles shows that the top of the subtropical
                                              3:00 UTC
             12000                                                                           inversion layer sank in this time span by 300 m and its width
                                                                         T
             11000                                                      Td                   increased from 300 m to 1100 m, meaning that the inversion
             10000                                                                           was losing its sharpness. This development is indicative for a
              9000                                                                           decrease in convective activity during the hour that deep-eclipse
              8000                                                                           occurred.
              7000
height [m]

              6000
                                                                                             C. Subsun Identification
              5000
              4000                                                                           The test pictures show that, prior to totality, the ocean was partly
              3000                                                                           cloudy, being covered with clusters made up from small low-
              2000                                                                           level cumulus clouds. In big gaps between the clusters, a broad
              1000                                                                           sunglint from the ocean surface was seen. About 2 minutes prior
                  0
                      210    220    230    240       250    260   270        280   290
                                                                                             to totality, the aircraft flew into a region where a higher altitude
                                                 T;Td [K]                                    cloud layer completely obscured the lower one.
Fig. 4. Temperature (T) and dew point (Td ) vertical profiles of                                 In all pretotality pictures, the subsun point lights up (see
9 March 2016, 03:00 UTC, at the mid-eclipse position (retrieved from                         Fig. 3, top) until being extinguished by the lunar umbra, 14 sec-
ERA5 reanalysis run; Kelvin temperature scale).                                              onds before C2 (Table 1). There is little doubt that the feature
                                                                                             is indeed the subsun, as it exhibits the typical shape of a subsun

Table 2.                Specific Points in the Vertical Temperature Profiles at the Mid-Eclipse Position
                                                                                     03:00 UTC                                        0:400 UTC
                                                                        Height                   Temperature                 Height            Temperature
Sea surface                                                                0m                     +16.0 C                  0m                     +16.0 C
Lowest ERA5 level                                                         10 m                    +10.9 C                  10 m                   +11.4 C
Boundary layer inversion                                                 600 m                    +5.3 C                  700 m                   +5.1 C
Freezing level                                                          1540 m                     0C                    1450 m                    0C
Subtropical inversion, bottom                                           5100 m                     23.8 C                 4000 m                   17.0 C
Subtropical inversion, top                                              5400 m                     23.4 C                 5100 m                   21.4 C
Aircraft’s flight level                                                 10700 m                    45.2 C                10700 m                   45.2 C
Tropopause                                                              16300 m                    65.0 C                16300 m                   63.7 C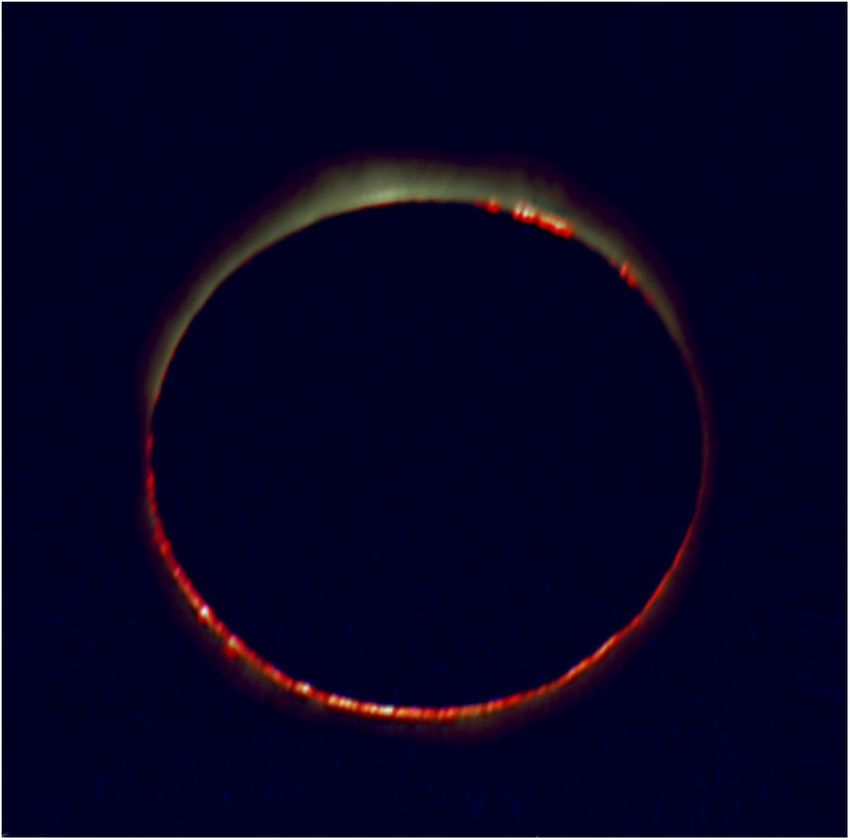
Research Article Vol. 59, No. 21 / 20 July 2020 / Applied Optics F5
generated in crystal layers over cumuliform clouds [12] and the Table 3 leads us to the following conclusion: given the height
cloud layer seems unbroken. of the aircraft (10.7 km), the first light at the subsun point
After the lunar umbra had passed the subsun point, its light happened when the lower boundary of the umbral conic had
returned. This happened at frame ID #3729, 12 s before frame reached at the subsun point an atmospheric layer 5.7 ± 0.5 km
ID #3735, where, as seen from the aircraft, totality had ended. below the aircraft as determined from these images (Table 3),
Figure 5 shows, in 11 frames, the return of light in the subsun thus a height of 5.0 ± 0.5 km above sea level. The temperature
point and of the light of the photosphere of the Sun. in that level (order 20 C; see Table 2) is well below freezing
The time difference between the return of light at the subsun and allows for ice crystal formation; its height as deduced from
and at the aircraft is caused by the fact that the incidence angle Eqs. (1) and (2) (see Table 3) corresponds within the uncertainty
of the lunar shadow is inclined to the Earth surface. This incli- to the height of the subtropical inversion layer as inferred from
nation results in a dependency of second and third contacts (C2 the vertical profile (Fig. 4 and Table 2). This makes the identifi-
and C3) on the altitude of the observer (aircraft) above mean sea cation of the bright spot as being the subsun positive. The extra
level. By flight plan design [13,15], the azimuth of the Sun and gain in subsun brightness at 6 s after its reappearance can be
the azimuth from which the lunar umbra approached the site attributed to the rapidly increasing illumination of the subsun-
were nearly (within 3 ) the same, and perpendicular to the path making ice crystals by the photosphere just after C3, as the other
of the aircraft (see Fig. 2). Then, it follows from simple geometry mechanism—the presence of a second subsun-creating crystal
that the difference 1z between the height of the aircraft above layer 2.8 km below the aircraft (Table 3), thus ⇠ 8 km above sea
mean sea level and the maximum possible height of the reflect- level—is inconsistent with the observed low humidity at that
ing surfaces in the subsun point to be lit by the solar photosphere
atmospheric level (Fig. 4).
is given by the following two equations:
After its reappearance, the subsun kept the same irregular
v1t appearance as the pretotality subsun. The subsun persisted
cos(2 + h) = cos(h) , (1) until frame ID #3762 (58 s after C3), when the subsun point
R aircraft
approached the boundary of the upper cloud layer. From frame
cos(2 + h) ID #3776 (88 s after C3) onward, the subsun point moved over
1z ⌘ R aircraft R crystal = R aircraft 1 , (2) a region of broken clouds with large areas of clear sky, and the
cos( + h)
subsun was replaced by a sunglint.
where h is the Sun altitude angle above the true horizon (which is
at flight altitude 10.7 km ⇠ 3.2 above the apparent horizon—
see Fig. 5), 1t is the time lag between the reappearance of
light in the subsun point, and v is the velocity of the lunar
umbra on the terminator plane—which is the plane through
the Earth’s center whose normal points to the center of the
Sun—minus the velocity of the observer’s position due to the
Earth’s rotation, also projected onto that plane. In our case,
v = 1.00 0.08 km/s = 0.92 km/s. R aircraft and R crystal are the
distances to the Earth’s center of the aircraft and of the reflecting
crystal, respectively. Furthermore, is the great-circle distance
between the observer and the Sun-reflecting surface. Figure 6
depicts the geometry of the problem; Table 3 shows for h = 10
the results for and 1z.
Fig. 5. Shortly before the end of totality, the light returns at the
subsun point. Third contact (C3) occurs at the eighth frame of this
composite consisting of 11 frames. The individual frames are mutually
separated by 2 s; the 20 s sequence runs from C3–14 s until C3 + 6 s
(frame ID #s 3728–3738). At this aircraft height (10.7 km), the hori-
zon is depressed by ⇠3.2 and is thus angularly closer to the subsun Fig. 6. Geometry of the reappearance of the subsun, shortly before
point than to the Sun. With the Sun 10.1 above the true horizon at the end of totality as seen from the aircraft [Eqs. (1) and (2)]. The Sun’s
C3, the line-of-site distance from the aircraft to the subsun point at sea altitude as seen from the aircraft is h; the Sun’s altitude as seen from the
level is ⇠62 km. reflecting crystal is h + .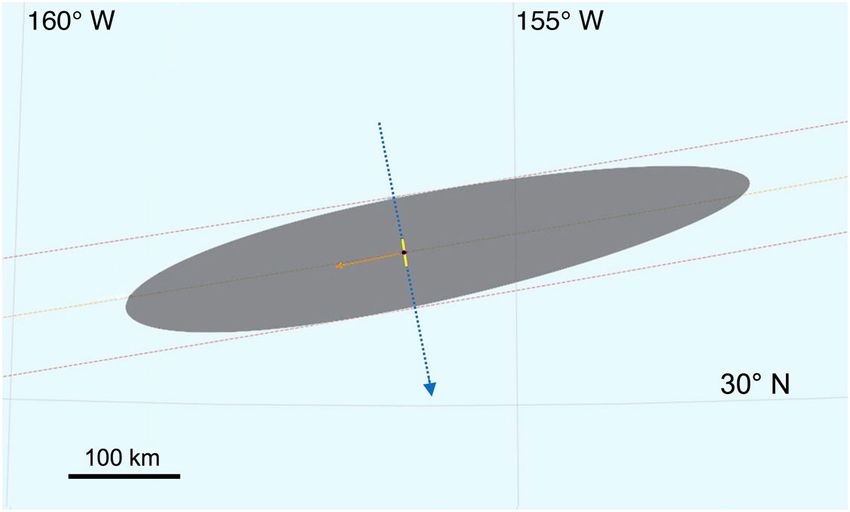
F6      Vol. 59, No. 21 / 20 July 2020 / Applied Optics                                                                  Research Article

Table 3. Depth below the Aircraft of the Features at                            of the central line of the 52 km wide eclipse path. The lunar
the Subsun Point Seen in Fig. 5                                                 umbra approached from west. The total phase of the eclipse
Frame ID #       Time                       1z (km)
                                                      a
                                                                Event           occurred low to the horizon (9.2 elevation angle) in the west
                                                                                (azimuth 261.5 ) with mid-eclipse at 22:03:30 UT, not long
3729           C3–12 s 0.27 ± 0.02          5.7 ± 0.5 first light appears
                                                                                before sunset. The magnitude of the eclipse was 1.006; the
3732           C3–6 s 0.14 ± 0.02           2.8 ± 0.5 extra brightness
                                                                                totality lasted 49 s. G. S.’s personal account of the event (written
   a
    The error bars stem from the uncertainty in the exact timing of these two   up in 2017 in an email to G. K.) is based on his 1977-notes and
events.
                                                                                his recollection:
                                                                                   “In the time leading up to totality, the sky was ⇠80% completely
    Our analysis indicates that during pre- and post-totality, the
                                                                                clear, with low cloud only opposite in the sky toward the eastern
line of sight to the ocean happened to be obscured by a tem-
                                                                                horizon. It otherwise had been fully clear from the zenith westward.
porary, almost unbroken cloud layer having their tops at the
                                                                                Soon prior to totality we could see a rainbow in the sky opposite the
subtropical subsidence inversion—hence in a region where the
atmospheric conditions are favorable for subsun formation.                      Sun toward where it was cloudy (presumably there was some rain
It is plausible that the same situation applied to the ⇠2 min of                there, but we could not see). In my recollection the rainbow consisted
totality.                                                                       of an unbroken, more-or-less symmetrical arc (roughly equal length
                                                                                on both sides) with respect to the top. It did not extend fully to the
                                                                                horizon but nearly so. A very short time before totality a small, iso-
D. Coronal Subsun?                                                              lated, cumulous cloud formed from nowhere to the west of the zenith
A search for a photographic signal of the coronal subsun was                    and began drifting toward the Sun. By complete bad luck it blocked
undertaken with frame IDs #3680–3726. These 47 frames were                      the eclipse from our view for all 49 seconds of totality from where we
all taken during the time span that both the aircraft and the                   were. However, the rainbow was illuminated prior to (and I would
subsun point were in the lunar umbra. The original raw CCD                      assume during) totality. Just prior to totality (in the final minute)
frames, separated into their RGB color channels by de-Bayering                  the rainbow was uniformly fading from visibility, but in the last few
[16], were used as input for the numerical calculations, so the                 seconds before (our clouded out) totality, the rainbow faded from
full dynamic range of the sensor data was available. The analog-                view except for a bright single strand of hydrogen-alpha red. What
to-digital conversion in the used camera in this image series                   we were seeing was obvious, but unexpected. The rainbow was for a
was 12 bits. The series of images were coaligned and stacked                    few seconds only being illuminated by the solar chromosphere (only),
to build a signal-to-noise ratio (SNR) using Halostack soft-                    and so we saw just a monochromatic arc! That was amazing but
ware [17]. The original raw images were used as input. A small                  lasted only a couple of seconds at most. After the second contact, the
area centered at the Sun is used as a reference for the image-                  rainbow disappeared in the eclipse-darkness. We got no pictures
correlation-based alignment. The images are translated with                     of the chromospheric rainbow, as all cameras were trained in the
full-pixel offsets so that the locations of best correlation (R2 )              direction of the Sun, not opposite, hoping for a break in that one
match. The aligned images were saved individually as 16-bit                     fatal cloud that never came until after totality!”
PNG images to retain the maximum image quality, and differ-
ent stacking methods (maximum, median, average) were tested.
Out of the tested methods, the average of all the images gave
the best start point for further image enhancements yielding a
reduced image with lowest noise and cleanest subhorizon view
by smoothing the clouds due to apparent movement.
   The resulting image was contrast enhanced in image editing
software (GIMP). To provide better details in the area of inter-
est, first, the image dynamic range (minimum to maximum)
was adjusted. As the image transfer function is inherently linear
(doubling the scene brightness doubles the pixel value), apply-
ing a gamma correction (nonlinear mapping) makes some image
details more readily visibly discernable. Further, an unsharp
mask (USM) was applied to increase local contrast. None of
these enhancements, however, brought out the coronal subsun                     Fig. 7. Cloud that had covered the totally eclipsed Sun in October
with visual inspection.                                                         1977. The picture is taken just after the end of the 49 s of totality. The
                                                                                deeply partially eclipsed Sun is behind a thick part of the cloud; the
                                                                                blue stippled circle marks the best estimate of the position of the solar
3. CHROMOSPHERIC RAINBOW                                                        disk. The white parts of the cloud edges are illuminated by the first
                                                                                rays of the solar photosphere. The red cloud edge is illuminated by
A chromospheric rainbow was observed by one of us (G. S.)
                                                                                nearly monochromatic red light from the chromosphere. A rainbow, at
during an eclipse expedition to observe the the total solar                     pretotality visible opposite in the sky, persisted during the last seconds
eclipse of 12 October 1977, though totality itself was thwarted                 before totality due to the light from the chromosphere while turning
by clouds. The observing site was inland in Colombia, at                        into a monochromatic red arc before it disappeared. The field size is
04 51.80 N, 74 17.40 W, on the side of the road #50 north of                    5.0 ⇥ 3.4 . (Picture taken by Glenn Schneider, rescanned from the
El Rosal, about 20 km NW of Bogota. The site was 10 km south                    original 35 mm slide.)
Research Article Vol. 59, No. 21 / 20 July 2020 / Applied Optics F7
Figure 7 shows a picture of a part of the Sun-obscuring cloud on 04:03:14 UT, 1 h 31 min after sunrise. The magnitude of the
opposite in the sky from the rainbow as taken through a 400 mm eclipse was 1.026; totality lasted 3 m 40 s.
EFL lens, only seconds after third contact. The cloud is illumi- Although Maunder’s account is second-hand (as he himself
nated from behind. Its edge lights up because of near-forward wrote), it is useful to compare it with the 1977 account. At
scattering by cloud particles of the primary light source. The the time that the 1977 account was written down, the com-
right part is white, as in the illumination, the light from the piler (G. S.) was unaware of the existence of the 1901 paper.
photosphere dominates. Behind it, there is a top of an appar- Hence, the 1901 and 1977 reports can be treated as mutually
ently higher cloud element. Its edge is red, as the illumination independent accounts. Maunder’s account reads as follows:
comes predominately from the chromosphere—just as in the “The observers at Quatre Bornes, watching the eclipse under
case of the transition from multispectral to monochromatic of apparently cloudless sky but in a smart drizzle of rain, saw a rain-
the rainbow that happened shortly before the bow disappeared bow made by the eclipse itself. (. . . ) I believe this observation of
during totality. an eclipse rainbow to be unique. I wish it had been my fortune to
see it. (. . . ) The three observers all agree that it tapered at the two
ends, and one of them was much impressed by bright lines running
4. DISCUSSION through it, particularly a bright pink line. Could it be the C line of
A. Coronal Subsun? hydrogen (H-alpha; 656.3 nm) from the large prominence?”
There seems little doubt that the “pink line” has been the
The analysis of the sequence of 2016 eclipse pictures taken same as the thin thread of H-alpha “pink” that was seen in 1977.
around totality strongly suggests that the subsun-creating The fact that the 1977 feature survived for a second or two as
conditions persisted during totality. Nonetheless, despite the rest of the (photospheric continuum) spectrum faded out
the brightness of the subsun in the pictures outside totality, coincident with the time of C2 clearly implies its chromospheric
a coronal subsun could not be seen in the pictures taken dur- origin. In Maunder’s account, he does not actually say if the
ing totality—neither directly, nor after a significant contrast observer’s “pink line” was visible during/throughout totality—
enhancement. A reason for this nondetection may be that the which could be the case if the large prominence that he saw had
conditions for observing subhorizon halos during total solar been so bright that it outshined the corona. In that case, the
eclipses from a high-flying platform may be less favorable than “pink line” was not necessarily chromospheric.
for above-horizon halos observed from the ground. The clouds However, Maunder’s conjecture about the prominence
against which subsuns usually appear are often thick and there- being the cause of the eclipse rainbow seems untenable, for two
fore bright compared to the background of cirrus, against which reasons. First, the brightness of even a monstrous prominence
an above-horizon halo, like, for instance, bright parhelia, usually would be too small to outshine the corona, while a perceptible
appear. This may reduce the signal-to-background ratio of coronal rainbow seems impossible [1]. The argument is as fol-
coronal subsuns observed from aircraft below that of coronal lows. Prominences will have average surface brightness in visible
parhelia observed from the ground, and possibly even down to light (typically) about 4⇥ brighter than the surface brightness
the level that coronal subsuns become undetectable. of the innermost (brightest) part of the corona, regardless of
The current observation does not disprove the previous the size of the prominence, and so the total brightness of a
[1] claim that “Intrinsically bright halos seem to be capable to prominence will to first order just scale by its surface area.
persist during totality.” This refers in particular to parhelia and So, simply put, unless the total surface area of a posited
to the upper tangent arc to the 22 circular halo. Observing prominence reaches ⇠25% of the inner corona, the coronal
a coronal parhelion from the ground seems more likely than light will dominate. That ⇠25% by area is well beyond what one
observing a coronal subsun from a high-flying plane. could reasonably expect, as the largest prominences (other than
A fascinating consequence of the observation of a chromo- maybe a once per century event, even then a big stretch) will
spheric rainbow described in Section 3.A is that the same may have a surface area that is much smaller than that of even just the
happen to a parhelion. This would mean that, during the transi- innermost part of the corona. Second, at the 1901 eclipse, there
tion of a normal parhelion into a coronal parhelion, there would were no large prominences: the Lick Observatory expedition
be a short intermediate stage where the parhelion is chromo- to Sumatra noted during the observation with the 40 ft. tele-
spheric, which would result in a temporary appearance of a scope the occurrence of only “a number of small prominences,
monochromatic red parhelion. exhibiting considerable detail on the East limb” [19].
The conclusion of G. S.’s and Maunder’s reports is that
chromospheric rainbows are possible and likely occurred as
B. Chromospheric Rainbow
short-living features during both the 1901 and 1977 eclipses.
The only pre-1977 description of the appearance of an eclipse The two observations contradict the conjecture in the analysis
rainbow of which we are aware of dates from 1901 and is of [1] that the “pink line” in Maunder’s report should be attrib-
described by Maunder [18]. The rainbow appeared during the uted to the occurrence of a supernumerary rainbow instead.
eclipse of 18 May 1901, being one of the deepest of the 20th However, the observation Maunder’s “bright lines” (hence more
century, and was observed by several parties in Mauritius. The than the “pink” one) that ran through the “eclipse rainbow”
eclipse rainbow was observed by the party in Quatre Bornes (20 remains unexplained by us.
160 S, 57 290 E), which is 20 km SSW from Maunder’s site at The chromospheric rainbows appeared during the eclipse
Pamplemousses. The total phase of the eclipse occurred with the stage in which the general illumination of the sky by the Sun
Sun in NE (azimuth 60.5 ) at altitude 18.5 . Mid-eclipse was rapidly decreased. They appeared because, in the very last stageF8 Vol. 59, No. 21 / 20 July 2020 / Applied Optics Research Article
Table 4. Relative (Unity Normalized to the Total of the
Chromospheric 180 Sector) Brightness Measured for
the 2002 Eclipse
Decomposed Color Chromospheric Coronal
Components 180 Sector 90 Sector
Total 100.0% 96.6%
R 72.8% 38.6%
G 14.9% 31.7%
B 12.3% 26.3%
visibility of a coronal rainbow is considerably lower than that
of the chromospheric rainbow, as after C2 no return from
a red monochromatic to a multispectral (coronal) rainbow
was observed. The fact that the chromospheric rainbow was
bright enough to be noticed by an unexpectant observer, while
immediately afterwards no trace was seen of a coronal rainbow,
suggests that in other cases also the signal-to-background ratio
Fig. 8. This picture, taken just at the end of the 27 s of totality of for visual observation of a coronal rainbow is a least a factor 2
the eclipse of 4 December 2002, shows that for eclipse magnitudes lower than for a chromospheric one and is likely to remain below
close to unity, the chromosphere extends over a long arc. As the mag- the threshold of human perception.
nitudes of the 2002 eclipse (1.004) and the 1977 eclipse (1.006) are This result—the appearance in 1977 of the chromospheric
comparable, the appearance of the Sun at the beginning of totality of rainbow and nonappearance of the coronal one—can be
the 1977 eclipse probably was similar to this picture. The observing understood by the following simple argument. Neglecting
site was at Lindon Station, Fortville Bore, South Australia, 29 07.90 S, the change in sky brightness during the few-seconds-lasting
140 53.80 E. The Sun is very low (1.4 up) in the southwest (azimuth transition to or from totality, the signal-to-background ratio
245.2 ). The oblateness of the eclipsed Sun, with the direction toward of a rainbow is proportional to its surface brightness (radiance
the zenith up, is due to differential atmospheric refraction across the
per unit solid angle), and thus proportional to the irradiance
disk and is best seen when this picture is temporarily turned sideways
[22]. (Picture taken by Glenn Schneider.) of the rainbow-generating drops by the light source. It is also
inversely proportional to the scattering-angular width of the
radiance distribution of the rainbow. Both visual inspection and
before totality, the attenuation in the intensity at the hydrogen photometric measures of Fig. 8 given in Table 4 (as explained in
H-alpha line is retarded with respect to that of the remainder Appendix A.2) suggest that, at least in 2002, the total brightness
of the continuum spectrum [20]. At the final stage of partiality, of the inner corona is comparable to that of a 180 chromo-
the rainbow has lost its non-H-alpha components, and a red spheric arc; simulations (see Appendix A.1) show that the
rainbow of smaller width remains. This situation (of different scattering-angle radiance distribution of a multispectral (coro-
physical causality) is comparable to the transition near sun- nal) rainbow is 5 times wider than the scattering-angle radiance
set of a multispectral rainbow to a red rainbow [7,21]. In the distribution of a monochromatic (chromospheric H-alpha)
latter case, the primary light source (the setting Sun) is turn- rainbow. So, the no-show of a coronal rainbow during 1977
ing red due to atmospheric attenuation that is greatest in the should be mainly attributed to the larger than monochromatic
short-wavelength part of its spectrum. scattering-angular width of this multispectral phenomenon
As it seems highly unlikely that the light of a very bright rather than to the relative weakness of the light of the corona—
prominence may generate a perceptible rainbow, the chromo- a conclusion that is supported by the quantitative analysis
sphere is the only source capable to create an H-alpha rainbow. presented in the Appendix A.
A chromospheric rainbow is a short-lived phenomenon occur- Although the two unexpectant visual observations of the
ring only during near-totality. The best chance of it appearing monochromatic red rainbow illustrate that the signal-to-
is when the chromosphere extends over a long arc, which is the background ratio of a chromospheric rainbow can be amply
case when the magnitude of the eclipse is close to 1 (Fig. 8). Such above the threshold for visual observation, it seems indeed [1]
was the case at the 1977 eclipse near sunset. unlikely that such would ever be the case for a coronal rainbow.
C. Coronal Versus Chromospheric Rainbows 5. CONCLUSION
The two observations of a chromospheric rainbow do not • A high-resolution time series of photographs taken in
undermine the claim in [1] that “a rainbow during totality seems 2016 from a high-altitude jet aircraft provided for the first
impossible,” as this specifically refers to a coronal rainbow. time the opportunity to study the behavior of a subsun before,
However, the 1977 observations during the appearance during, and after the totality of a solar eclipse.
of the chromospheric rainbow provide observational insight • The pictures taken during the deeply partial phases of the
about a potential visibility of coronal rainbows. A direct eclipse showed a light spot at the subsun point. The spot can be
conclusion from the report is that—at least in 1977—the identified as a subsun.Research Article Vol. 59, No. 21 / 20 July 2020 / Applied Optics F9
• Although the subsun-creating conditions most likely to improve the SNR and eliminate the zero-bias. Table 4 shows
persisted during totality, we could not retrieve a coronal subsun the relative brightness by color channel, unity normalized in
from the pictures taken at totality. both columns to that of the total chromospheric 180 sector.
• This nondetection does not exclude the possibility of The table indicates that based on the 2002 eclipse, the total
the occurrence of coronal halos. The best candidates are the polychromatic brightness of the inner corona (linearly extrapo-
parhelia, having often a better signal-to-background ratio than a lating over the full 360 ) is about 4 times larger than a 180
subsun appearing on top of a thick cloud deck. long chromospheric arc; assuming for simplicity a biaxially
• A visual observation (by G. S.) during the 1977 solar symmetric corona, this factor becomes 2. However, there are
eclipse is reported of a rainbow that, just before its disappearance several uncertainties in this number: the (monochromatic)
during totality, turned from multispectral into monochromatic chromosphere, in some places, appears to be overexposed.
red. Thus, its R-channel brightness is a lower limit due to image
• Maunder’s report of the 1901 solar eclipse describes saturation—potentially manifesting itself also in a false signal
the same transition of a rainbow. His description of the in the G/B color layers (by halation). Additionally, the 2002
phenomenon bears large similarities to the 1977 description. solar elevation angle during totality was very low (1.7 ), and
• At the time G. S. saw and recorded the 1977 monochro- instrumental and visual sensitivities are not the same, etc. The
matic red rainbow, he was unaware of the Maunder 1901 bottom line, though, is it seems for the 2002 event the inner
observation, and so any similarities or differences in descriptions coronal and chromospheric total brightness were similar within
were unbiased by expectations. a factor of ⇠2.
• These two observations confirm the occurrence, during a Dividing this (rough) estimate of flux ratio between corona
few seconds only, of a chromospheric rainbow just before or just and chromosphere by the FWHM ratio (5.3) as obtained above
after totality. indicates that the signal-to-background ratio for a coronal
• A parhelion at the edge of totality is expected to exhibit a rainbow could be roughly a factor 2–4 lower than for the 1977
similar behavior as a rainbow. Its transition from a multispec- chromospheric rainbow.
tral to monochromatic red should be visible by the naked eye.
This short-living chromospheric parhelion is still waiting to be
Acknowledgment. H. W. van den Brink (KNMI)
observed.
retrieved and interpolated the ERA5 data. J. Ruitenberg
combined the 11 frames that make up Fig. 5. N. Lefaudeux
performed an initial analysis of the 2016 eclipse images. The
APPENDIX A: SURFACE BRIGHTNESS DETAILS
vertical temperature profile at mid-eclipse has been obtained
A.1 Rainbow Widths Copernicus Climate Change Service Information [2018]. G. S.
In rain showers, the drop size distribution is broad (see, thanks Alaska Airlines for their cooperation in the implementa-
e.g., [23]). Then, the solar disk (0.5 diameter) convolved tion of the flight plan [13], thus enabling the 2016 observations
radiance distributions as a function of scattering angle of reported here.
monochromic and multispectral rainbows are mutually similar
and close to what is expected from geometric optics, in particu- Disclosures. The authors declare no conflicts of interest.
lar near their feet [24]. Therefore, the rainbow width can be
regarded to scale with the full width at half-maximum (FWHM)
REFERENCES
of the scattering-angle distribution of the rainbow. Simulations
with Laven’s MiePlot program [25] of rainbows show that the 1. G. P. Können and C. Hinz, “Visibility of stars, halos, and rainbows dur-
ing solar eclipses,” Appl. Opt. 47, H14–H24 (2008).
FWHM of a solar disk convolved multispectral rainbow is a 2. W. E. Sharp, S. M. Silverman, and J. W. F. Lloyd, “Summary of sky
factor 5.3 larger than the FWHM of a solar disk convolved brightness measurements during eclipses of the Sun,” Appl. Opt. 10,
monochromatic (H-alpha) rainbow. 1207–1210 (1971).
3. S. M. Silverman and E. G. Mullen, “Sky brightness during eclipses:
a review,” Appl. Opt. 14, 2838–2843 (1975).
A.2 Brightness Ratio Solar Chromosphere/Corona 4. G. E. Shaw, “Sky brightness and polarization during the 1973 African
eclipse,” Appl. Opt. 14, 388–394 (1975).
The brightness ratio chromosphere/corona obviously has no 5. W. Tape, Atmospheric Halos, Vol. 64 of the Antarctic Research Series
data to directly inform on the 1977 event, but to a very rough (American Geophysical Union, 1994).
first order, the geometrically similar 2002 image (Fig. 8) can 6. R. Greenler, Rainbows, Halos, and Glories (Cambridge University,
serve as a (loose) proxy. A 90 wide sector at the upper left part 1980).
7. L. Cowley, “Atmospheric Optics website,” http://www.atoptics.
(fourth quadrant) exterior to the solar limb contains only inner
co.uk/.
coronal light; the third and second quadrants show an extended 8. G. P. Können, “The prodigious halo of the other Huygens,” Appl. Opt.
arc of chromosphere, actually larger than 180 in extent. We 54, B185–B193 (2015).
scanned the original color picture, decomposed the color image 9. G. P. Können and R. Schmidt, “Submoon,” Weather 68, 208–209
into its R, G, and B components, and measured for each com- (2013).
10. J. Küttner and E. Model, “Nebenuntersonne, Unterjupiter und
ponent the total (coronal) brightness in the fourth quadrant
andere Bemerkenswerte Halo-Beobachtungen auf der Zugspitze,”
and the (chromospheric) brightness in the third and second Meteorolog. Rundsch. 1, 218–220 (1948).
quadrants (a 180 sector). In doing so, we mask out the Moon 11. D. K. Lynch, D. S. B. Dearborn, and J. A. Lock, “Glitter and glints on
interior to the limb and the sky beyond the inner coronal extent water,” Appl. Opt. 50, F39–F49 (2011).F10 Vol. 59, No. 21 / 20 July 2020 / Applied Optics Research Article
12. G. P. Können, Polarized Light in Nature (Cambridge University, 1985), 19. C. D. Perrine, “The Lick Observatory—Crocker Expedition to
Plate 40. Observe the Total Solar Eclipse of 1901, May 17–18,” Publ. Astron.
13. G. Schneider, “A unique “serendipitous” total solar eclipse Soc. Pac. 13, 187–201 (1901).
2016 observation flight opportunity: Intercepting the Moon’s 20. R. B. Slobins, “Flash spectrum 21/8/2017,” https://vimeo.com/
shadow from AS flight 870”, Personal Document (2015), http:// 231580691.
nicmosis.as.arizona.edu:8000/ECLIPSE_WEB/TSE2016/TSE2016_ 21. M. Minnaert, The Nature of Light and Color in the Open Air (Dover
AS870_FLIGHT_OPPORTUNITY_R002_NA.pdf. Publications, 1954).
14. https://confluence.ecmwf.int/display/CKB/ERA5%3A+data+ 22. A. Meinel and M. Meinel, Sunsets, Twilights, and Evening Skies
documentation. (Cambridge University, 1983), p. 14 and Plate 2-2.
15. X. M. Jubier, Solar Eclipse Maestro program http://xjubier.free.fr/ 23. J. S. Marshall and W. M. Palmer, “The distribution of raindrops with
en/site_pages/solar_eclipses/Solar_Eclipse_Maestro_Photography_ size,” J. Meteorol. 5, 165–166 (1948).
Software.html. 24. G. P. Können, “Appearance of supernumeraries of the secondary
16. A. Davies and P. Fennessy, Digital Imaging for Photographers, 4th ed. rainbow in rain showers,” J. Opt. Soc. Am. A4, 810–816 (1987).
(Focal, 2001). 25. P. Laven, “MiePlot computer program,” https://www.philiplaven.
17. http://halostack.readthedocs.io/en/latest/. com/mieplot.htm.
18. E. W. Maunder, “The comet and the eclipse,” The Observatory 24,
373–376 (1901).You can also read