Effects of reproduction and environmental factors on body temperature and activity patterns of wolverines - Thiel et al - Frontiers in Zoology
←
→
Page content transcription
If your browser does not render page correctly, please read the page content below
Effects of reproduction and environmental factors
on body temperature and activity patterns of
wolverines
Thiel et al.

                             Thiel et al. Frontiers in Zoology     (2019) 16:21
                                              https://doi.org/10.1186/s12983-019-0319-8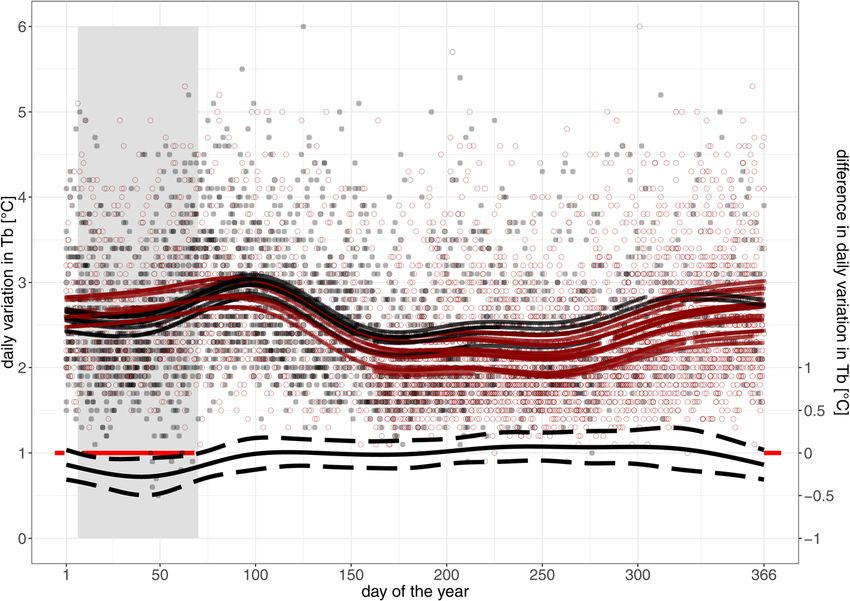
Thiel et al. Frontiers in Zoology (2019) 16:21
https://doi.org/10.1186/s12983-019-0319-8
RESEARCH Open Access
Effects of reproduction and environmental
factors on body temperature and activity
patterns of wolverines
Alexandra Thiel1* , Alina L. Evans1, Boris Fuchs1, Jon M. Arnemo1,2, Malin Aronsson3,4 and Jens Persson4
Abstract
Background: Mammals in the far north are exposed to extreme seasonal changes in environmental conditions,
such as temperature and photoperiod, which have notable effects on animal physiology and behaviour. The
wolverine (Gulo gulo) is a carnivore with a circumpolar distribution and well-adapted to extreme environmental
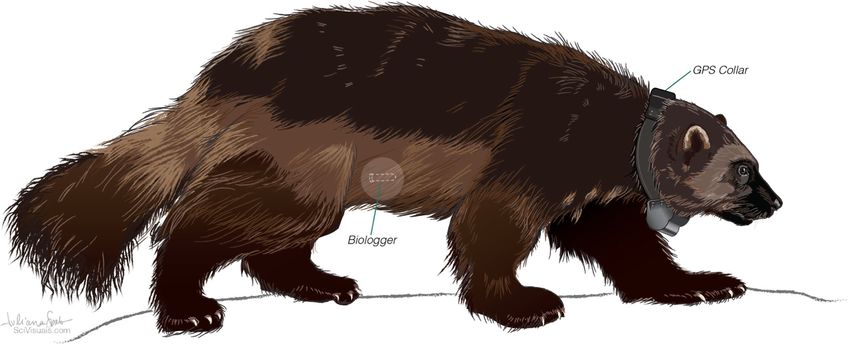
conditions. Still, ecophysiological studies on free-ranging wolverines are lacking. In this study, we used abdominally
implanted body temperature loggers in combination with GPS collars with acceleration sensors on 14 free-ranging
wolverines in northern Sweden to study daily and seasonal variation in body temperature and activity patterns. We
used generalized additive mixed modelling to investigate body temperature patterns over time and Lomb-Scargle
periodogram analysis to analyse circadian rhythms.
Results: We found that wolverines have an average core body temperature of 38.5 ± 0.2 °C with a daily variation of up
to 6 °C. Body temperature patterns varied between reproductive states. Pregnant females showed a distinct decrease in
body temperature during gestation. Wolverines were active both in day and night, but displayed distinct activity peaks
during crepuscular hours. However, body temperature and activity patterns changed seasonally, with a gradual change
from a unimodal pattern in winter with concentrated activity during the short period of day light to a bimodal pattern
in autumn with activity peaks around dusk and dawn. Wolverines were less likely to display 24-h rhythms in winter,
when hours of day light are limited.
Conclusions: The combination of different biologging techniques gave novel insight into the ecophysiology, activity
patterns and reproductive biology of free-ranging wolverines, adding important knowledge to our understanding of
animals adapted to cold environments at northern latitudes.
Keywords: Biologging, Circadian rhythm, Ecophysiology, Gestation, Heterothermy, Northern ecosystem, Seasonality
Background amplitude reported for a free-living large mammal that
Knowledge of an animal’s body temperature (hereafter: does not use torpor (Aardvark [Orycteropus afer]) was
Tb) profile provides information on thermoregulation, 8.6 °C, during reduced prey availability [4]. Changing en-
physiology and behaviour, as well as insight into ani- vironmental conditions not only impact seasonal and
mals` response to changing environmental conditions daily patterns of Tb in mammals [5–8] but also the cir-
[1]. Despite large thermal fluctuations, endothermic cadian rhythmicity of activity [9]. Circadian rhythms are
species are able to regulate Tb within a species-specific daily oscillations, which are at least partly endogenously
narrow range and hence maintain relatively stable core controlled and recur in approximately 24-h intervals
Tb (homeothermy). In mammals, species-specific normal [10]. For instance, several species in the far north lack
Tb varies from 30 to 40 °C [2] and often displays daily circadian rhythmicity in activity in summer, when the
oscillations of 1–4 °C [3]. However, the greatest daily sun never sets [11, 12], indicating the importance of the
light-dark cycle as a Zeitgeber to entrain circadian
* Correspondence: alexandra.thiel90@gmx.de rhythms. Still, Arctic ground squirrels (Spermophilus
1
Department of Forestry and Wildlife Management, Inland Norway University
of Applied Sciences, Campus Evenstad, NO - 2480 Koppang, Norway
parryii) maintain circadian rhythms under constant light
Full list of author information is available at the end of the article conditions [13]. Studies of animals in laboratory conditions
© The Author(s). 2019 Open Access This article is distributed under the terms of the Creative Commons Attribution 4.0
International License (http://creativecommons.org/licenses/by/4.0/), which permits unrestricted use, distribution, and
reproduction in any medium, provided you give appropriate credit to the original author(s) and the source, provide a link to
the Creative Commons license, and indicate if changes were made. The Creative Commons Public Domain Dedication waiver
(http://creativecommons.org/publicdomain/zero/1.0/) applies to the data made available in this article, unless otherwise stated.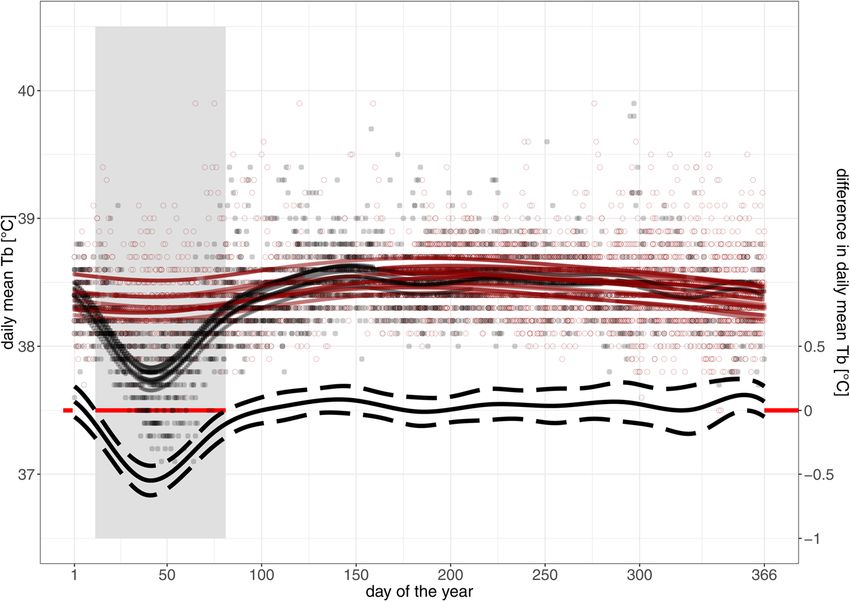
Thiel et al. Frontiers in Zoology   (2019) 16:21                                                                  Page 2 of 11

suggest that daily rhythms in Tb and activity are highly cor-    and summer. Our aim was to increase the under-
related [14–16], but this relationship is largely unexplored     standing of physiological and behavioural characteris-
in free-ranging animals (but see [17, 18]). Studies in labora-   tics of a species that is considered highly adapted to
tory conditions have also found a profound influence of          cold climate (Fig. 2c).
pregnancy on the physiology of mammals and Tb in par-
ticular [19–21]. This is expected to be present under nat-       Methods
ural conditions as well. For instance, pregnant female lions     Study area
(Panthera leo) exhibit gestational hypothermia and decrease      The study area encompasses approximately 7000 km2
their Tb by 1.3 °C during gestation [22].                        and is located in and around the Laponia UNESCO
   Species that are adapted to cold climates, such as the        World Heritage site (Kvikkjokk 67°00′N, 17°40′E, Fig. 1)
wolverine (Gulo gulo; [23–25]), may be particularly vul-         . The area is characterized by deep valleys at about 300
nerable to rising ambient temperatures associated with           m above sea level (m.a.s.l.) and high mountainous plat-
global warming [25–27]. The need for a framework in-             eaus of bare rock and glaciers with peaks up to 2000 m
corporating ecology and physiology of cold-adapted               a.s.l. Tundra represents 57% of the study area and forest
mammals to identify vulnerability to winter climate              36% [42]. Valleys are dominated by mountain birch
change has been emphasized [28], as well as a need for           (Betula pubescens), Scots pine (Pinus sylvestris), and
long-term measurements of physiology of mammals in               Norway spruce (Picea abies), while mountain birch
cold environments [29]. Current information on wolver-           forms the tree line at 600–700 m a.s.l [43]. The climate
ine thermal physiology is limited to a single study of 4         is continental with distinct seasons and the ground is
captive individuals, where Tb was measured 4 times a             usually snow-covered from November to late May, but
day for 82 days during constant daylight and darkness            with large altitudinal variation. Monthly mean ambient
[30]. Thus, information on year-round variation of wol-          temperatures range from − 12 °C in January to 12 °C in
verine Tb in their natural environment and light condi-          July (www.smhi.se; weather station Mierkenis; 66°68′ N,
tions is lacking. While wolverine reproductive biology           16°6′E) and minimum day length (1.5 h) can be detected
has been studied in harvested [31], captive [32] and             in December, whereas maximum day length of 24 h can
radio-collared animals [33–36], information on physio-           be seen when the sun never sets from end of May until
logical characteristics during reproduction is lacking.          mid-July.
Female wolverines display embryonic diapause [31, 37]
after mating (April – August) [37] with implantation oc-         Data collection
curring from December to February. Literature suggests           Adult wolverines were captured by darting from helicop-
a gestation period of 30–50 days [32] and peak partur-           ter in May, June and October 2011–2014. Juveniles were
ition from February to mid–March [36], which is earlier          located by radiotracking the mother and subsequently
than for other northern non-hibernating carnivores [25].         captured on the ground [34, 44]. For individuals not cap-
   In this study, we used intraperitoneally implanted Tb         tured as juveniles (i.e. of known age, n = 5), approximate
loggers to record core Tb in wolverines in northern              age was estimated based on reproductive history [35]
Sweden (Fig. 1). In addition to Tb loggers, wolverines           and/or genetic relatedness to individuals with known age
were equipped with global positioning system (GPS) col-          [45]. Animals were handled, implanted with Tb loggers
lars with acceleration sensors to record locomotor activ-        (Tb loggers: DST Centi, Star Oddi, Gardabaer, Iceland,
ity. The combination of biotelemetry and biologging              46 × 15 mm, 19 g) and VHF abdominal implants (IMP/
helps to link individual behaviour with physiology and           150/L [21 g] and IMP/400/L [~ 95 g], Telonics, Mesa,
energy status, while recognizing individual variation.           Arizona, USA), and adults were fitted with GPS collars
This provides key information for conservation efforts of        (Vectronics-aerospace, Berlin, Germany) according to
endangered species that are difficult to study with con-         established protocols [44, 46]. Adult wolverines were
ventional methods [38] and are affected by human activ-          darted from helicopter with 4 mg medetomidine (Zalopine®
ities [39], such as the wolverine is in Sweden [40].             or Domitor®, Orion Pharma Animal Health, Turku,
Wikelski and Cooke [41] proposed that conservation               Finland) + 100 mg ketamine (Narketan®, Chassot, Dublin,
strategies would benefit from a better understanding of          Irleand). Juveniles were immobilized with 0.1 mg/kg mede-
the physiological responses of organisms to a changing           tomidine + 5 mg/kg ketamine (i.m.). For further informa-
environment.                                                     tion on surgical procedures see Additional file 4. Tb loggers
   The objectives of this study were to describe seasonal        were individually calibrated by the manufacturer over the
changes in wolverine Tb and to explore how reproduct-            range of 5 °C to 45 °C and recorded Tb with a guaranteed
ive state and environmental conditions influence Tb, as          accuracy of ±0.1 °C 1 year post calibration. Loggers were
well as activity. We hypothesize that wolverines will lose       programmed to record Tb every 5, 10 or 15 min. All GPS
circadian rhythmicity in Tb and activity in arctic winter        collars were equipped with activity sensors measuring
Thiel et al. Frontiers in Zoology   (2019) 16:21                                                                        Page 3 of 11

 Fig. 1 The location of the study area in northern Sweden where wolverines where monitored from 2011 to 2014

acceleration continuously 6–8 times per second in 2 or-                 Data for these four individuals were therefore included in
thogonal directions (X and Y axis). Acceleration values were            analysis of daily mean Tb but days, with replaced data were
averaged for each direction for a recording interval of 5               excluded from analyses with daily variation as response
min, ranging from 0 to 255 for each axis and the sum was                variable. In total, we used 1,027,345 Tb measurements from
used to present overall activity, resulting in values from 0 to         14 wolverines in 32 individual years and 922,673 activity
510 [47]. Animals were recaptured in order to retrieve Tb               measurements from 10 wolverines in 18 individual years.
loggers and GPS collars, and to downloaded data. In total,
Tb data were obtained from 14 wolverines (13 females and                Reproductive state
1 male; 4 months to 10 years old), after 2–24 months of                 Female reproductive state was defined as either pregnant
data collection. For 10 of these wolverines, activity data was          or non-pregnant based on daily mean Tb. Females were
obtained for the same time period as Tb (9 females and 1                defined as pregnant if they showed a distinct pattern of
male). Data from the week of capture and fever events                   continuously decreasing Tb in the beginning of the year
(daily mean Tb > = 40 °C) were excluded from all analyses.              (Additional file 1). This distinct pattern of decreasing Tb
Three of the animals were found dead (2–16 months after                 during gestation was evident in at least one breeding sea-
capture) and data from the day of death were excluded. We               son for all 8 females older than 2 years, and in 10 out of
identified 4 occasions in 4 individuals when when Tb                    13 (77%) individual breeding seasons. Denning was docu-
dropped to unrealistic low Tb values (< 34 °C), followed by             mented subsequent to these 10 pregnancies in 4 cases and
immediate return to baseline values, indicating Tb logger               cubs were observed in June in 3 cases (J. Persson, unpub-
failure. These observations were identified and replaced by             lished data). Pregnancy was not detected in any of the 2
the average of the 3 previous and subsequent observations.              years-old females, although females can reproduce at this
Thiel et al. Frontiers in Zoology      (2019) 16:21                                                                                           Page 4 of 11

  A
  body temperature [°C]

                              39

                              38

                              37
                                   0           100                               200                                300
                                                                      day of the year
  B
                             400
  activity units

                             300

                             200

                             100

                               0
                                   0           100                               200                                300
  C                                                                   day of the year
  ambient temperature [°C]

                                                                                                                                                   24
                              20                                                                                                                   18

                                                                                                                                                      Day length [hours]
                                                                                                                                                   12
                                                                                                                                                   6
                               0                                                                                                                   0

                             −20

                                   0           100                               200                                300
                                                                      day of the year
 Fig. 2 Daily averaged (a) body temperature (Tb, [°C]) and (b) activity of each individual wolverine (grey line) and all individuals together (pregnant
 individuals: black dots, non-pregnant individuals: hollow circles) and (c) daily averaged ambient temperature from 2011 to 2014 [°C] (black lines) and
 day length [hours] (orange line)

age [35]. The date of implantation was determined as the                       Statistical analysis
day when the trend of decreasing Tb began, using change-                       To investigate the annual variation in wolverine Tb
point analysis for daily mean Tb in the R package ‘change-                     and test for differences between reproductive states
point’ [48]. This method detects multiple change points in                     throughout the year we fitted Generalized additive
a time series using a pruned exact linear time (PELT)                          mixed models (GAMM) with the function “bam”
algorithm, which identifies the maximum number of                              from the R package “mgcv” [51, 52]. GAMMs are par-
segments a time series can be split into [49], and has                         ticularly suitable for handling non-linear relationships
been applied for changes in Tb [50]. Date of parturition                       between response and predictor and handling autocor-
was determined as the day when mean Tb showed a sud-                           relation [53]. We used daily mean Tb as response variable,
den increase (Additional file 1), resulting in values com-                     added a fitted smooth term for day of the year (DOY, 1–
parable to normal Tb, reached within a few days.                               366), an ordered factor for reproductive state (pregnant
Additionally, activity and location data from GPS collars                      vs. non-pregnant) and an ordered-factor-smooth-inter-
were used to assess date of parturition. It was determined                     action term for day of the year multiplied by reproductive
as the day in which daily mean activity showed a sudden                        state. We included a random intercept and slope for each
decrease (Additional file 1) followed by low values over                       wolverine ID and added an autoregressive model (AR1)
several days, and when location data showed that a female                      structure to account for detected residual temporal auto-
remained in a very restricted area for several consecutive                     correlation. We applied the “gam.check” function of the
days. For non-pregnant females, corresponding gestation                        “mgcv” package to choose adequate basis dimension of k
period was determined as the period between the average                        [51]. The difference of daily mean Tb between reproduct-
date of implantation and parturition of pregnant females.                      ive states was considered significant on days when the
Thiel et al. Frontiers in Zoology (2019) 16:21 Page 5 of 11 95% confidence interval of the modelled difference did question (binomial variable) as response variable. We not overlap zero. added a smooth term for DOY and a random intercept To investigate annual heterothermy we calculated the and slope for each wolverine ID. We checked for autocor- daily variation in Tb, defined as the individual range in relation in each model and decided that it was in an ac- wolverine Tb (individual daily maximum Tb – minimum ceptable range and including an autocorrelation structure Tb). We fitted GAMMs on the individual daily variation not necessary (Additional file 3). in Tb as response variable with the same combination of Means are presented with associated standard devi- smooth terms, random structure and AR1 structure as ation (mean ± SD) in the following text, if not otherwise in the model for annual variation in daily mean Tb. stated. To investigate the daily relationship between Tb, activ- ity, photoperiod and ambient temperature (Ta) graphic- Results ally, we averaged these parameters hourly for every Annual variation in body temperature individual, but excluded pregnant females during the On an annual basis, daily mean Tb for non-pregnant fe- time of gestation. We used a gam smoother with cubic males (n = 6) was 38.5 ± 0.2 °C, and the range of individ- spline function in the R package ggplot [54] on these ual daily variation was 0.9–6.0 °C (mean: 2.5 ± 0.7 °C). A hourly values averaged over each season to interpret steady decrease in daily mean Tb, indicating gestational visually how daily patterns in Tb and activity co-vary hypothermia (Fig. 2a), revealed 10 pregnancies for 8 fe- with Ta and photoperiod. Seasons were defined accord- males > 2 years old and that all adult females were preg- ing to the Swedish Meteorological and Hydrological nant at least once. These 8 females were considered Institute (SMHI) based on ambient temperature climate pregnant during 10 individual breeding seasons in fur- indicator as the following: Winter (December – Febru- ther statistical analysis. Pregnancy was not revealed in ary), Spring (March – May), Summer (June – August), either of the 2 – year old females (n = 2). Autumn (September– November) [55]. Hourly Ta data Non-pregnant wolverines showed a non-linear trend were obtained from the SMHI weather station in Mierkenis, of increasing and decreasing daily mean Tb over the Sweden. Sunrise, sunset, dawn, dusk and day length for the year. Lowest predicted values were found on day (DOY) study area were calculated using the R packages "rgeos" and 42 with 38.3 °C (95% CI: 38.2–38.4 °C), followed by an "maptools" [56, 57] and defined as followed: sunrise and increase with predicted peak Tb on DOY 196 with sunset are the points at which the top edge of the 38.6 °C (95% CI: 38.5–38.7 °C) and a subsequent de- sun reaches the horizon (i.e. when the top of the sun crease towards the end of the year (Fig. 3). Daily mean < 1° below the horizon), dusk and dawn were defined Tb of pregnant females (n = 8) was significantly lower as the onset and end of civil twilight (i.e. when the than for non-pregnant females from DOY 12–81 (i.e. sun is 6° below the horizon in the morning and even- modelled maximum difference of − 0.5 °C [95% CI: − 0.4 ing, respectively). – − 0.6 °C] on DOY 41) but did not differ for the rest of To investigate periodicity of circadian rhythms in Tb the year (Fig. 3). At the day before parturition, pregnant and activity we used Lomb-Scargle periodogram analysis females had a daily mean Tb of 37.5 ± 0.2 °C, which pre- in the R package "lomb" [58]. This method can detect sented a decrease by 0.8 ± 0.3 °C when compared to Tb periodicity in irregular spaced time series with missing in December. values [58]. Analyses were performed on the raw data on a 15-day rolling window, i.e. we defined the periods by Daily variation in body temperature and activity the DOY, selected 7 days on either side, performed the Similar to daily mean Tb, daily variation in Tb of preg- analysis and moved one DOY ahead. We tested for pres- nant and non-pregnant wolverines differed significantly ence and significance of rhythms between 2 and 30 h, se- from each other during the time of gestation, but lected the highest significant peak and rounded it to the showed similar patterns throughout the rest of the year. full hour. Significant periodicity was recognized when Pregnant females had significantly lower daily variation peaks in the Lomb-Scargle periodogram exceeded the than non-pregnant individuals from DOY 7–70 with a 95% confidence limit. We determined the two most fre- modelled maximum difference of − 0.3 °C (95% CI: − 0.1 quent period lengths (24 or 12 h), displayed by wolver- – − 0.5 °C) at DOY 40 (Fig. 4). Daily variation in Tb of ines over the year and converted them into a binomial non-pregnant females increased in the beginning of the variable with 1 representing an approximate 24 or 12 h year with a peak of 2.9 °C (95% CI: 2.8–3.0 °C) on DOY rhythm that day and 0 representing lack of a 24 or 12 h 85, followed by a steep decrease during summer with rhythm. To investigate if the probability of wolverines lowest value of 2.1 °C (95% CI: 2.0–2.2 °C) at DOY 251 displaying a 24 or 12 h rhythm in Tb and activity and a second increase towards the end of the year (Fig. 4). changes over the course of a year, we fitted separate bi- Daily patterns of both Tb and activity varied seasonally. nomial GAMMs on the presence of the rhythm in In winter (December – February) wolverines showed an
Thiel et al. Frontiers in Zoology     (2019) 16:21                                                                                            Page 6 of 11

 Fig. 3 Daily mean body temperature (Tb) [°C] for eight pregnant (black hollow circles) and six non-pregnant wolverines (red hollow circles) over
 the year (day of the year 1 = 1st January). Fitted values from GAMM model are presented for pregnant (black lines) and non-pregnant individuals
 (red lines). On the bottom, the black line shows the average modelled difference in daily mean Tb [°C] with 95% CI (dashed lines) between pregnant
 and non-pregnant wolverines, with a red line at 0 °C difference in the background as a reference level. The grey ribbon in the background shows the
 time span in which Tb of pregnant females is significantly different from Tb of non-pregnant wolverines

 Fig. 4 Daily variation in body temperature (Tb) [°C, individual daily mamimum Tb – minimum Tb] for eight pregnant (black hollow circles) and six
 non-pregnant wolverines (red hollow circles) over the year (day of the year 1 = 1st January). Fitted values from GAMM model are presented for
 pregnant (black lines) and non-pregnant individuals (red lines). On the bottom, the black line shows the average modelled difference in daily
 variation in Tb [°C] with 95% CI (dashed lines) between pregnant and non-pregnant wolverines, with a red line at 0 °C difference in the background
 as a reference level. The grey ribbon in the background shows the time span in which daily variation in Tb of pregnant females is significantly different
 from Tb of non-pregnant wolverines
Thiel et al. Frontiers in Zoology       (2019) 16:21                                                                                      Page 7 of 11

             39.00                           Winter                                                          Spring
  Tb [°C]

             38.75
             38.50
             38.25
             38.00
              300
  Activity

              200
              100
                0

               10
  Ta [°C]

                0
              −10

             39.00                           Summer                                                           Autumn
  Tb [°C]

             38.75
             38.50
             38.25
             38.00
  Activity

              300
              200
              100
                0
  Ta [°C]

               10
                0
              −10
                     0    3         6    9     12      15   18    21 23       0        3        6        9       12       15      18       21 23
                                Time of day [hours]                                                 Time of day [hours]
 Fig. 5 Seasonal patterns in body temperature (Tb, [°C]) and activity patterns found in wolverines 2011–2014 in Sarek study area. Hourly and
 seasonal mean Tb (orange line), activity (grey line) and ambient temperature (Ta, [°C], blue line) are presented with 95% CI in shaded grey,
 applying a cyclic cubic regression spline smoother for time of the day. Grey lines in the background represent individual hourly and seasonal mean
 values in Tb and activity. Changes in photoperiod are indicated at the bottom of each plot (black bar = darkness, grey bar = dawn/dusk,
 white bar = sunlight)

unimodal pattern in Tb. Activity peaked around the same                      follows the same pattern with attenuated amplitude
time as Tb but drops faster than Tb (Fig. 5, Winter).                        (Fig. 5, Autumn).
During this period there was, on average, only 2–4 h
of daylight and little variation in Ta during the day                        Circadian rhythms in Tb and activity
and wolverines concentrated their activity between                           In total, 24 h circadian rhythms were present in 54
dawn and midday. In spring (March – May) wolver-                             and 50.6% of the time for Tb and activity, respect-
ines were least active during the time of daylight                           ively. Significant 12 h rhythms in Tb were present in
with lowest values in the afternoon but were active                          23.5% and in activity for 23.8% of the time. This
on a constant level during night. Tb varied little but                       means that the majority of rhythms displayed by wol-
followed the same trend (Fig. 5, Spring). In summer                          verines over the year consisted of 24 and 12 h
(June – August) Tb and activity followed the same                            rhythms (Tb: 77.5%, activity: 74.4%). The probability
trend as in spring. Highest values could be detected                         that wolverines displayed either of the two rhythms
just after sunrise, followed by a gradual decrease                           changed annually (Fig. 6). The highest probability that
with lowest values in the late afternoon, which coin-                        wolverines display a 24 h circadian rhythm in Tb was
cided with highest Ta , followed by gradual increase                         detected in April on DOY 111 with 61% [CI: 53–
towards the end of the day (Fig. 5, Summer). In au-                          67%] (Fig. 6a). The highest probability for a 24 h cir-
tumn (September – November) wolverines showed a                              cadian rhythm in activity was detected in July on
bimodal pattern in activity with highest values just                         DOY 194 with 67% [CI: 54–77%] (Fig. 6b). In January
after sunrise, followed by lowest values in late after-                      wolverines displayed the lowest probability of 24 h
noon and another smaller peak just after sunset. Tb                          rhythm in both Tb (39% [CI: 32–47%]) and activity
Thiel et al. Frontiers in Zoology (2019) 16:21 Page 8 of 11
A 100 24
20
Probability of rhythm [%]
75
Daylength [hours]
16
50 12
8
25
4
0 0
0 100 200 300
day of the year
B 100 24
20
Probability of rhythm [%]
75
Daylength [hours]
16
50 12
8
25
4
0 0
0 100 200 300
day of the year
Fig. 6 Prediction plots of probability of 24 h (black line) or 12 h (grey line) rhythm in body temperature (a) and activity (b) over the course of a
year for wolverines, monitored from 2011 to 2014 in Sarek study area. Dashed lines represent 95% confidence interval, orange lines represent
associated day length and black dots represent binary results of Lomb-Scargle Periodgram analysis (100 = rhythm present, 0 = rhythm absent).
Tb: n = 14 individuals, activity: n = 10 individuals
(36% [CI: 28–45%]). The probability of 12 h rhythms individual months (Additional file 2), which indicates a
in both, Tb and activity followed an inverse trend of high level of heterothermy. The ability to cope with cold
the 24 h rhythm and was generally lower (Fig. 6). temperatures by being locally heterothermic and apply-
ing peripheral cooling [59–61] is widely accepted but
Discussion evidence for heterothermy of core Tb in circumpolar
We showed that wolverine Tb varies over the year and is species is lacking. Increased heterothermy in wolverines
influenced by reproductive state. Reproducing females could be caused by regular events of reduced Tb, which
had significantly lower daily mean Tb and daily variation in turn may be driven by an inadequate energy intake, as
in Tb than non-reproducing females from early January expected in cold environments [29]. Animals, which face
to early March. Seasonally varying Tb and activity pat- inadequate energy intake may benefit from a reduced
terns suggest that generally wolverines are active both metabolic demand, accompanied by decreased Tb. We
day and night, with peaks during crepuscular hours. The observed the highest daily variation and lowest mean Tb
probability of 24 and 12 h rhythms in Tb and activity from December – April (Additional file 2). A decrease
changes annually and is lowest in winter time. from 38.5 °C to 35.8 °C Tb in March (Additional file 2) at
Mean wolverine Tb was 38.5 ± 0.2 °C, which is compar- an average Ta of − 10 °C represents a 5.5% energy saved
able to previous observations of Tb in captive wolverines (Additional file 4). This period is characterized by the
[30]. Wolverines showed a mean daily variation in Tb of lowest ambient temperatures and relatively low and un-
2.5 ± 0.7 °C which can be considered normal daily oscil- predictable food availability for wolverines, as migrating
lations for mammals (1–4 °C; [3]). Maximum daily varia- semi-domestic reindeer, the main prey, return, from win-
tions in Tb exceeded 4 °C occasionally in 60% of the ter grazing lands in late April and early May [62]. TheThiel et al. Frontiers in Zoology (2019) 16:21 Page 9 of 11
daily variation in Tb is suggested to provide an index of in northern ecosystems ungulate mortality increases due
any compromise experienced by a free-ranging large to starvation, avalanches or weakened animals [74]. Ac-
mammal, reflecting response to challenging environmen- cordingly, wolverines are seasonally flexible in feeding
tal conditions or effects of endogenous factors [29]. strategy, shifting from mainly predation in spring and
From November – April most our study area is snow summer to scavenging in winter, as a response to in-
covered and wolverines are exposed to increased risk of creased carrion supply [75]. Changes in food availability
mortality, due to poaching facilitated by use of snowmo- feeding strategy may result in different activity patterns
biles [40, 63]. During this period, wolverines select and attenuation of circadian rhythmicity in winter.
stronger for steep and rugged habitats that hinders Hence, photoperiod may not be the only influential fac-
snowmobile use [63, 64], indicating an influence of hu- tor, entraining circadian rhythms of wolverines in north-
man disturbance on behaviour and habitat use. Further- ern Sweden. Furthermore, circadian rhythmicity may
more, human disturbance can have direct effects on the also be influenced by a high individual component,
physiology of individuals by a rise in Tb, heart rate and/ which in turn may be influenced by e.g. demographic
or metabolic rate [65–67]. The potential effect of human patterns and human disturbance.
disturbance on both behaviour and physiology, sug-
gests that snow season may represent the time of the Conclusion
year wolverines experience the biggest compromise, The use of combined biologging techniques shed new
expressed by heterothermy. light into the physiology, activity patterns and reproduct-
Moreover, we found that the pattern of daily mean Tb ive biology of wolverines. This adds new information on
of female wolverines differed between reproductive a species, adapted to cold climates, which could not be
states, as reproductive females had significantly lower Tb obtained with other methods. Knowledge on ecophys-
from day 12–81 than non-reproducing females. De- iological characteristics of species are needed to ad-
creased Tb during gestation has been described in both dress further questions of interest, such as potential
domestic [20, 21] and wild mammals [5, 22, 68, 69]. De- vulnerability to effects of climate change and human
creasing Tb during gestation in pregnant female brown encroachment.
bears is presumably caused by changes in progesterone
levels, with maximum progesterone levels during im- Additional files
plantation, followed by a decrease during gestation.
Maintaining stable Tb during gestation and reducing ma- Additional file 1: Graph to illustrate pregnancy determination based on
ternal Tb may minimize hyperthermia events, which daily mean body temperature and activity. (PNG 23 kb)
promotes fetal development [22]. Fetal Tb has been Additional file 2: Table of monthly averaged body temperature of non-
pregnant and pregnant wolverines. (DOCX 13 kb)
found to be dependent on and approximately 0.6 °C
Additional file 3: Autocorrelation plots of GAMM models. (DOCX 592 kb)
higher than maternal Tb [21]. Cell division stops at Tb
Additional file 4: Details about surgery and energy calculations. (DOCX 16 kb)
higher than 40 °C [70], which makes a fetus potentially
vulnerable to hyperthermia events [21].
Abbreviations
Wolverines modified Tb and activity patterns over the CI: Confidence interval; DOY: Day of the year; GAMM: Generalised additive
year relative to photoperiod and ambient temperature. mixed effect model; GPS: Global positioning system; i.m.: Intramuscular;
In general, activity was lowest in afternoon, similar to a m.a.s.l: Meters above sea level; SD: Standard deviation; Ta: Ambient
temperature; Tb: Body temperature
previous study in the same area [71]. Furthermore, activ-
ity patterns changed with season, suggesting that wolver- Acknowledgements
ines may be active both day and night but with distinct Body temperature loggers were provided by the French Space Agency.
peaks during crepuscular hours. Although changes in Tb Captures were conducted by Peter and Einar Segerström.
were slightly delayed compared to changes in activity, Authors’ contributions
both patterns were highly synchronized with peaks This study was conducted within an ongoing project led by JP. JMA, JP and
around the same time. The probability that wolverines ALE conceived this study and participated in the captures. JMA and ALE
deployed and removed the devices. JP and MA compiled activity data and
exhibit a circadian rhythm in Tb and activity was lowest confirmed parturition based on GPS-data. BF compiled the body temperature
during polar nights and increased as the days became data and contributed to the design of the modelling approach. AT analysed
longer. This is contrary to our predictions that wolver- the data and drafted the manuscript. All authors contributed to writing of
the manuscript and approved of the final version.
ines in northern Sweden will lose circadian rhythms in
both polar night and day. Activity patterns in lynx (Lynx Funding
lynx) in northern Scandinavia were not influenced by The study was funded by the Norwegian Directorate for Nature Management,
daylight duration but rather by prey activity patterns the Swedish Environmental Protection Agency, the Swedish Research Council
for Environment, Agricultural Sciences and Spatial Planning (Formas),
[72] and circadian rhythms in sheep were disrupted due Marie-Claire Cronstedt foundation and World Wildlife Fund for Nature,
to environmental and dietary changes [73]. In late winter Sweden.Thiel et al. Frontiers in Zoology (2019) 16:21 Page 10 of 11
Availability of data and materials 16. Refinetti R. Relationship between the daily rhythms of locomotor activity
Data used in this study are archived in the Dryad Digital Repository and will and body temperature in eight mammalian species. Am J Physiol-Regul
be accessible from one year following publication. Pending this time, Integr Comp Physiol. 1999;277(5):R1493–R500.
data are available upon request from the wolverine project leader JP 17. Hayes SR. Daily activity and body temperature of southern woodchuck
(jens.persson@slu.se). (Marmota monax monax) in Northwestern Arkansas. Journal of Mammalogy.
1976;57(2):291–9.
18. Long RA, Martin TJ, Barnes BM. Body temperature and activity patterns in
Ethics approval free-living arctic ground squirrels. Journal of Mammalogy. 2005;86(2):314–22.
Captures, handling, implantation of body temperature loggers, very high 19. Eliason HL, Fewell JE. Thermoregulatory control during pregnancy and
frequency (VHF) implants and fitting of GPS collars were approved by the lactation in rats. J Appl Physiol. 1997;83(3):837–44.
Swedish Ethical Committee on Animal Research for northern Sweden, Umeå
20. Fewell JE. Body temperature regulation in rats near-term of pregnancy. Can
(protocol number A13–09) and the Swedish Environmental Protection Agency.
J Physiol Pharmacol. 1995;73(3):364–8.
21. Laburn HP, Mitchell D, Goelst K. Fetal and maternal body temperatures
Consent for publication measured by radiotelemetry in near-term sheep during thermal stress.
Not applicable J Appl Physiol. 1992;72(3):894–900.
22. Trethowan PD, Hart T, Loveridge AJ, Haw A, Fuller A, Macdonald DW.
Improved homeothermy and hypothermia in African lions during
Competing interests gestation. Biol Lett. 2016;12(11):4.
The authors declare that they have no competing interests. 23. Hart J. Seasonal changes in insulation of the fur. Can J Zool. 1956;34(1):53–7.
24. Copeland JP, McKelvey KS, Aubry KB, Landa A, Persson J, Inman RM, et al.
Author details The bioclimatic envelope of the wolverine (Gulo gulo): do climatic
1
Department of Forestry and Wildlife Management, Inland Norway University constraints limit its geographic distribution? Can J Zool-Rev Can Zool.
of Applied Sciences, Campus Evenstad, NO - 2480 Koppang, Norway. 2010;88(3):233–46.
2
Department of Wildlife, Fish and Environmental Studies, Swedish University 25. Inman RM, Magoun AJ, Persson J, Mattisson J. The wolverine’s niche: linking
of Agricultural Sciences, Umeå, Sweden. 3Department of Zoology, Stockholm reproductive chronology, caching, competition, and climate. Journal of
University, Stockholm, Sweden. 4Department of Ecology, Grimsö Wildlife Mammalogy. 2012;93(3):634–44.
Research Station, Swedish University of Agricultural Sciences, Riddarhyttan, 26. Gilg O, Kovacs KM, Aars J, Fort J, Gauthier G, Gremillet D, et al. Climate
Sweden. change and the ecology and evolution of Arctic vertebrates. Ann N Y Acad
Sci. 2012;1249(The Year in Ecology and Conservation Biology:166–90.
Received: 6 November 2018 Accepted: 20 May 2019 27. McKelvey KS, Copeland JP, Schwartz MK, Littell JS, Aubry KB, Squires JR, et
al. Climate change predicted to shift wolverine distributions, connectivity,
and dispersal corridors. Ecol Appl. 2011;21(8):2882–97.
References 28. Williams CM, Henry HAL, Sinclair BJ. Cold truths: how winter drives
1. McCafferty DJ, Gallon S, Nord A. Challenges of measuring body temperatures responses of terrestrial organisms to climate change. Biol Rev. 2015;
of free-ranging birds and mammals. Animal Biotelemetry. 2015;3(1):33. 90(1):214–35.
2. Clarke A, Rothery P. Scaling of body temperature in mammals and birds. 29. Hetem RS, Maloney SK, Fuller A, Mitchell D. Heterothermy in large mammals:
Funct Ecol. 2008;22(1):58–67. inevitable or implemented? Biol Rev. 2016;91(1):187–205.
3. Refinetti R. The circadian rhythm of body temperature. Front Biosci. 2010;15: 30. Folk GE, Folk MA, Craighead D. Comparison of body temperatures of least
564–94. weasels and wolverines. Comparative Biochemistry and Physiology
4. Rey B, Fuller A, Mitchell D, Meyer LCR, Hetem RS. Drought-induced starvation a-Physiology. 1977;58(3):229–34.
of aardvarks in the Kalahari: an indirect effect of climate change. Biol Lett. 2017; 31. Wright P, Rausch R. Reproduction in the wolverine (Gulo gulo). Journal of
13(7):5. Mammalogy. 1955;36(3):346–55.
5. Mustonen AM, Asikainen J, Kauhala K, Paakkonen T, Nieminen P. Seasonal 32. Mead RA, Bowles M, Starypan G, Jones M. Evidence for pseudopregnancy and
rhythms of body temperature in the free-ranging raccoon dog (Nyctereutes induced ovulation in captive wolverines (Gulo gulo). Zoo Biol. 1993;12(4):353–8.
procyonoides) with special emphasis on winter sleep. Chronobiol Int. 2007; 33. Persson J. Female wolverine (Gulo gulo) reproduction: reproductive costs
24(6):1095–107. and winter food availability. Can J Zool. 2005;83(11):1453–9.
6. Hetem RS, Strauss WM, Fick LG, Maloney SK, Meyer LCR, Shobrak M, et al. 34. Persson J, Landa A, Andersen R, Segerstrom P. Reproductive characteristics
Variation in the daily rhythm of body temperature of free-living Arabian of female wolverines (Gulo gulo) in Scandinavia. Journal of Mammalogy.
oryx (Oryx leucoryx): does water limitation drive heterothermy? Journal of 2006;87(1):75–9.
Comparative Physiology B. 2010;180(7):1111–9. 35. Rauset GR, Low M, Persson J. Reproductive patterns result from age-related
7. Signer C, Ruf T, Arnold W. Hypometabolism and basking: the strategies of sensitivity to resources and reproductive costs in a mammalian carnivore.
Alpine ibex to endure harsh over-wintering conditions. Funct Ecol. 2011; Ecology. 2015;96(12):3153–64.
25(3):537–47. 36. Aronsson M. ‘O neighbour, where art thou?’ Spatial and social dynamics in
8. Turbill C, Ruf T, Mang T, Arnold W. Regulation of heart rate and rumen wolverine and lynx, from individual space use to population distribution
temperature in red deer: effects of season and food intake. J Exp Biol. 2011; [Ph.D thesis]. Uppsala: Swedish University of Agricultural Sciences; 2017.
214(6):963–70. 37. Rausch RA, Pearson A. Notes on the wolverine in Alaska and the Yukon
9. Williams CT, Barnes BM, Buck CL. Persistence, Entrainment, and Function of Territory. The Journal of Wildlife Management. 1972:249–68.
Circadian Rhythms in Polar Vertebrates. Physiology. 2015;30(2):86–96. 38. Cooke SJ. Biotelemetry and biologging in endangered species research and
10. Halberg F. Chronobiology. Annu Rev. Physiol. 1969;31(1):675–726. animal conservation: relevance to regional, national, and IUCN Red List
11. Reierth E, Stokkan KA. Activity rhythm in High Arctic Svalbard ptarmigan threat assessments. Endang Species Res. 2008;4(1–2):165–185.
(Lagopus mutus hyperboreus). Can J Zool-Rev Can Zool. 1998;76(11):2031–9. 39. Krebs J, Lofroth E, Copeland J, Banci V, Cooley D, Golden H, et al. Synthesis
12. van Oort BEH, Tyler NJC, Gerkema MP, Folkow L, Blix AS, Stokkan KA. of survival rates and causes of mortality in North American wolverines.
Circadian organization in reindeer. Nature. 2005;438(7071):1095–6. J Wildl Manage. 2004;68(3):493–502.
13. Williams CT, Barnes BM, Buck CL. Daily body temperature rhythms persist 40. Persson J, Ericsson G, Segerstrom P. Human caused mortality in the
under the midnight sun but are absent during hibernation in free-living endangered Scandinavian wolverine population. Biol Conserv. 2009;
arctic ground squirrels. Biol Lett. 2012;8(1):31–4. 142(2):325–31.
14. Refinetti R. Phase relationship of the body temperature and locomotor 41. Wikelski M, Cooke SJ. Conservation physiology. Trends Ecol Evol. 2006;21(1):
activity rhythms in free-running and entrained rats. Biol Rhythm Res. 1997; 38–46.
28:19–24. 42. Mattisson J, Andren H, Persson J, Segerstrom P. Influence of intraguild
15. Weinert D, Waterhouse J. Diurnally changing effects of locomotor activity interactions on resource use by wolverines and Eurasian lynx. Journal of
on body temperature in laboratory mice. Physiol Behav. 1998;63(5):837–43. Mammalogy. 2011;92(6):1321–30.Thiel et al. Frontiers in Zoology (2019) 16:21 Page 11 of 11
43. Grundsten C. The Laponian area: a Swedish world heritage site. Fälths 70. López-Sáez J, Gimenez-Martin G. González-Fernández AJZfZuMA. Duration
Tryckeri AB. Stockholm: Swedish Environmental Protection Agency; 1997. of the cell division cycle and its dependence on temperature. 1966;75(3):
44. Arnemo JM, Evans AL. Fahlman Å. Biomedical protocols for free-ranging 591–600.
brown bears, gray wolves, wolverines and lynx. Evenstad. Norway: Hedmark 71. Mattisson J, Andren H, Persson J, Segerstrom P. Effects of Species Behavior on
University College; 2012. Global Positioning System Collar Fix Rates. J Wildl Manage. 2010;74(3):557–63.
45. Hedmark E, Persson J, Segerstrom P, Landa A, Ellegren H. Paternity and 72. Heurich M, Hilger A, Küchenhoff H, Andrén H, Bufka L, Krofel M, et al.
mating system in wolverines Gulo gulo. Wildlife Biol. 2007;13:13–30. Activity patterns of Eurasian lynx are modulated by light regime and individual
46. Fahlman A, Arnemo JM, Persson J, Segerstrom P, Nyman G. Capture and traits over a wide latitudinal range. PLoS One. 2014;9(12):e114143.
medetomidine-ketamine anesthesia of free-ranging wolverines (Gulo gulo). 73. Wyse CA, Zhang X, McLaughlin M, Biello SM, Hough D, Bellingham M, et al.
J Wildl Dis. 2008;44(1):133–42. Circadian rhythms of melatonin and behaviour in juvenile sheep in field
47. Gervasi V, Brunberg S, Swenson JE. An individual-based method to measure conditions: Effects of photoperiod, environment and weaning. Physiol
animal activity levels: A test on brown bears. Wildl Soc Bull. 2006;34(5): Behav. 2018;194:362–70.
1314–9. 74. Wilmers CC, Stahler DR, Crabtree RL, Smith DW, Getz WM. Resource dispersion
48. Killick R, Eckley IA. changepoint: An R Package for Changepoint Analysis. and consumer dominance: scavenging at wolf- and hunter-killed carcasses in
J Stat Softw. 2014;58(3):1–19. Greater Yellowstone, USA. Ecol Lett. 2003;6(11):996–1003.
49. Killick R, Fearnhead P, Eckley IA. Optimal Detection of Changepoints With a 75. Mattisson J, Rauset GR, Odden J, Andren H, Linnell JDC, Persson J. Predation
Linear Computational Cost. J Am Stat Assoc. 2012;107(500):1590–8. or scavenging? Prey body condition influences decision-making in a facultative
50. Evans AL, Singh NJ, Fuchs B, Blanc S, Friebe A, Laske TG, et al. Physiological predator, the wolverine. Ecosphere. 2016;7(8):14.
reactions to capture in hibernating brown bears. Conserv Physiol. 2016;4:11.
51. Wood S. Mixed GAM computation vehicle with automatic smoothness Publisher’s Note
estimation. R package vers 1.8–22. 2017. Springer Nature remains neutral with regard to jurisdictional claims in
52. van Rij J, Wieling M, Baayen RH, van Rijn HJRpv. itsadug: Interpreting time published maps and institutional affiliations.
series and autocorrelated data using gamms. 2016;2:2.
53. Wood SN. Generalized additive models: an introduction with R. New York,
USA: Chapman and Hall/CRC; 2017.
54. Wickham H, Chang W, Wickham MHJCsmRfhcr-powpggpGS. Package
‘ggplot2’. 2013.
55. Kjellstrom E, Boberg F, Castro M, Christensen JH, Nikulin G, Sanchez E. Daily
and monthly temperature and precipitation statistics as performance
indicators for regional climate models. Climate Research. 2010;44(2–3):
135–50.
56. Bivand R, Lewin-Koh N. maptools: Tools for Reading and Handling Spatial
Objects. R package version 0.9–2. 2017.
57. Bivand R, Rundel C. rgeos: Interface to Geometry Engine - Open Source
(‘GEOS’). R package version 0.3–26. 2017.
58. Ruf T. The Lomb-Scargle periodogram in biological rhythm research:
Analysis of incomplete and unequally spaced time-series. Biol Rhythm
Res. 1999;30(2):178–201.
59. Arnold W, Ruf T, Reimoser S, Tataruch F, Onderscheka K, Schober F.
Nocturnal hypometabolism as an overwintering strategy of red deer
(Cervus elaphus). Am J Physiol-Regul Integr Comp Physiol. 2004;286(1):
R174–R81.
60. Irving LJP. Heterothermous operation of warm blooded animals.
Physiologist. 1959;2(2):18–32.
61. Scholander PF. Evolution of climatic adaption in homeotherms. Evolution.
1955;9(1):15–26.
62. Danell AC, Andren H, Segerstrom P, Franzen R. Space use by Eurasian lynx
in relation to reindeer migration. Can J Zool-Rev Can Zool. 2006;84(4):546–55.
63. Rauset GR, Andren H, Swenson JE, Samelius G, Segerstrom P, Zedrosser A,
et al. National Parks in Northern Sweden as Refuges for Illegal Killing of
Large Carnivores. Conserv Lett. 2016;9(5):334–41.
64. Rauset GR, Mattisson J, Andren H, Chapron G, Persson J. When species’
ranges meet: assessing differences in habitat selection between sympatric
large carnivores. Oecologia. 2013;172(3):701–11.
65. Regel J, Putz K. Effect of human disturbance on body temperature and
energy expenditure in penguins. Polar Biol. 1997;18(4):246–53.
66. Macarthur RA, Johnston RH, Geist V. Factors influencing heart rate in free-
ranging bighorn sheep- physiological approach to the study of wildlife
harassment. Can J Zool-Rev Can Zool. 1979;57(10):2010–21.
67. Watts PD, Ferguson KL, Draper BA. Energetic output of subadult polar bears
(Ursus maritimus)- resting, disturbance and locomotion. Comparative
Biochemistry and Physiology a-Physiology. 1991;98(2):191–3.
68. Williams CT, Sheriff MJ, Schmutz JA, Kohl F, Toien O, Buck CL, et al. Data
logging of body temperatures provides precise information on phenology
of reproductive events in a free-living arctic hibernator. J Comp Physiol B-
Biochem Syst Environ Physiol. 2011;181(8):1101–9.
69. Friebe A, Evans AL, Arnemo JM, Blanc S, Brunberg S, Fleissner G, et al.
Factors Affecting Date of Implantation, Parturition, and Den Entry
Estimated from Activity and Body Temperature in Free-Ranging Brown
Bears. PLoS One. 2014;9(7):10.You can also read