Active Management of Flap-Edge Trailing Vortices* - NASA
←
→
Page content transcription
If your browser does not render page correctly, please read the page content below
https://ntrs.nasa.gov/search.jsp?R=20090008660 2019-07-02T08:53:09+00:00Z

                       4th Flow Control Conference, Seattle, Washington, June 23-26, 2008

        Active Management of Flap-Edge Trailing Vortices*

                                                David Greenblatt
                              Technion – Israel Institute of Technology, Haifa, Israel

                                             Chung-Sheng Yao†
                               NASA Langley Research Center, Hampton VA, USA

                                        Stefan Vey,‡ Oliver C. Paschereit¶
                                Berlin University of Technology, Berlin, Germany

                                              Robert Meyer§
                               German Aerospace Center (DLR), Berlin, Germany

            The vortex hazard produced by large airliners and increasingly larger airliners entering
        service, combined with projected rapid increases in the demand for air transportation, is
        expected to act as a major impediment to increased air traffic capacity. Significant reduction
        in the vortex hazard is possible, however, by employing active vortex alleviation techniques
        that reduce the wake severity by dynamically modifying its vortex characteristics, providing
        that the techniques do not degrade performance or compromise safety and ride quality.
        With this as background, a series of experiments were performed, initially at NASA Langley
        Research Center and subsequently at the Berlin University of Technology in collaboration
        with the German Aerospace Center. The investigations demonstrated the basic mechanism
        for managing trailing vortices using retrofitted devices that are decoupled from conventional
        control surfaces. The basic premise for managing vortices advanced here is rooted in the
        erstwhile forgotten hypothesis of Albert Betz, as extended and verified ingeniously by
        Coleman duPont Donaldson and his collaborators. Using these devices, vortices may be
        perturbed at arbitrarily long wavelengths down to wavelengths less than a typical airliner
        wingspan and the oscillatory loads on the wings, and hence the vehicle, are small. Significant
        flexibility in the specific device has been demonstrated using local passive and active
        separation control as well as local circulation control via Gurney flaps. The method is now in
        a position to be tested in a wind tunnel with a longer test section on a scaled airliner
        configuration. Alternatively, the method can be tested directly in a towing tank, on a model
        aircraft, a light aircraft or a full-scale airliner. The authors believed that this method will
        have significant appeal from an industry perspective due to its retrofit potential with little to
        no impact on cruise (devices tucked away in the cove or retracted); low operating power
        requirements; small lift oscillations when deployed in a time-dependent manner; and
        significant flexibility with respect to the specific devices selected.

*
  Invited Paper for the 4th AIAA Flow Control Conference, Seattle, Washington, June 23-26, 2008.
   Senior Lecturer, Faculty of Mechanical Engineering. Senior Member; davidg@technion.ac.il.
†
  Aerospace Engineer, Flow Physics & Control Branch, Mail Stop 170.
‡
  Graduate Student, Chair of Fluid Dynamics, Hermann-Föttinger-Institute, Berlin Institute of Technology, D-10623
Berlin, Germany; stefan.vey@pi.tu-berlin.de.
¶
  Professor, Chair of Fluid Dynamics, Hermann-Föttinger-Institute, Berlin Institute of Technology, D-10623 Berlin,
Germany. Senior Member; oliver.paschereit@pi.tu-berlin.de.
§
  Research Scientist, Engine Acoustics, Institute of Propulsion Technology, Müller-Breslau-Str. 8, 10623 Berlin,
Germany; robert.meyer@dlr.de.

                                                       1
                               American Institute of Aeronautics and Astronautics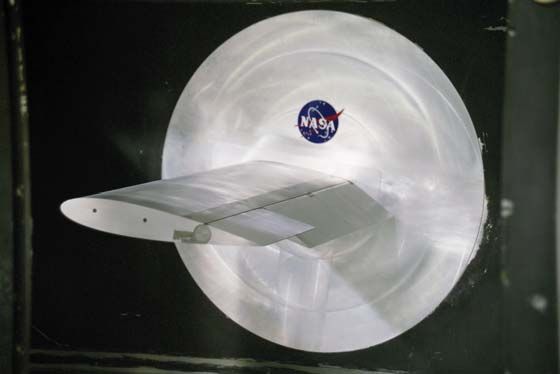
4th Flow Control Conference, Seattle, Washington, June 23-26, 2008

                                                  Nomenclature
AR        =   aspect ratio
ARs       =   semi-span aspect ratio
b         =   wingspan
bs        =   wing semi-span, b/2
c         =   model chord-length
 c        =   mean chord length
CD        =   model drag coefficient
Cl        =   sectional lift coefficient
CL        =   model lift coefficient
CM        =   model moment coefficient
C         =   slot momentum coefficient, h/c(Uj/U )2
f         =   separation control excitation frequency
F+        =   reduced excitation frequency, fX/U
h         =   slot width
hG        =   Gurney flap height relative to the chord
lG        =   Gurney flap span relative to the flap span
Lf        =   flap length, from slot to trailing-edge
q         =   free-stream dynamic pressure
r         =   distance measured form the vortex center
Re        =   Reynolds number based on chord-length
Uj        =   peak jet slot blowing velocity
U         =   free-stream velocity
U,V,W     =   mean velocities in directions x,y,z
X         =   distance from perturbation to wing trailing-edge
x,y,z     =   coordinates measured from model leading-edge and root (left-hand system)
          =   angle of attack
    s     =   static stall angle
          =   flap deflection angle
          =   wavelength
          =   phase shift in degrees
          =   vortex sheet strength, d /dy
          =   bound circulation
          =   rolled-up wake vortex strength
          =   sweep-back angle
    x     =   streamwise vorticity, W/ y– V/ z
*         =   indicates control

                                                I. Introduction

T
        he well-known hazard posed by powerful vortices trailing large commercial airliners (Spalart, 1998, Rossow,
        1999) is particularly severe near airports where planes fly in close proximity and where the relatively low
        flight speeds result in increased vortex strength. Although the vortices are usually transported away by self-
induction or by atmospheric currents, this is not always the case and several accidents have been attributed to vortex
encounters in recent decades. In order to safely avoid wake vortex encounters, inter-aircraft separation standards are
enforced, where larger separation distances are imposed in the wakes of larger airliners. It has long been recognized
that the wake vortex hazard is a major factor contributing to inefficient throughput and delays at busy modern
airports. Moreover, with projected rapid increases in the demand for air transportation (Broderick et al, 2008) and
ever-larger aircraft entering the fleet mix (Kingsley-Jones, 2006), it is expected that the increased hazard will be
significant impediment to increased air traffic capacity.
Recent years have witnessed significant advances in wake detection methods, such as phase microphone arrays (e.g.
Michel and Böhning, 2001), Lidar (e.g. Schmitt et al., 2007) and opto-acoustic sensor arrays (e.g. Fine and Kring,
2005), as well as prediction and simulation (Frech and Holzäpfel, 2008). Effective detection and prediction are vital
to accurately quantify a ‘hazard boundary’ that is used to judge if a given encounter is acceptable (Broderick et al,
2008). Significant potential, however, appears to be associated with vortex alleviation techniques that aim to directly

                                                         2
                                 American Institute of Aeronautics and Astronautics
4th Flow Control Conference, Seattle, Washington, June 23-26, 2008

reduce the wake severity by modifying its vortex characteristics. This could potentially reduce aircraft-following
distances behind the “vortex-alleviated” aircraft (see Savas et al, 2005, Crouch, 2005 and Broderick et al, 2008).
The viability of a vortex alleviation method is quantified by a reduction in the severity and probability a vortex
encounter and the ‘hazard boundary’ can be invoked in the manner mentioned above. Vortex alleviation techniques
employed, however, must not degrade performance or compromise safety and ride quality.
    Effective Vortex alleviation methods fall into two broad categories: time-invariant and time dependent methods.
The former relies on modifying the span loading to establish two or more pairs of opposite-signed counter-rotating
vortices and allow naturally arising instabilities to bring about their linking and mutual destruction (Rennich and
Lele, 1999, Rossow, 1975, Cliffone, 1975, Ortega et al, 2003, Fabre et al., 2002, Durston et al., 2005; Savas, 2005).
In many instances, the required configuration modifications adversely affect aircraft performance and this limits
their potential implementation (Broderick et al, 2008). The latter method actively forces the breakup of vortices, for
example, by pitching the vehicle (Chevalier, 1973) or differentially and time-dependently deflecting inboard and
outboard control surfaces (“sloshing” of the lift distribution; Crow,1971, Crow and Bate, 1976; Haverkamp et al.,
2005). This method was tested in a towing tank (Bilanin and Widnall, 1973), where measured amplification rates
agreed qualitatively with theoretical predictions. Recently, a similar approach was pursued with a view to exploiting
the multiple vortex growth mechanisms created by an airplane on approach with flaps-down (Crouch el al, 2001).
Another approach exploits transient growth or bypass mechanisms of the vortex pair (Pradeep and Hussain, 2006;
Brion et al., 2007). Despite their inherent appeal, active methods must address issues such as “ride quality, dynamic-
load effects on the structure, and the ability to maintain control authority during operation” (Crouch, 2001).
   In the final analysis, it is not sufficient for alleviation methods to be effective. In addition, they must not degrade
performance, not compromise safety and ride quality and it is advantageous if they are aircraft independent, weather
independent, predictable and measurable. Furthermore, they should be of a form that is acceptable to aircraft
manufactures, pilots, air traffic controllers and passengers (Broderick et al, 2008).

                                             II. Objective & Scope
    The objective of this paper is to describe a general method for managing wake vortices by means of local control
of the bound wing circulation in the vicinity of vortex rollup origin. In contrast to other methods, we argue for
vortex alleviation schemes that are decoupled from conventional existing control surfaces. The approach that we
have adopted is experimental. As will be shown, we have used a number of techniques and all have shown promise
in the near wake. The main reason for this is that each approach, passive or active, is rooted in the hypothesis of
Betz (1933), as extended ingeniously by Donaldson and his collaborators (Donaldson et al, 1974).
    All work presented is based on two experimental investigations: the first was conducted at NASA LaRC
(supported by the National Research Council; Greenblatt, 2005, 2006; Greenblatt et al, 2005); and the second was
conducted at the Berlin University of Technology in collaboration with the German Aerospace Center (DLR) (Vey
et al, 2008). The approach adopted here was to build the concept from the ground up, namely: (a) hypothesis, (b)
simple experiment as demonstration of concept, and (c) more complex experiment approaching an airliner
configuration.
    A note on terminology: the terms “active control” and “passive control” have the potential for terminology
confusion. This is because we are controlling both the local circulation or separation on the flap or wing as well as
managing the wake. The term “circulation control” here refers to any alteration of the local wing bound vortex that
does not involve direct control of separation. We also need to distinguish between control of the flow on the flap or
wing and management of the wake vortices; these nomenclature are summarized in table 1. For example, a passive
circulation control (PCC) device such as a Gurney flap, may be deployed in a time dependent manner, leading to
active wake perturbation (AWP). A similar result can be achieved with a traditionally passive separation control
(PSC) device such as a vortex generator. Alternatively, active separation control (ASC) such as zero mass-flux
blowing, can be operated in a time-independent manner (or at time-scale not related to the wake instabilities) to
exploit a passive wake management (PWM) method. The table shows six possible independent combinations, but
there is no reason why the different methods cannot be combined.
Table 1. Summary of the nomenclature adopted here.
                                   Time Invariant deployment                 Time dependent deployment
Passive circulation control (PCC)  Passive Wake Management                   Active Wake Perturbation
Passive separation control (PSC)   (PWM)                                     (AWP)
Active separation control (ASC)

                                                          3
                                  American Institute of Aeronautics and Astronautics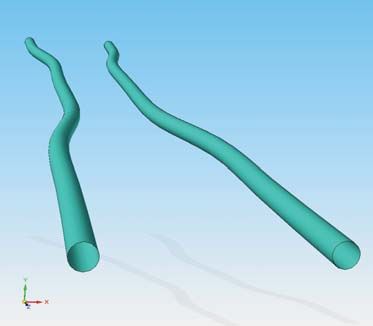
4th Flow Control Conference, Seattle, Washington, June 23-26, 2008

                                      III. Flap-Vortex Control Basics
      All modern airlines have the following in common: they all deploy flaps for takeoff and landing. Thus in the
flight regimes where the hazard is most severe, namely low speed flight in the vicinity of airports, the flap-edge
vortex dominates the ensuing wake structure. This is observed in wind tunnel investigations (de Bruin et al, 1996;
Bellastrada et al, 2002) and flight measurements (Donalson et al, 1974), but is also clearly evident when observing
the contrails in cold or humid weather (see photographs in fig. 1). The pressure drop in the vortices is proportional to
   2
     , and the accompanying drop in temperature produces the contrails visible in the photographs.

Fig. 1. Photographs showing condensation in flap-edge vortices. From the top left (clockwise) Jan-Olov
Newborg; Chris Haag; Ryan Hemmings; Andreas Stoeckl. All photographs reproduced with express
permission. Source of lower two figures: airliners.net.

    Controlling separation or circulation locally, i.e. over some fraction of the flap-span, in the vicinity of the flap
edge, directly affects lift or bound circulation and therefore modifies the vortex sheet strength (or shed vorticity)
 =d /dy. Since the vortex sheet at the flap edge rolls up into the dominating vortex, local separation or circulation
control are strong candidates for directly controlling, or managing, the vortices. Furthermore, decoupling vortex
management from the control surfaces and only applying it selectively, ensures relatively small wing-load
excursions. The aforementioned assertions were initially made by the first author (Greenblatt, 2005, 2007) based on
the method of Betz (1933) as extended by Donaldson et al (1974). The principle computation advantage of Betz’s
method is that it does not explicitly treat the rollup mechanism, but rather employs three conservation relations
between the span-loading ( y ) and the rolling-up vortex        (r ) . Betz employed the conservation of vorticity and
also postulated that the first and second moments of vorticity are conserved: these are referred to as the inviscid
rollup relations. Despite the relative simplicity of the method, it predicts flap vortex details that are in surprisingly
good agreement with full-scale airliner flight tests (Donaldson et al, 1974).
     The basics of the technique, from an active flow control perspective, are described in more detail with respect to
fig. 2. The top part of the figure (a) is a schematic of an aircraft with a flap deflected. The second level (b) shows the
lift (or circulation) variation along the span; the third part (c) represents the absolute value of the vortex sheet
|d /dy|; and the lower part of the figure (d) shows the theoretically predicted rolled-up vortices in the Trefftz plane.

                                                          4
                                  American Institute of Aeronautics and Astronautics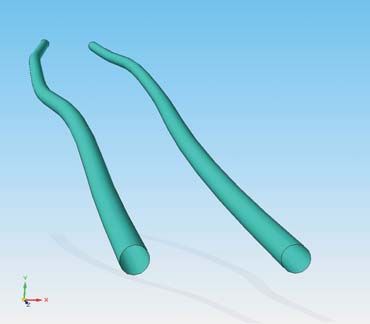
4th Flow Control Conference, Seattle, Washington, June 23-26, 2008

Schematic data is presented for baseline and controlled cases (asterisks indicate control), where the control input is
supplied in the vicinity of the flap edge. Two key aspect of Donaldson’s extension are that the vortex rolls up from
the spanwise locations corresponding to local |d /dy|max and the segment of the sheet between the adjacent two
|d /dy|min are rolled up into the flap vortex. This was verified in a series of full-scale flight tests (Donaldson et al,
1974). For clarity, the figure shows an exaggerated effect of control applied locally near the flap edge. It thus
becomes evident that the flap-edge vortex, and particularly its centroid, is relatively easy to perturb without
producing large overall load changes. If the method is deployed in a time dependent manner, then time dependent
perturbations can be introduced, in a manner that is effective decoupled from the control surfaces.

                                                                       bs
                                                                y*0                    Wing
            (a)
                      Fuselage
                                                  Flap                             Region of local
                                                                                Separation/circulation
                                                C ontrol (*)                          control

            (b)          (y)
                                                No control                                              *
                                                (baseline)

                                                                                                              y
                                                                                    |d */d y|
            (c)      |d/dy|                             |d/dy|

                                                                                                              y
                                       Trefftz plane

            (d)                                                   ’                     ’*
                                                                            r     r*                     ’
                                                  Baseline flap
                                                    vortex
                              Fuselage vortex                                                 Wing-tip
                                                                                                  - vortex
                                                               Controlled flap
                                                                  vortex

Fig. 2. Schematic illustrating the essential elements of the Donladson-Betz Method. (a) wing and flap
configuration; (b) effect of control on the spanwise wing loading; (c) effect of control on the vortex sheet; (d)
rolling-up vortices in the Trefftz plane. Asterisks (*) indicate the controlled case.

                                             IV. Proof of Concept

A. Static Experiments – Inboard Flap Deflection
    Initial experiments were performed as a pilot study on a simply flapped semi-span airfoil model to investigate
the concept and viability of near-wake vortex management by means of boundary layer separation control. The
model used was a NACA 0015 profile (AR=4) and was equipped with zero mass-flux blowing slots, as well as
multiple surface pressure ports (see fig. 3 and further details in Greenblatt, 2005, 2007). Passive control was

                                                         5
                                 American Institute of Aeronautics and Astronautics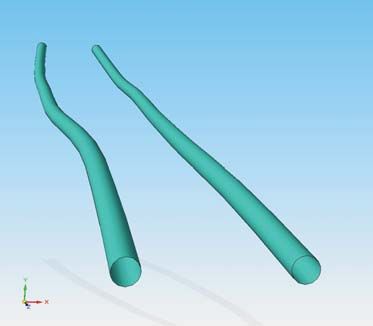
4th Flow Control Conference, Seattle, Washington, June 23-26, 2008

achieved using a simple fairing placed over a control slot and active control was achieved via zero mass-flux
blowing from the slots. The varying lift distribution ( y ) , and hence the vortex sheet strength d /dy, was estimated
by integrating the surface pressures. The vortex sheet strength was then used, together with the rollup relations of
Donaldson and Betz, to predict vortex characteristics. Furthermore, vortices trailing the flaps were mapped using a
seven-hole probe in the near wake (x/c=2). Boundary layer separation control was found to have a marked effect on
vortex location, strength, tangential velocity, axial velocity and size over a wide range of angles of attack and
control conditions. In general, the vortex trends were well predicted by the inviscid rollup relations. Manipulation of
the separated flow near the flap edges exerted significant control over either outboard or inboard edge vortices while
producing small lift and moment excursions.

                     Flap-Shoulder Slot                                20° flap deflection
                   for separation control

                      surface
                   pressure ports

                     NACA 0015
                       AR=4
                   30% Chord Flaps
                                               7 hole probe wake survey

Fig. 3. Photograph of the semi-span wing model used at NASA Langley Research Center, showing the
inboard flaps deflected at 20 degrees and measurements.

    As an example, consider the difference in span loading for inboard and outboard control for the passive case (fig.
4a) and an active case (fig. 4b). The active case was selected such that both inboard and outboard control produce
similar CL and CM (see Greenblatt, 2007). Corresponding wake vorticity, based on seven-hole probe measurements
at x/c=2 for passive and active control, are shown in figs. 5a-5d. Changes to the vortex characteristics between
inboard and outboard control, both passive and active, are compared with those calculated from the rollup relations
in table 2. In general, the predictions of centroid movement and peak velocity ratio are good, while vortex strength
and size ratio only show the correct trends. Both rollup relations and wake measurements show the surprising result
that passive control has a larger effect on the vortex centroid. This is because the fairing was applied on the outboard
slot to seal it and produce only inboard control and vice versa. This results in partial separation control over the part
of the slot with the fairing and hence active control appeared to produce a smaller effect on the centroid than passive
control. Nevertheless, this serves to emphasize the fact that controlling the vortex sheet-strength in the vicinity of the
flap edge can have a large effect on the centroid without significant changes to the overall aerodynamic loads. The
comparison in table 2 also serves to illustrate the limitations of the rollup method. For example, simple passive
control increases the vortex strength by 23% where this is not evident from the 5% increase predicted from the span-
loading. The main reason for the poorer predictions is that the method neglects viscous effects, which become more
important when dealing with the rollup of separated shear layers. Additional data acquired on a deflected outboard
flap indicated vortex changes of y / bs 2.5% trailing the outboard edge of the flap and y / bs 2.7 trailing the
inboard edge.

                                                          6
                                  American Institute of Aeronautics and Astronautics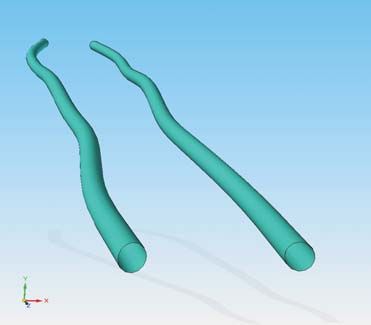
4th Flow Control Conference, Seattle, Washington, June 23-26, 2008
1.6 -0.4 1.6 -0.4
C P,te C P,te
1.2 0.2 1.2 0.2
Cl Cl
0.8 0.8 0.8 0.8
Inboard Passive Control Inboard Active Control
Outboard Passive Control Outboard Active Control
0.4 1.4 0.4 1.4
Re~500,000, =8°, =20°
Re~500,000, =8°, =20°
0 2 0 2
0.00 0.33
y/bs 0.67 1.00 0.00 0.33 y/bs 0.67 1.00
Fig. 4. Span-loading for (a) passive and (b) active inboard and outboard control.
25m/s 2 5m/s
-0.2 -0.2
xc xc
0 0
-200 -200
z/c
z/c
-400 -400
-0.25 -600 -0.2 5 -600
-800 -800
-1000 -1000
-1200 -1200
-1400 -1400
-0.3 -0.3
-1600 -1600
-1800 -1800
(a) (b)
-0.35 -0.3 5
- 0.1 -0.05 0 0.05 0.1 -0.1 - 0.05 0 0.05 0.1
y*o /c y* o/c
25m/s 25m/s
-0.2 -0.2
xc xc
0 0
-200 -200
z/c
z/c
-400 -400
-0.25 -600 -0.25 -600
-800 -800
-1000 -1000
-1200 -1200
-1400 -1400
-0.3 -0.3
-1600 -1600
-1800 -1800
(c) (d)
-0.35 -0.35
-0 .1 -0.05 0 0.05 0 .1 -0 .1 -0.05 0 0.05 0 .1
y*o/c y*o/c
Fig. 5. Seven-hole probe measurements of axial vorticity and in-plane velocity for the scenarios: (a) passive-
inboard control; (b) passive outboard control; (c) active-inboard control; (d) active outboard control (x/c=2).
In summary, the pilot study indicated that local separation or circulation control has the potential for application
to time-independent or time-dependent wake alleviation schemes, where the latter can be deployed to minimize
adverse effects on ride-quality and dynamic structural loading.
7
American Institute of Aeronautics and Astronautics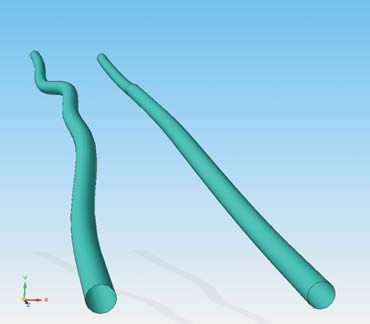
4th Flow Control Conference, Seattle, Washington, June 23-26, 2008

Table 2. Comparison of vortex changes based on inviscid rollup relation predictions and near-wake measurements.
                                               Partial Flap-Passive Control                      Partial Flap-Active Control
                                       7-hole Probe       Donaldson-Betz                 7-hole Probe       Donaldson-Betz
             y / bs (%)                    1.3                  1.5                          0.82                 0.78
               /                            1.23                  1.05                         1.17                    1.27
         V          /V                      1.30                  1.29                         1.38                    1.45
             ,max        ,max

         r1 / r1                            0.71                                               0.62

         r2 / r2                                                  0.82                                                 0.88

B. Dynamic Experiments – Tip-Flap Deflection
    In a follow-up study, the effect control over a deflected flap at the wingtip was investigated. One of the primary
motivations was that optical access for particle image velocimetry (PIV) was possible on the tip flap, but not
possible on the inboard flaps due to limitations of the tunnel optical access. These data revealed that control over the
centroid was significantly less than that achieved on the inboard flaps, but the effect on the axial velocity within the
vortex was dramatic, with the change in flow direction being on the order of magnitude of the free-stream velocity
(see Greenblatt et al , 2005). Much of this study was directed at unsteady effects and the relationship between
separation, or circulation, control time-scales and wake management time-scales; a brief summary and experimental
data set are presented below.

                   1000
                                                     decreasing AR
                                                     increasing Lf/c
                    100

                     10
                                 increasing AR
                                 decreasing Lf/c                                                      present setup
             /b          1                                                                            AR=4; Lf/c=0.3

                     0.1

                                                         dynamic sep. control
                    0.01                                       regime
                                  quasi-steady
                                separation control               or                      effective
                                                             shear layer                separation
                0.001                                                                                   separation control
                                                               control                    control         less effective

              0.0001
                   0.0001                0.001           0.01            0.1               1              10            100
                                                                                    +
                                                                                F
Fig. 6. Relationship between trailing vortex wavelength and separation control frequencies. Solid line is for
AR=8, L f/c=0.25; Top line corresponds to the NASA Langley semi-span wing employed in this study.

    To express wake instability wavelengths in terms of as separation control frequencies, we write the wavelength
as a fraction of wingspan / b U / fb and define the general ratio       X te / c (which is Lf/c for the present setup).
Using the definition of F we can then write / b     / F AR and plot / b versus F for various values of and
AR (see fig. 6). The solid line represents a “typical” airliner configuration ( 0.25 and AR 8 ) and the top

                                                                  8
                                          American Institute of Aeronautics and Astronautics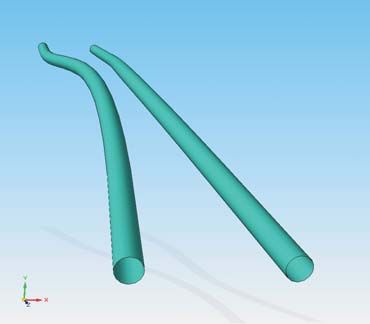
4th Flow Control Conference, Seattle, Washington, June 23-26, 2008

hatched line represents the present configuration (     0.3 and AR 4 ; see section IV.A). Note that the line moves
up with increasing     and decreasing AR , and vice versa. We note from fig. 6 that the high end of the effective
separation control frequencies (approximately F + 3), correspond to wavelengths /b1. At the other end
of the frequency spectrum, when perturbations are introduced typically at F +>3, control perturbations are ineffective
for boundary layer control and dissipate downstream. This corresponds to /c
4th Flow Control Conference, Seattle, Washington, June 23-26, 2008
Fig. 7 shows the effect of both static and dynamic perturbations on the vortex centroids. The effect of separation
control (static perturbation) is to move the vortex downwards and outboard, i.e. ( y/c, z/c) (2.2,3.0)%. Modulation
at Fmod 0.04 has a markedly different effect depending upon the modulation waveform; in both instances shown
here the flow always remains in a state of partial separation. In the case of sinusoidal modulation the vortex centroid
excursions are reduced to ( y/c, z/c) (1.0,2.5)%, primarily because the flow is never fully separated or attached to
the flap. However, when burst modulation is employed the excursions increase to ( y/c, z/c) (3.0,3.5)%. There are
two main reasons for this. Firstly, the flow approaches fully separated and attached states to a greater degree than
that for sinusoidal perturbation due to the abrupt nature of both the perturbation initiation and termination. Unsteady
pressure measurements on the flap revealed that there is an overshoot of the static flap pressures as a result of the
modulation (Greenblatt, 2005). This accounts for the larger movement of the vortex centroid that results from burst
modulation. This was observed at wavelengths as small as /b=0.4, despite the fact that the flow did not fully attach
or fully separate. The unsteady loads on the main element, however, reduced in magnitude. Thus it was
demonstrated that dynamic perturbation of the wake vortices can increase control authority while simultaneously
reducing the already small unsteady loads.
C. Limitations of the Pilot Study
Although the above investigations did show the basic proof of concept, from a wake vortex alleviation viewpoint
it suffered from a number of deficiencies: (i) the investigation was conducted on a semi-span model with simple
flaps and not high-lift devices encountered on modern airlines; (ii) the model did not incorporate sweep that is
prevalent on all modern airliners; (iii) wing loads were not explicitly measured, but rather inferred from surface
pressure measurements; (iv) only near-field (x/c=2) vortex measurements were made. In addition, local separation
control was employed and this was based on the premise that (a) separation occurs on the flaps or (b) separation can
be enforced locally on the flaps. It was asserted that this may somewhat limit the generality of the method. The four
points mentioned above, in addition to the limitation imposed by separation control, were addressed in a follow-up
investigation conducted at the Berlin University of Technology in conjunction with the German Aerospace Center
(DLR).
V. Towards an Airliner Configuration
A. The Experimental Configuration
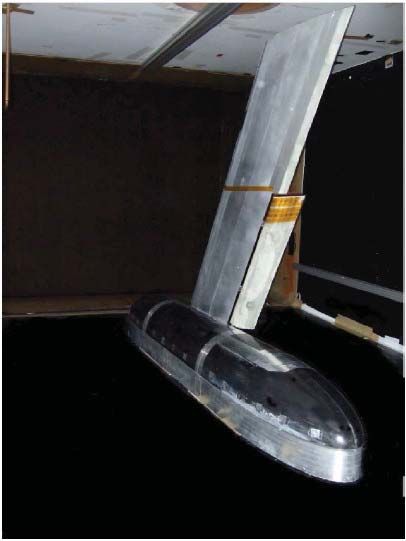
The experimental investigation performed at the Berlin University of Technology was undertaken with the
express purpose of redressing the deficiencies mentioned in the previous section. This investigation was conducted
on a swept constant-chord half-model (fig. 8) incorporating a modern transonic airfoil of a commercial European
airliner ( =30 , bs=1.12m, c=0.45m; AR=5) and a modern three-element high-lift system. The inboard flap and full-
length leading-edge slat were set for a typical landing configuration, with a =32 flap angle and a 26.5 slat angle
(fig. 8b; more details can be found in Vey et al, 2008).
In order to remove any association with separation control, Gurney flaps were used for locally altering the span
loading, i.e. vortex-sheet strength, in the vicinity of the flap edge. These were made from 0.5mm sheet metal and
were fitted to the flap trailing edge. Gurney flap height relative to the chord was designated hG and Gurney flap
length relative to the flap span was designated l G. The investigation was divided into two phases: phase I involved
the static testing of different finite flap-span Gurney flaps (PCC/PWM) in order to isolate the most promising
configurations (see fig. 9a); phase II employed dynamic control of the system, i.e. oscillatory deployment of Gurney
flaps (PCC/AWP) using the configurations isolated in phase I. To achieve this, the Gurney flap was hinged at the
flap trailing-edge and was driven by pushrod actuation. The pushrod was driven by an electric motor and a cam
assembly that was installed in the fuselage of the model. A schematic of the Gurney flap is shown in fig. 9b.
For the static case, aerodynamic loads were measured by means of a six-component force-balance. Furthermore,
the inboard flap was equipped with five rows of pressure ports at the flap edge. The main element incorporated one
row of pressure ports corresponding to the location of the flap edge. The wind tunnel test section was 10m long
facilitating wake measurements within the range x/b 4.5 (x/c 22). Vortex centroids and strength were estimated
from planar two-dimensional particle image velocimetry (PIV) measurements at the two downstream locations x/c=4
and x/c=9 corresponding to x/b=0.80 and x/b=1.81 respectively. (The unexpected phenomenon of flap-edge vortex
breakdown at x/c 15 precluded meaningful measurements further downstream; see discussion below).
10
American Institute of Aeronautics and Astronautics4th Flow Control Conference, Seattle, Washington, June 23-26, 2008
Fig. 8. Photograph of the SCCH-model used in the experimental study at the Berlin University of Technology,
installed in the ISTA 2m×1.41m closed loop return wind tunnel. Inboard flap deflected to 32 (landing
configuration).
Fig. 9. a) Static Gurney flap dimensions and b) Active Gurney flap hinged at trailing edge of flap. Hinge: red,
pushrod: green, horn: blue.
B. Static Vortex Measurements
An example of PIV measurements, conducted at Re=500,000 and =5 are shown in fig 10a to 10d. The vorticity
field x was calculated from the average velocity field, based on 300 image pairs, where several Gurney flap heights
and lengths were tested to determine the dependence of centroid and vortex strength on the specific configuration. A
selection of various cases is shown in the figure where the vorticity fields are depicted for four different
configurations.
11
American Institute of Aeronautics and Astronautics4th Flow Control Conference, Seattle, Washington, June 23-26, 2008
Fig. 10. Vorticity and velocity fields at x/c=4 for: a) baseline b) h G=2%, l G =30% c) h G=4%, l G=30% d)
h G=2%, l G =40%, 2% off the trailing-edge.
Centroids calculated from the vorticity fields are shown in fig. 11. There is an optimum in Gurney flap length in
terms of spanwise centroid shift for the 2% and the 4% Gurney flap at l G=30% for the x/c=4 position. This
observation is fully consistent with the Donaldson-Betz theory, as changes to local bound circulation near the flap
edge have the largest effect on the vortex centroid. As the bound circulation is varied further inboard by the
extended Gurney flaps, as expected, this has a diminishing effect on the flap-edge vortex.
Fig. 11. Centroid shifts (relative to baseline configuration) attained with static Gurney flap. Dotted lines
denote varying Gurney flap length l G, while height h G is kept constant; Re=500,000, =5
Configurations were also tested where the Gurney flaps were located at 2% and 4% of chord from the trailing
edge towards the leading edge. Similar configurations have been tested in flight and it is assumed that this is done
12
American Institute of Aeronautics and Astronautics4th Flow Control Conference, Seattle, Washington, June 23-26, 2008
for reasons related to structural integrity (e.g. Hansen, 2003). Vortex centroid authority in these cases was found to
be significantly reduced when compared to a Gurney flap that is placed flush with the trailing edge. This result is
supported by the findings of Li et al (2003) who varied Gurney flap deflection angle and distance from the trailing
edge. They found that Gurney flap efficiency is highly dependent on distance of placement from the trailing edge.
Furthermore, Gurney flap placement inboard of the flap edge towards the root was also tested. The motivation was
related to developing a vortex perturbation scheme where the Gurney flap slides periodically along the trailing edge.
For these cases no pressure measurements or load measurements were made.
PIV measurements revealed that the lateral (spanwise) and longitudinal vortex centroids behaved differently with
downstream distance. In the former case, centroid displacement increased with downstream distance for both
hG=2% and hG=4%, but longitudinal displacement tended to zero in the later case. Based on theoretical
considerations, the vortex further downstream that has rolled-up more of the vortex sheet and is thus more
representative of the changes to the loading on the wing and, in particular, near the flap-edge. Flap edge pressure
measurements confirmed the relatively strong local effect of the Gurney flaps in this region (Vey et al, 2008).
Fig. 12. Influence of Gurney flaps on aerodynamic loads: a) C L vs for varying Gurney flap length; b) C L vs
for varying Gurney flap height; c) C L vs C D (same configurations as in b); d) Aerodynamic efficiency
(C L/C D ) vs C L . Same Gurney flap configurations in b), c) and d); Re=500 000 and 700 000.
To quantify the changes in lift (CL) and drag (CD) coefficient for different Gurney flap configurations, load
measurements were carried out. Aerodynamic coefficients are based on the geometry of the un-flapped wing (see
Vey et al, 2008 for more details) and some representative data are shown in fig. 12a-12d. As expected, at a
13
American Institute of Aeronautics and Astronautics4th Flow Control Conference, Seattle, Washington, June 23-26, 2008
particular angle of attack, the lift coefficient is shifted towards slightly higher values with larger Gurney flap length;
and the same effect can be seen for larger Gurney flap height (fig. 12b). Nevertheless, these changes are very small:
changes in CL and C D are summarized in table 3 for an angle of attack =5 at Re=500,000. Moreover the
dependence of CL on both Gurney flap height and length is very weak. For example, with l G=30% at =5 an
increase in flap height by from 2% to 4% produces a change in CL of less than 0.01.
Table 3: Changes in CL and CD at =5 for different Gurney flap configurations, based on direct load measurements
at Re=500,000.
hG=2% hG=2% hG=4% hG=4%
l G=30% l G=40% l G=30% l G=40%
CL 0.0495 0.0533 0.0557 0.0722
CD 0.0063 0.0085 0.0075 0.0163
It can be seen from figs. 10c and 10d that drag increases slightly and consequently the aerodynamic efficiency
(CL/C D) decreases when Gurney flaps are installed, but these changes are relatively small with the wing in landing
configuration (see inset). However, to address the problem of increasing drag, three-dimensionality can be added to
the Gurney flaps by means of slits or holes (see Meyer et al, 2006). The introduction of the three-dimensionality
suppresses vortex-shedding, thereby reducing drag. Nevertheless, changes to CL are not materially affected by the
three-dimensionality and this produces an increase on efficiency.
C. Dynamic Vortex Measurements
Two Gurney flap configurations were considered in the dynamic measurements: hG=2% and hG =4% both with a
length of l G =30%. The l G =30% configurations were chosen for active Gurney flap tests based on the trends shown
in fig. 11. Forcing frequencies tested, and corresponding perturbation wavelengths are listed in table 4. The data in
figs. 13a to 16b are not corrected for phase-shift resulting from the finite time delay between the flap-edge trailing-
edge and the measurement location; the oscillating Gurney flap phase shift angles are given in table 4. The
wavelength of the most unstable mode of the Crow instability for the flap vortices is 9b0, were b0 is the initial
separation distance of the rolled up vortices. At a freestream velocity of U =16.2m/s the resulting forcing frequency
would be f = U /(9b0) = 1.61Hz. At these low frequencies, the electric motor used to drive the cam rotated non-
uniformly and hence high-fidelity phase-locked vortex measurements could not be made. The frequencies
considered here are higher corresponding to shorter wavelength instabilities which are growing faster, such as the
Crouch instability. The difference between Crow and Crouch instability is discussed in Crouch et al. (2001)
Essentially the Crouch instability leaves the vorticity centroid of the wing unperturbed while to excite the Crow
instability the vorticity centroid is perturbed. With active Gurney flaps deployed on both inboard and outboard edges
of the flap, both scenarios are realizable (see Greenblatt, 2005, 2007).
Table 4: Forcing frequencies, corresponding wavelengths and the phase shift considered at a velocity of
U =16.2m/s.
f 2.5Hz 5.0Hz 10Hz
/b 2.89 1.45 0.72
(x/c=4) 75° 150° 300°
(x/c=9) 214.7° 69.4° 138.9°
A detailed study was undertaken for the f = 5Hz case ( /b=2.89), where the PIV system was triggered at 8 phases.
Gurney flap deflection angle ( G) relates to phase angle ( ) according to G = 90 sin( /2). Maximum centroid shift
for each case is summarized in table 5. Consistent with the static test, the shift in the z direction is reduced with
downstream distance, whereas shift in y direction (spanwise) is increased. At x/c = 4 centroid perturbations obtained
by means of dynamic Gurney flaps are larger than in the static case. In case of the x/c=9 position this holds true for
the z direction only, y being in the order of the static case. There is no clear dependence of perturbation amplitude
on forcing frequency. Therefore perturbing the vortices at wavelengths smaller than or greater than the wingspan
does not materially change the vortex centroid authority.
14
American Institute of Aeronautics and Astronautics4th Flow Control Conference, Seattle, Washington, June 23-26, 2008
Table 5. Centroid excursions when employing the active Gurney flap at different wavelengths with l G =30%.
x/c=4 x/c=9
f (Hz) /b y/bs z/bs y/bs z/bs
static 1.61 2.59 3.64 0.26
2.5 2.89 2.20 3.40 3.49 0.89
hG=2% 5.0 1.45 2.58 3.24 3.40 0.97
10.0 0.72 2.10 3.52 3.44 1.87
hG=4% 5.0 1.45 2.50 3.15 3.86 0.57
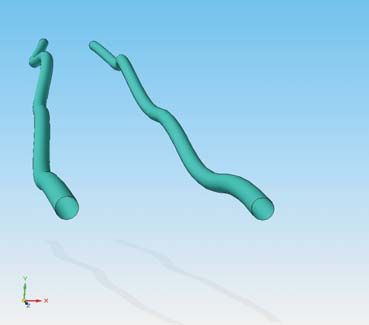
The vortex centroid trajectories are plotted as a function of Gurney flap deflection (0° 360°) for all the
dynamic cases in figures 13 to 16. In the paper of Vey et al (2008), peak vorticity ( x,max) was color encoded in the
plots to reflect the local changes in aerodynamic loads, i.e. changes in shed vorticity as the Gurney flap oscillates
through the cycle. Mutually perpendicular centroid shifts in y and z directions were projected onto the corresponding
axes and the static centroid locations were indicated for comparison. In figs. 13 to 16, a “virtual lens” has been used
to add depth to the image so the vortex tube is not a simple projection onto the plane of viewing, but also a
deformation due to the lens effect. Moreover the vortex movement in y and z directions has been magnified to
clearly show the effect of active Gurney flaps. A surprising observation that was made for all cases, including the
baseline and control cases, was that the flap-edge vortex strength deceased in the downstream direction. The tip
vortex strength, on the other hand, did not diminish as far downstream as x/c=22 (x/b=4.5). In fact, for x/c>9 the
flap-edge vortex strength dropped dramatically and could not be detected with a matrix of tufts. Additionally, smoke
introduced from the edge of the flap indicated what appeared to be vortex breakdown at approximately x/c=15,
although this was not verified by measurements; retrospectively, a simple total head probe could have been used to
establish the existence of a stagnation point. This observation was counterintuitive and not in keeping with data
acquired on wind tunnel models and full-scale airliners; vortex strength generally increases as more of the shed
vorticity is rolled up. The main reason for vortex breakdown appeared to be the combination of large flap deflection
(32°) together with a highly swept trailing-edge ( =30 ). Vortex breakdown has been observed on unswept flap
edges with very large flap deflections, but this usually occurs in the vicinity of the flap-edge and not several chord-
lengths downstream as in the present case. In this regard it is important to note that the present model does not have
the planform of a conventional airliner. Rather, both the leading- and trailing-edges are swept at a constant 30° along
the entire span. The original design incorporated a full-span flap; this was shortened here for the express purpose of
the present study. This unique setup may serve as a vehicle for studying the enigmatic vortex breakdown or bursting
phenomena.
Fig. 13. Vortex trajectories as a function of phase for h G=2%, f=2.5Hz, /b=2.89. Vortex trajectories at: a)
x/c=4 b) x/c=9.
15
American Institute of Aeronautics and Astronautics4th Flow Control Conference, Seattle, Washington, June 23-26, 2008
Fig. 14. Vortex trajectories as a function of phase for h G=2%, f=5Hz, /b=1.45. Vortex trajectories at: a) x/c=4
b) x/c=9.
Fig. 15. Vortex trajectories as a function of phase for h G=4%, f=5Hz, /b=1.45. Vortex trajectories at: a) x/c=4
b) x/c=9.
Fig. 16. Vortex trajectories as a function of phase for h G=2%, f=10Hz, /b=0.72. Vortex trajectories at: a)
x/c=4 b) x/c=9.
16
American Institute of Aeronautics and Astronautics4th Flow Control Conference, Seattle, Washington, June 23-26, 2008
D. Comparison of Different Methods
In this section the present data are compared to the results of other research known to the authors. To account for
the different aspect ratio semispan wings (ARs) used in the various investigations, the maximum attained
perturbation of the vortex centroids is presented in terms of y/bs as well as y/bs×ARs ; the latter term is equivalent
to y / c . The data presented in table 6 was taken in the near field of the wake at various comparable downstream
positions. A truly meaningful comparison would require different control mechanisms to be applied to one and the
same model, with measurements at the same downstream location under identical conditions. Nevertheless, the
comparison presented here provides insight into the various techniques.
Wing tip vortex control by static Gurney flaps was addressed by Matalanis & Eaton (2007a). They equipped the
wing of a half span model with so-called miniature trailing edge effectors (MiTEs) of hG=1.5%. Their experiments
were conducted on a semispan NACA 0012 (AR=4.1) at =8.9 and Re=350,000. The wing comprised with Gurney
flaps deployed on large fractions of span were found to predominately control the vortex in the direction of lift,
whereas Gurney flaps deployed over a small fraction of the span shifted the vortex both in spanwise and lift
direction. This observation is full consistent with Betz’s hypothesis. In their study the measurement plane was
placed at x/c=4.9 downstream of the wing. They also concluded that actively deployable MiTEs may be used for
wake alleviation. In a more recent paper by the same authors (Matalanis & Eaton, 2007b) the tip vortex of the same
model was controlled by rapidly actuated Gurney flaps. Computational simulations by the authors showed that
MiTEs are capable of exciting instabilities in four vortex configurations thus concluding that a reduction in aircraft
spacing rules would be possible. The effect of Gurney flaps on wing tip vortices was also addressed by Nikolic
(2006) who found that the addition of Gurney flaps alters the near field roll-up pattern of a wing tip vortex. He
visualized the vortex structure with tufts, and found that tip vortex “strength” decreased with increasing Gurney flap
height. This is in contrast to theory because Gurney flaps increase the local circulation and therefore vortex strength
should be increasing with growing Gurney flap height. The apparent reduction in vortex strength was probably due
to the wake shed by the Gurney flaps (Meyer et al, 2006) which is rolled up into the vortex, rendering it more
diffuse.
Table 6. Comparison of maximum lateral centroid perturbation for different investigations.
Researcher Wing/Profile type Investigation type y/bs y/bs ARs Re range Meas.
x/ c
Matalanis & NACA 0012 Gurney Flaps of 2.05% 4.10% 350,000 4.9
Eaton (2007a,b) hG=1.5% at the wingtip
Coustols (2004) Very large Continuous and pulsed ~0.42% ~1.9% 450,000 1
transport aircraft blowing at the wing tip 750,000
half-model
Greenblatt Passive and active Passive and active flap 2.70% 5.4% 500,000 2
(2005) flap separation separation control to 106
control
Greenblatt et al Passive and active Passive and active flap 1.4% 2.8% 500,000 2.2
(2006) tip-flap separation separation control 2.2% 4.4% to 106 7.2
control
Gurney flap hG=2%, 2.58% 6.42% 4
l G=30% at the flap edge
Gurney flap hG=4%, 2.8% 6.94% 4
Vey et al (2008) Swept constant- l G=30% at the flap edge 500,000
chord half-model Gurney flap hG=2%, 4.10% 10.17% 700,000 9
l G=40% at the flap edge
Gurney flap hG=4%, 5.30% 13.14% 9
l G=40% at the flap edge
17
American Institute of Aeronautics and Astronautics4th Flow Control Conference, Seattle, Washington, June 23-26, 2008
Finally, Coustols et al. (2004) of ONERA influenced the wing tip vortex of a very large transport aircraft
(VLTA) half-model at 450,000 Re 750,000 by continuous and pulsed blowing at the wing tip. Their work was also
aimed at exciting instabilities in the trailing vortex system. Apart from active control techniques Coustols et al
investigated differential flap settings to create a multiple vortex system with enhanced decay characteristics. It is not
clear if any of these methods are amenable to retrofitting on existing aircraft.
It is evident from table 6 that, in general, control at the flap edge produces larger vortex perturbations than
control at the wingtip. Based on the Donaldson-Betz hypothesis, the main reason for this is because the vortex rolls
up from |d /dy|max: in the case of the wingtip theoretically this is at y=bs where d /dy ; in the case of the flap-
edge region this is at the span-loading inflection point. Thus it is much more difficult to perturb the wingtip vortex
theoretically as small changes to large d /dy will not produce a strong effect. In contrast, in the vicinity of the flap-
edges |d /dy|max is finite and this finite peak must be displaced along the span in order to perturb the vortex in
spanwise direction. This is seen by comparing separation control on inboard and tip flaps (cf. Greenblatt, 2005 and
Greenblatt et al, 2006) where the perturbation is nearly twice as large in the former case. A similar conclusion can
be drawn by comparing Matalanis & Eaton (2007a,b) and Vey et al (2008). More evidence for this hypothesis is
provided by jet blowing into the vortex core, which does not fundamentally alter the span loading i.e. the vortex
sheet from which the vortex rolls up. This might be the reason for the small centroid shifts compared to the other
techniques.
Despite the limitations in progress of the present investigations, the data presented herein and the comparison
shown in table 6 clearly shows the potential of Gurney flaps for wake vortex management, and potentially for vortex
alleviation. To the best knowledge of the authors of this paper, flap edge vortex alleviation using Gurney flaps has
not been applied in the past. Nevertheless, there are projects with the potential to test the method (e.g Hansen, 2003),
where deployable Gurney flaps can be employed on the flaps.
VI. Conclusions
The series of investigations performed initially at NASA Langley Research Center and then subsequently at the
Berlin University of Technology in collaboration with the German Aerospace Center, have demonstrated the basic
mechanism for managing trailing vortices using retrofitted devices that are decoupled from the conventional control
surfaces. The basic premise for managing vortices is rooted in the method of Betz, as extended to flaps by
Donaldson and his colleagues. Using these devices, vortices may be perturbed at arbitrarily long wavelengths down
to wavelengths less than a typical airliner wingspan and the oscillatory loads on the wings, and hence the vehicle,
are small. Significant flexibility in the specific device has been demonstrated using local passive and active
separation control as well as local circulation control via Gurney flaps. Clearly, a combination of devices can be
used, such as vortex generators, and Gurney flaps: the former are used on conventional high-lift systems (e.g. Nield,
1995) and the latter on experimental aircraft (e.g. Hansen, 2003). For application to a wake vortex alleviation
scheme, these “passive” devices must be driven in a time-dependent manner.
The method is now in a position to be tested in a wind tunnel with a longer test section on a scaled airliner
configuration. Alternatively, the method can be tested directly in a towing tank, on a model aircraft, a light aircraft
or a full-scale airliner. The authors believed that this method will have significant appeal from an industry
perspective due its retrofit potential with little to no impact on cruise (devices tucked away in the cove or retracted);
low operating power requirements; small lift oscillations when deployed in a dynamic manner; and significant
flexibility with respect to the specific devices selected.
Acknowledgements
Parts of this work were performed while the first author held a National Research Council–NASA Langley
Research Center Associateship. In this regard, the first author acknowledges W. L. Sellers III, A. E Washburn, L. P.
Melton, and L. N. Jenkins. At the Berlin University of Technology the authors would like to acknowledge the
support of H. Stolpe, R. Nagel and W. Hage.
References
1. Bellastrada, C., Breitsamter, C. and Laschka, B, “Investigation of Turbulent Wake Vortex Originating From a Large
Transport Aircraft in Landing Configuration,” Proc. CEAS Aerospace Aerodynamics Research Conference, 2002, pp
31.1-31.10.
2. Betz, A., “Behavior of Vortex Systems,” Zeit. für angewandte Math. und Mech., Vol. 12, No. 3, June 1932. See NACA
TM 713, June 1933.
18
American Institute of Aeronautics and Astronautics4th Flow Control Conference, Seattle, Washington, June 23-26, 2008
3. Bilanin, A. J., and Widnall, S. E., “Aircraft Wake Dissipation by Sinusoidal Instability and Vortex Breakdown,” AIAA
Paper 73-107, 1973.
4. Brion, V.D. Sipp, and L. Jacquin. Optimal amplification of the Crow instability, submitted to Phys. Fluids (2007).
5. Broderick, A.J. et al, “Wake turbulence, an obstacle to increased air traffic capacity,” Committee to Conduct an
Independent Assessment of the Nation's Wake Turbulence Research and Developmental Program, National Research
Council, ISBN: 0-309-11380-6, www.nap.edu/catalog/12044.html, Accessed April 2008.
6. Cliffone, D. L. and Orloff, K. L., “Far Field Wake-Vortex Characteristics of Wings,” AIAA Journal of Aircraft, Vol.
12, No. 5, 1975, pp. 464-470.
7. Coustols, E., Jacquin, L., Moens, F., Molton, P., “Status of ONERA Research on Wake Vortex in the Framework of
National Activities, European Congress on Computational Methods in Applied Sciences and Engineering
(ECCOMAS),” 2004.
8. Crouch, J. D., “Forcing the Breakup of Airplane Trailing Vortices,” Conference on Capacity and Wake Vortices,
Imperial College of Science, Technology and Medicine, London, England, September 2001.
9. Crouch, J.D. 2005. Airplane trailing vortices and their control. Comptes Rendus Physique. 6:487-499.
10. Crouch, J.D., G.D. Miller, and P.R. Spalart. 2001. Active-control system for breakup of airplane trailing vortices.
AIAA Journal 39:2374-2381.
11. Crow, S., “Stability theory for a pair of trailing vortices,” AIAA Journal, Vol. 8, 1970, pp. 2172-2179.
12. Crow, S. C., “Panel Discussion,” in Aircraft Wake Turbulence and Its Detection, edited by J. H. Olsen, A., Goldburg,
and M. Rogers, 1971, Plenum Press, New York, pp. 580–582.
13. Crow, S. C. and Bate E. R., “Lifespan of Trailing Vortices in a Turbulent Atmosphere,” Journal of Aircraft, Vol. 13,
No 7, 1976, pp. 476–82.
14. de Bruin, A.C., Hegen, S.H., Rohne, P.B. and Spalart, P.R., “Flow Field Survey in the Trailing Vortex System Behind a
Civil Aircraft Model at High Lift,” AGARD-CP-584, 1996, pp. 25-1 to 25.12.
15. Donaldson, C duP., Snedeker, R. S. and Sullivan, R. D., “Calculation of Aircraft Wake Velocity Profiles and
Comparison with Experimental Measurements,” AIAA Journal of Aircraft, Vol. 11, No. 9, 1974, pp. 547-555.
16. Durston, D.A., S.M. Walker, D.M. Driver, S.C. Smith, and Ö. Sava . 2005. Wake-vortex alleviation flowfield studies.
Journal of Aircraft 42:894-907.
17. Fabre, D., Jacquin, L. and Loof. A., “Optimal perturbations in a four-vortex aircraft wake in counterrotating
configuration. Journal of Fluid Mechanics, 2002, 451:319-328.
18. Fine, N.E. and Kring, D.C., “Opto-Acoustic Tracking of Aircraft Wake Vortices,” AIA A Paper 2005-2965, 11th
AIAA/CEAS Aeroacoustics Conference, 26th AIAA Aeroacoustics Conference, May 23-25, 2005, Monterey, CA.
19. Frech, M. and Holzäpfel, F., “Skill of an Aircraft Wake-Vortex Model Using Weather Prediction and Observation,”
AIAA Journal of Aircraft, Vol. 45, No. 2, March–April 2008, pp. 461-470.
20. Greenblatt, D., “Managing Flap Vortices via Separation Control,” AIAA Journal, Vol. 44, No. 11, 2006, pp. 2755-
2764.
21. Greenblatt, D., “Management of Vortices Tailing Flapped Wings via Separation Control,” AIA A Paper 2005-0061,
43rd AIAA Aerospace Sciences Meeting and Exhibit, Reno, Jan. 2005.
22. Greenblatt, D., Melton, L., Yao, C., Harris, J., “Control of a Wing Tip Vortex” AIAA Paper 2005-4851, 23rd AIAA
Applied Aerodynamics Conference, Westin Harbour Castle, Toronto, Ontario, 6-9 June 2005.
23. Hansen, H., Application of Mini-Trailing-Edge Devices in the AWIATOR Project, Airbus Deutschland EGAG,
Bremen, 2003. (also see www.awiator.net, accessed 13. August 2007.)
24. Haverkamp, S., Neuwerth, G. Jacob, D., “Active and passive vortex wake mitigation using control surfaces,”
Aerospace Science and Technology, Volume 9, Issue 1, January 2005, Pages 5-18.
25. Kingsley-Jones, M., “Boeing 747-8 vs A380: A titanic tussle,” FlightInterational.com, 14 February 2006.
26. Li, Y., Wang, J., and Zhang, P., Influences of Mounting Angles and Locations on the Effects of Gurney Flaps, Journal
of Aircraft, Vol. 40, No. 3, 2003, pp. 494-498.
27. Matalanis, C.G., Eaton, J.E., Wake Vortex Control Using Static Segmented Gurney Flaps, AIAA Journal, Vol. 45, No.
2, 2007a, pp. 321-328.
28. Matalanis, C.G., Eaton, J.E., Wake Vortex Alleviation Using Rapidly Actuated Segmented Gurney Flaps, AIA A
Journal, Vol. 45, No. 8, 2007b.
29. Meyer, R. et. al., Drag Reduction on Gurney Flaps by Three-Dimensional Modifications, Journal of Aircraft, Vol. 43,
No. 1, 2006, pp. 132-140.
30. Michel, U. and P. Böhning, “Investigation of Aircraft Wake Vortices with Phase Microphone Arrays,” AIA A Paper
2002-2501, 2002.
31. Nield, B. N., “An overview of the Boeing 777 high lift aerodynamic design,” Aeronautical Journal,” Nov. 1995. pp.
361-371.
32. Nikolic, V.R., Effect of Full-Span Gurney Flap Height on Wing Wake Vortex Alleviation, Journal of Aircraft, Vol. 43,
No. 5, 2006, pp. 1555-1558.
33. Ortega, J. M., Bristol R. L. and Savas, Ö., “Experimental Study of the Instability of Unequal-Strength Counter-Rotating
Vortex Pairs” J. Fluid Mech., Vol. 474, 2003, pp. 35-84.
34. Pradeep, D.S., and F. Hussain. 2006. Transient growth of perturbations in a vortex column. Journal of Fluid Mechanics
550:251-288.
19
American Institute of Aeronautics and Astronautics4th Flow Control Conference, Seattle, Washington, June 23-26, 2008
35. Rennich, S. C. and Lele, S. K., “Method for Accelerating the Destruction of Aircraft Wake Vortices,” AIAA Journal of
Aircraft, Vol. 36, No. 2, 1999, pp. 398-404.
36. Rossow, V. J. “Theoretical Study of Lift-Generated Vortex Wakes Designed to Avoid Rollup,” AIAA Journal, Vol. 13,
No. 4, 1975, pp. 476-484.
37. Rossow V. J. “Lift-Generated Vortex Wakes of Subsonic Transport Aircraft,” Progress in Aerospace Sciences, Volume
35, Issue 6, 1999, pp. 507-660.
38. Sava , Ö. 2005. Experimental investigations on wake vortices and their alleviation. Comptes Rendus Physique, Vol. 6,
pp. 415-429.
39. Schmitt, N. P., Rehm, W., Pistner, T., Zeller, P., Diehl, H. and Navé, P., “The AWIATOR airborne LIDAR turbulence
sensor,” Aerospace Science and Technology, Vol. 11, 2007, pp. 546–552.
40. Spalart, P. R., “Airplane Trailing Vortices,” Annual Review of Fluid Mechanics, Vol. 30, 1998, pp. 107-138.
41. Vey, S., Greenblatt, D. Paschereit, C.O. and Meyer, R., “Flap Vortex Management by Active Gurney Flaps,” AIAA
Paper 2008-286, 46th AIAA Aerospace Sciences Meeting and Exhibit, 7-10 January 2008, Reno NV.
42. Williamson, C. H. K, Leweke, T. and Miller, G. D., “Fundamental instabilities in spatially-developing wing wakes and
temporally-developing vortex pairs”, Proceedings of FEDSM ’98, 1998 ASME Fluids Engineering Division Summer
Meeting, June 21-25, 1998, Washington DC.
20
American Institute of Aeronautics and AstronauticsYou can also read