Reciprocal space slicing - publish.UP
←
→
Page content transcription
If your browser does not render page correctly, please read the page content below
Mathematisch-Naturwissenschaftliche Fakultät

S. P. Zeuschner | M. Mattern | J.-E. Pudell | A. von Reppert | M. Rössle |
W. Leitenberger | J. Schwarzkopf | J. E. Boschker | M. Herzog | M. Bargheer

Reciprocal space slicing
A time-efficient approach to femtosecond x-ray diffraction

Suggested citation referring to the original publication:
Structural Dynamics 8 (2021) Art. 014302
DOI https://doi.org/10.1063/4.0000040
ISSN 2329-7778

Postprint archived at the Institutional Repository of the Potsdam University in:
Postprints der Universität Potsdam : Mathematisch-Naturwissenschaftliche Reihe 1137
ISSN: 1866-8372
https://nbn-resolving.org/urn:nbn:de:kobv:517-opus4-499761
DOI: https://doi.org/10.25932/publishup-49976
Structural Dynamics                                                                                  ARTICLE            scitation.org/journal/sdy

    Reciprocal space slicing: A time-efficient approach
    to femtosecond x-ray diffraction
    Cite as: Struct. Dyn. 8, 014302 (2021); doi: 10.1063/4.0000040
    Submitted: 25 September 2020 . Accepted: 21 December 2020 .
    Published Online: 21 January 2021

    S. P. Zeuschner,1,2,a)    M. Mattern,1 J.-E. Pudell,1,2                A. von Reppert,1        € ssle,2 W. Leitenberger,1
                                                                                               M. Ro
                    3
    J. Schwarzkopf,        J. E. Boschker,3    M. Herzog,1                  and M. Bargheer 1,2,a)

    AFFILIATIONS
    1
                  € r Physik und Astronomie, Universita
        Institut fu                                    € t Potsdam, 14476 Potsdam, Germany
    2
         Helmholtz-Zentrum Berlin fu  € r Materialien und Energie GmbH, Wilhelm-Conrad-Ro  € ntgen Campus, BESSY II, 12489 Berlin, Germany
    3
                          € r Kristallzu
        Leibniz-Institut fu            € chtung, 12489 Berlin, Germany

    a)
         Authors to whom correspondence should be addressed: szeuschn@uni-potsdam.de and bargheer@uni-potsdam.de

    ABSTRACT
    An experimental technique that allows faster assessment of out-of-plane strain dynamics of thin film heterostructures via x-ray diffraction is
    presented. In contrast to conventional high-speed reciprocal space-mapping setups, our approach reduces the measurement time drastically
    due to a fixed measurement geometry with a position-sensitive detector. This means that neither the incident (x) nor the exit (2h) diffraction
    angle is scanned during the strain assessment via x-ray diffraction. Shifts of diffraction peaks on the fixed x-ray area detector originate from
    an out-of-plane strain within the sample. Quantitative strain assessment requires the determination of a factor relating the observed shift to
    the change in the reciprocal lattice vector. The factor depends only on the widths of the peak along certain directions in reciprocal space, the
    diffraction angle of the studied reflection, and the resolution of the instrumental setup. We provide a full theoretical explanation and exem-
    plify the concept with picosecond strain dynamics of a thin layer of NbO2.
    C 2021 Author(s). All article content, except where otherwise noted, is licensed under a Creative Commons Attribution (CC BY) license (http://
    V
    creativecommons.org/licenses/by/4.0/). https://doi.org/10.1063/4.0000040

    I. INTRODUCTION                                                                       With the introduction of position-sensitive detectors, i.e., pixel-
          Modern crystallography and strain assessment at the nanoscale             area or pixel-line detectors, it became possible to measure the dif-
    cannot be imagined without x-ray diffraction. This nondestructive and           fracted intensity on a linear subset of the reciprocal space simulta-
    widely available tool to determine interatomic distances in crystalline         neously.12–14 Consequently, the time for full reciprocal space mapping
    specimen has been proven to be particularly useful in the ultrafast             decreased drastically, e.g., for time-resolved strain assessment. A detec-
    dynamics of condensed matter.1–4 Technological progress relies on the           tion scheme with a fixed detector has been used in the context of high
    development of novel and faster procedures to transfer energy between           repetition rate UXRD experiments at synchrotrons.15
    subsystems and a decreasing size of the devices. This implies the                     In this paper, we discuss an experimental method to determine
    importance of quantifying strain in nanoscale specimens of technolog-           the strain perpendicular to the surface of nanoscale heterostruc-
    ically relevant materials on the picosecond timescale.5–10                      tures, which reduces the acquisition time even more. The data
          Ultrafast x-ray diffraction (UXRD) setups are sensitive to changes        acquisition routine, which we call reciprocal space slicing (RSS),
    in the diffraction pattern, which map out the reciprocal space (RS) of          constantly monitors just a subset of the reciprocal space of a speci-
    the specimen in which lattice dynamics have been triggered.11 To                men with an area detector and a fixed diffraction geometry (see
    access details of the crystalline order in the reciprocal space, all the dif-   Sec. II). We analyze theoretically that reciprocal space slicing is
    fracted intensity needs to be spatially quantified as a function of the          sufficient to monitor strain dynamics perpendicular to the surface
    angular relation between the incoming x-ray beam, the sample, and               of most thin, layered specimen without scanning the diffraction
    the detector.11,12 Scanning both angles of a point detector and the sam-        angles. This applies for diffraction setups with monochromatic
    ple takes a large amount of time, especially if multiple reciprocal space       and parallel or convergent x-rays (see Sec. III A or Sec. IV A,
    maps (RSMs) need to be recorded for time-resolved measurements.                 respectively).

Struct. Dyn. 8, 014302 (2021); doi: 10.1063/4.0000040                                                                                                8, 014302-1
C Author(s) 2021
V
Structural Dynamics ARTICLE scitation.org/journal/sdy
We test our theory experimentally at the KMC-3 XPP Beamline the specimen.11 As we use the same sample throughout this paper, RS
at the BESSY II synchrotron of the HZB16,17 for parallel x-rays in is the same and is modeled as follows.
Sec. III B. For a convergent x-ray beam, reciprocal space slicing is vali- For thin films, the reciprocal space RSð~
QÞ in the vicinity of ~
G can
dated experimentally at the femtosecond x-ray diffraction setup with a be approximated by a Gaussian function. In this paper, we visualize
laser-based plasma x-ray source (PXS)18,19 (see Sec. IV B). With both the 3D reciprocal space by a 2D projection onto the qx =qz -plane since
setups, we demonstrate the slicing by examination of a sample we only discriminate between the in- and out-of-plane directions.
fabricated by pulsed laser deposition a thin layer of NbO2 on top of a Here, qz is aligned perpendicular and qx parallel to the sample surface
TiO2 substrate.20 NbO2 exhibits an insulator-metal phase transition, and diffraction plane. Thus, we model RSð~ QÞ of a thin layer, by a 2D-
accompanied by a transition in the crystalline ordering at 1070 K.21 Gaussian function,
This renders NbO2 and its alloys a promising material class for electri- !
cal switching and even memory applications at high temperatures.22–24 ðqx gx Þ2 ðqz gz Dqz Þ2
RSðqx ; qz Þ ¼ ARS exp ; (2)
Future ultrafast strain assessment during the phase transition using 2r2x 2r2z
UXRD may reveal novel insight into the transition and promote appli-
cation development in electronics, complementing all-optical stud- where rx and rz are the widths along qx and qz, which are inversely
ies.25 For this publication, however, the NbO2 sample was mainly proportional to the in-plane and out-of-plane coherence lengths,
respectively. The amplitude ARS is proportional to the structure factor,
selected because of its particular shape in reciprocal space, displaying a
and gx and gz are the components of ~ G, which has an absolute value
high-contrast twofold nature of the Bragg reflections, due to a particu-
that is inversely proportional to the lattice spacing in real space. In our
lar domain structure resulting in a large discrepancy of the structural,
case, gx is close to 0, as we analyze lattice planes parallel to the sample
in-plane coherence length. This sample is, thus, ideal to demonstrate
surface. The shift of ~ G resulting from out-of-plane strain is given by
the advantages and limitations of reciprocal space slicing for narrow
Dqz . A contour line of this particular intensity in the qx =qz -plane is an
and broad Bragg reflections in a single measurement.
ellipse, in which both semi-axis lengths correspond to the widths rx
and rz. In Figs. 1(a) and 1(b), Iðqx ; qz Þ is visualized for opposing
II. RECIPROCAL SPACE SLICING rx =rz ratios by ellipses to provide an intuitive geometric approach.
In a symmetric diffraction geometry, with the center of the posi-
Generally, the measured intensity in reciprocal space (Ið~
QÞ) is a
tion sensitive detector set to twice the Bragg angle of the probed mate-
convolution of the reciprocal space (RS) of the specimen and the
rial (2hB ), the detector intersects the corresponding reciprocal lattice
instrument’s resolution area (RA),11
point ~G, which is positioned at ~ G¼~ Q :¼ ~k out ~
k in in the reciprocal
Ið~
QÞ ¼ ðRS RAÞð~
QÞ: (1) space map (RSM).11,19 This means that the area detector slices the
intensity distribution in reciprocal space (RS) in the center (Fig. 1), as
The shape of the resolution area is determined by the energy distribu- the pixels record a large 2h range of the diffracted signal.
tion and the trajectories of the x-ray photons used for diffraction. In Strain of the specimen perpendicular to the surface results in a
reciprocal space, this translates into the length and directions of the change in the qz-component of ~ G. Conventionally, this is detected by
incident x-ray wave vectors ~ k in . Since RA is different for the two pre- comparing an RSM of the strained sample with an RSM of a reference
sented experimental setups in this paper, we evaluate the role of RA in state. In this process, the RSMs are assembled by the reciprocal space
Secs. III A and IV A. But the shape of the reciprocal space is deter- slices recorded at different combinations of the diffraction angle x and
mined by the coherence length of the scattering periodic structure of the 2h range of the detector area.11 Here, x is the angle between ~ k in
FIG. 1. Schematic sketch of a symmetric diffraction geometry set to the Bragg angle hB for different shaped intensity distributions surrounding ~ Q ¼~ G. qx is aligned along the
sample surface. The red dashed and solid ellipses represent contour lines of the intensity distribution Iðqx ; qz Þ surrounding ~G before and after the shift along qz, respectively.
The dotted blue line represents the Ewald sphere on which the detector is positioned. We approximate the arc by a straight line, indicated by the dashed blue line, labeled
PSD. (a) I is elongated along qz, which results in a small visible D2h on the detector. (b) I is elongated along qx, which leads to Dqz;D Dqz . (c) 2Dqz;D Dqz , for reflections
with high crystalline quality at the PXS setup (see Sec. IV).
Struct. Dyn. 8, 014302 (2021); doi: 10.1063/4.0000040 8, 014302-2
C Author(s) 2021
VStructural Dynamics ARTICLE scitation.org/journal/sdy
and the lattice planes of the corresponding ~ G, which are chosen to be ID ðqz Þ :¼ Iððqz gz Þ tan ðhB Þ; qz Þ
parallel to the sample surface in this paper. 2h denotes the angle !
tan ðhB Þ2 ðqz gz Þ2 ðqz gz Dqz Þ2
enclosed by ~ k in and ~
k out . ¼ ARS exp
In contrast to full reciprocal space mapping, the diffraction 2r2x 2r2z
!
geometry is fixed during reciprocal space slicing, which means, in par-
! ðqz gz Dqz;D Þ2
ticular, that x and 2h are set and fixed to hB and 2hB . This decreases ¼ AD exp ; (5)
2r2D
the measurement time significantly, because no angular scans are
required. The resulting Dqz of a strained material manifests itself in a where AD is a scaled amplitude, rD is the width, and Dqz;D is the shift
shift of the diffracted intensity distribution on the position sensitive of the intensity distribution on the detector line projected onto the qz
detector (D2h) (see Fig. 1). The projection of D2h onto the qz axis axis. The relation between the strain-induced change of ~ G (Dqz ) and
Dqz;D is proportional to Dqz , and the proportionality factor S depends the shift that is measured (Dqz;D ) is, therefore, given by
on the diffraction geometry, the resolution area of the experimental !
setup (RA), and the reciprocal space of the specimen (RS) in proximity r2
to ~
G. Consequently, we are able to determine the strain g by just scal- Dqz ¼ Dqz;D 1 þ z2 tan ðhB Þ2 : (6)
rx
ing the shift of the 1D intensity distribution on the detector with the |fflfflfflfflfflfflfflfflfflfflfflfflfflfflffl{zfflfflfflfflfflfflfflfflfflfflfflfflfflfflffl}
factor S. Since the detector area is tangent to the 2h-circle, the strain g ¼:S
is proportional to the change in the diffraction angle D2h on the detec- In the experiments with a fixed diffraction geometry and a
tor and S, d-shaped instrument function, it is thus possible to derive the
Dqz Dqz;D D2h change in ~ G and hence, the strain by just scaling the shift of the 1D
g¼ ¼ S ¼ S cotðh0B Þ; (3) intensity distribution on the detector with the factor S. However,
~
jGj þ Dqz ~
jGj þ Dqz 2
this is only applicable for broad intensity distributions in recipro-
where h0B is the Bragg angle after the shift occurred. For small strains cal space. For very narrow Bragg reflections, e.g., as typical of sub-
below a few %, we can approximate h0B hB and j~ Gj þ Dqz j~ Gj. strates, even small shifts along qz lead to a massive intensity loss on
In Secs. III–IV, we will give a quantitative evaluation of the func- the fixed detector so that the diffracted intensity quickly becomes
tional dependence of the desired observable Dqz on the shift observed impossible to detect.
on the detector D2h. For this, we put in different RAs for the two dif- In Figs. 1(a) and 1(b), we display the two limits of this result with
ferent experimental setups and model the intensity distribution on the which we illustrate several important implications. In (a), rx < rz ,
detector as a function of the shift Dqz . which is the case for a single-crystalline thin film, results in a rather
large intensity loss but only a small shift of the intensity distribution
on the detector Dqz;D compared to the real shift of the intensity maxi-
III. RECIPROCAL SPACE SLICING AT SYNCHROTRONS
mum Dqz . In (b), on the other hand, where rx > rz , which is the case
A. The role of position sensitive detectors in RSS for columnar growing films, the observed shift on the detector Dqz;D is
First, we assume a resolution area, which corresponds to a mono- basically equal to Dqz and the amplitude does not change significantly
chromatic and parallel x-ray beam, which means that the resolution either. Figure 1 also illustrates that the discrepancies between Dqz;D
area can be approximated by a d-function in the wave vector and and Dqz become more pronounced with increasing diffraction angles,
energy space. Thus, the RSM is equal to the reciprocal space of the e.g., at higher diffraction orders.
specimen: Ið~ QÞ ¼ RSð~ QÞ, according to Eq. (2).
The intensity distribution measured by a detector line (ID ) is a B. Thermally induced strain measured with RSS
one-dimensional subset of the intensity distribution Iðqx ; qz Þ, namely,
In this section, we evaluate the negative thermal expansion of the
an arc with the radius kin , i.e., a fraction of the Ewald sphere for sym-
75 nm thin NbO2 layer on top of a TiO2 substrate at the KMC-3 XPP
metric diffraction.11,19 We approximate this arc as a line, as the size of beamline at the BESSY II synchrotron of the HZB,16,17 using the recip-
the intensity distribution around ~ G is typically comparably small with rocal space slicing theory described in Sec. II.
respect to the wave vector. Even for a minimal coherence length of The thin layer of NbO2 exhibits a tetragonal crystal structure
pffiffiffiffiffiffiffiffiffiffi
Lc ¼ p=ð 2 ln 2rq Þ ¼ 1 nm, the width rq 0:3 Å–1 of the distribu- where the (100) direction, which coincides with the (110) direction of
tion RSð~ QÞ in the corresponding direction is an order of magnitude the rutile ordered TiO2, is aligned out-of-plane, i.e., parallel to qz. We
smaller than usual hard x-ray wave vectors that are on the order of scanned the full reciprocal space in proximity to the (200) and (220)
j~
k in j 4 Å–1 (8 keV). With this, the detector can be described by a lin- Bragg reflections of NbO2 and TiO2, respectively, with 8 keV parallel
ear parametric function, which defines a subset of the reciprocal space x-rays and an area detector (Pilatus 100 K from DECTRIS). A projection
onto the qx =qz -plane at a sample temperature of 100 K is displayed in
via Eq. (4), which is indicated by a dashed blue line in Fig. 1,
Fig. 2(a). A projection of the intensity of both reflections onto the
qx
qz ¼ þ gz : (4) qz-axis is displayed in (b), and the projection of the NbO2 reflection
tan ðhB Þ onto the qx-axis is displayed in (c). The black contour lines and graphs
Since this defines all pairs (qx, qz) at which the detector measures the correspond to the RSM recorded at 100 K and the red lines to the
intensity, we substitute qx in Eq. (2) with Eq. (4) to get the measured RSM recorded at 300 K.
intensity on the detector line ID as a function of qz only, which is again The Bragg reflections yield the following information about the
a 1D Gaussian function, crystalline structure of the sample. The reflection of the TiO2 substrate
Struct. Dyn. 8, 014302 (2021); doi: 10.1063/4.0000040 8, 014302-3
C Author(s) 2021
VStructural Dynamics ARTICLE scitation.org/journal/sdy
is considerably larger with over 5%. This leads to strong distortions in
NbO2 and a small coherence length. AFM measurements of the sur-
face support this interpretation by revealing domains at the nanometer
length scale.20 Since the x-ray probe spot on the specimen measures
tens to hundreds of micrometers in both directions, the signal of the
diffracted intensity is a lateral average of the domains and thus, con-
tains both contributions.
The change of the contour lines and graphs from black to red in
Fig. 2 exemplify the lattice response of the TiO2/NbO2 heterostructure
to static heating. A rise in temperature from 100 K to 300 K leads to
the expected thermal expansion of TiO2, which we measure directly by
the shift of the (220) reflection of TiO2 to lower qz.26 Simultaneously,
both contributions of the NbO2 (200) reflection shift to larger qz with
increasing temperature, which corresponds to the reported negative
thermal expansion of NbO2 along the a-axis of the tetragonal unit cell
below room temperature.27 The qz shift due to the contraction can be
quantified by the comparison of two RSMs and the projection onto
the qz axis [see Fig. 2(b)].
We now discuss reciprocal space slicing as a faster alternative for
Dqz assessments, which uses just one detector image of the RSM scan
at 100 and 300 K. The two detector images for the two temperatures
are displayed in Fig. 3 after integration of the intensity on the detector
area perpendicular to the diffraction plane. The diffraction patterns on
the detector exhibit the two contributions of the NbO2 reflection, but
only the broad part reveals a visible shift along the diffraction angle 2h
with increasing temperature. This finding agrees with the modeling in
Sec. III A since the visible shift of the diffraction pattern on the detec-
FIG. 2. (a) RSM of the sample recorded at 100 K at the KMC-3 XPP beamline in tor line D2h is proportional to the strain, but the proportionality factor
the vicinity of the (200) NbO2-layer and (220) TiO2-substrate Bragg reflections. The S depends on the shape of the intensity distribution via Eq. (6). With
black and red lines are contour lines of the RSM at 100 K and at 300 K, respec-
the widths of the two contributions, we get Sb ¼ 1:01 for the broad
tively. (b) and (c) Projections of the RSM onto the qz- and qx-axis, respectively. The
qx-projection contains only the RSM in close proximity to the NbO2 reflection and Sn ¼ 11 for the narrow component. Since the real thermally
1
(1.78 Å < qz < 1.83 Å1). The white line indicates the linear subset of the recip- induced strain is expected to be identical for both contributions, D2h
rocal space, which is measured simultaneously by the detector (PSD) and defined must be more than ten times smaller for the narrow component of the
by Eq. (4). The intensity distribution on the detector is shown in Fig. 3.
is narrow in reciprocal space, only deformed and broadened by the
crystal truncation rod, analyzer and monochromator streaks, and ther-
mal diffuse scattering.11 The NbO2 reflection, on the other hand,
reveals two contributions, indicated by the broad (b) horizontally elon-
gated and narrow (n) vertically aligned ellipsoidal contour lines for
two different intensities of the RSM, shown in Fig. 2(b). The projec-
tions onto the qx and qz axes allow the determination of the widths
along the two directions by Gaussian fits and, consequently, the quan-
tification of the coherence lengths parallel and perpendicular to the
surface. We find a single width of rz ¼ 0:004 Å–1 in the qz direction
and the widths of rx;b ¼ 0:009 Å–1 for the broad part and an upper
limit of rx;n ¼ 0:0003 Å–1 for the narrow portion along qx. This corre-
sponds to an out-of-plane coherence length of nz ¼ 66 nm, which is
close to the layer thickness of 75 nm. Parallel to the surface, the
widths correspond to coherence lengths of nb ¼ 30 nm and at least
nn ¼ 900 nm. The latter can be even larger, but we are limited by the
scanning resolution. The occurrence of two coherence lengths parallel
to the surface is associated with lattice mismatches of TiO2 and NbO2. FIG. 3. Relative intensity distribution on the area detector after integration perpen-
dicular to the diffraction plane for 100 and 300 K. The position of the detector pixels
The c-axes of both tetragonal materials are aligned with a small lattice
is transformed to 2h, according to the diffraction geometry. The data are fitted by a
mismatch of just 1%. This leads to a well-ordered crystalline structure broad Gaussian function to indicate the larger shift of the broad component of the
of NbO2 and a large coherence length parallel to this direction. Along NbO2 (200) reflection in comparison to the narrow contribution that remains almost
the in-plane direction perpendicular to the c-axis, the lattice mismatch unchanged.
Struct. Dyn. 8, 014302 (2021); doi: 10.1063/4.0000040 8, 014302-4
C Author(s) 2021
VStructural Dynamics ARTICLE scitation.org/journal/sdy
NbO2 reflection than for the broad component [see Eq. (3)]. This is geometries with x ¼ hB , S is given by Eq. (8) that contains two simple
consistent with the data in Fig. 3. Additionally, we crosschecked the implications if we evaluate two opposite limiting cases.
quantitative agreement of the strain determined by conventional full On the one hand, we can assume very broad intensity distribu-
reciprocal space mapping and slicing. Dqz , determined with RSM data tions in the reciprocal space of the specimen in proximity to ~ G, i.e.,
in Fig. 2, is, in fact, equal to Sb Dqz;D . rx ; rz rRA;x ; rRA;z . This is the case for samples that exhibit small
This exemplifies that reciprocal space slicing can be a very effec- coherence lengths in- and out-of-plane, in particular, thin films with
tive way to determine out-of-plane strain if the intensity distribution noticeable mosaicity. Then, Eq. (8) reduces to the definition of S in Eq.
in the vicinity of ~ G is comparably broad along qx compared to qz, (6), which is expected, as the previously assumed d-like resolution area
which is the limiting case depicted in Fig. 1(b). It also illustrates that is always narrower than any other feature in the reciprocal space of the
shifts of ~G with a surrounding intensity distribution, which are very specimen.
narrow along qx compared to qz, can be much better quantified with
full reciprocal space mapping. Thus, slicing with highly parallel beams r2z r2RA;x
r2RA;x r2z þ 2þ 4 sin ðhB Þðr2RA;x r2RA;z Þ
at synchrotrons is only effective for thin layers with in-plane coherence cos ðhB Þ cos ðhB Þ2
S :¼ :
lengths comparable to the layer thickness, i.e., specimen with notice- r2x þ r2x 2 sin ðhB Þðr2RA;x r2RA;z Þ
able mosaicity or a domain structure.
(8)
IV. RECIPROCAL SPACE SLICING WITH A COMPLEX
On the other hand, we can assume a reciprocal space, which
RESOLUTION AREA
exhibits intensity distributions surrounding ~ G that are far narrower
A. The role of convergent and polychromatic x-rays than the resolution area of the PXS setup. This is the case for samples
in RSS with large coherence lengths, i.e., substrates or films with high-quality
The resolution area can have a rather complex shape in many crystallinity. In that case, the expression in Eq. (8) becomes
experimental setups. In this section, we illustrate the application of
1
reciprocal space slicing for the plasma x-ray source (PXS) at the 2 sin ðhB Þ2 ðr2RA;x r2RA;z Þ r2RA;x = cos ðhB Þ2
University of Potsdam, which is optimized for ultrafast x-ray diffrac- S¼ 2 ; (9)
tion (UXRD) with a pulse length on the order of 200 fs.18 The probing sin ðhB Þ2 ðr2RA;x r2RA;z Þ r2RA;x =2
x-ray pulses are composed of the Ka1 and Ka2 lines of copper and are which converges to two for rRA;z rRA;x , as it is the case for the PXS
focused onto the specimen by a Montel optic (INCOATEC ELM45).28 setup that has rRA;z 20 rRA;x .19 This limit of a factor of 2 can also
The diffracted signal is detected by an area detector (Pilatus 100 K be motivated via a geometrical reasoning shown in Fig. 1(c). A contour
from DECTRIS).19 For static measurements, the PXS can be replaced by line of the measured intensity distribution from a substrate is sketched
a microfocus x-ray tube (UltraBright 96000 from OXFORD INSTRUMENTS) in red, neglecting the twofold nature of the resolution area at the PXS.
with the focus positioned where the femtosecond x-rays emerge. The semi-major axis of this ellipse is related to rRA;z and the semi-
In both cases, the resolution area of this setup is described by the minor axis to rRA;x . The ellipse is tilted clockwise by the angle hB with
sum of two 2D Gaussian functions.19 The Gaussian doublet is sepa- respect to the qz axis, whereas the detector line is inclined by the same
rated by 0.25% of the chosen scattering vector ~ Q with respect to the qz angle, but counterclockwise. In this symmetric diffraction geometry,
axis due to the energy difference of the Ka1 and Ka2 lines and is the semi-major axis of the ellipse, the detector line, and the qz axis con-
broadened along qz by the natural linewidth of these characteristic stitute an isosceles triangle (green). Therefore, the qz projection of the
lines. The major axis of the Gaussian doublet is determined by the intersection point F of the semi-major axis and the detector line always
convergence of 0:3 from the x-ray optic. The pixel size of the is exactly half of the true shift of ~
G.
detector limits the resolution of the detected x-rays along the
minor axis of the Gaussian doublet. This is associated with an
B. Picosecond strain dynamics with RSS
uncertainty of the diffraction angle, which can reach from 0:1 to
0:005 , depending on the sample-detector distance of 0.1 to 2 m. In this section, we present a complete evaluation of picosecond
In reciprocal space, the doublet is rotated by the diffraction angle strain dynamics of the sample in the context of reciprocal space slicing.
of the incident x-rays x [see Fig. 1(c)].19 To employ the slicing technique, we first record a full reciprocal space
As is shown in the Appendix, the intensity distribution ID of an map (RSM) of the specimen without optical excitation to determine
elongated ~ G measured along the slice of the detector is again a the shape of the resolution area and the reciprocal space in proximity
Gaussian function and can be written as to ~
G of the thin NbO2 layer. Ideally, the latter is determined at a
0 2 1 synchrotron-based diffraction setup with very high angular resolution
Dqz (see Fig. 2 for the RSM with a very small resolution area). Clearly, the
B qz C TiO2 substrate reflection is much sharper than the thin layer NbO2
@ S A
ID ¼ AID exp ; (7) reflection, which is composed of two contributions with very different
2r2ID
widths along qx. Ultrafast diffraction experiments combining a time
where AID is the amplitude and rID is the width of the intensity distri- resolution of 100 fs with such a small resolution area can only be
bution of the detector projected onto the qz axis. The scaling factor S recorded at free-electron lasers or femto-slicing beamlines. At
connects the measured qz shift on the detector (Dqz;D ) with the real synchrotrons, the time resolution is typically limited to 100 ps. Here,
shift Dqz of ~
G, similar to Eq. (6). In this case, S depends on the param- we discuss a table top femtosecond x-ray diffraction setup driven by a
eters of the resolution area as well. For symmetric diffraction PXS.
Struct. Dyn. 8, 014302 (2021); doi: 10.1063/4.0000040 8, 014302-5
C Author(s) 2021
VStructural Dynamics ARTICLE scitation.org/journal/sdy
The transient response of the sample is probed with a 200 fs lines corresponding to different intensities in Fig. 4(a). The two com-
x-ray pulse composed of the Cu Ka doublet in the convergent beam ponents have been discussed in detail in Sec. III B, and here we see the
geometry described in Sec. IV A. For ultrafast x-ray diffraction experi- instrumental broadening compared to synchrotron setups. Clearly, the
ments, we excite the sample with 100 fs pulses centered around narrow component is rotated, compared to the measurement at the
800 nm, at an incident pump-energy density of 10 mJ/cm2. The time synchrotron, see Fig. 2, exhibiting a similar shape as the substrate
resolution of this setup approaches the state-of-the-art at free electron reflection, i.e., it is also limited by the resolution area of the setup.
lasers, however, with many orders of magnitude less brilliance and Upon femtosecond laser excitation, the measured RSM changes,
with a much larger resolution area. We shall see in the following that as phonons are coherently and incoherently excited, triggering a long-
the broad resolution area may be advantageous for the presented lasting thermal expansion and picosecond strain pulses.29 Since the
technique. thermal expansion coefficient of NbO2 perpendicular to the surface is
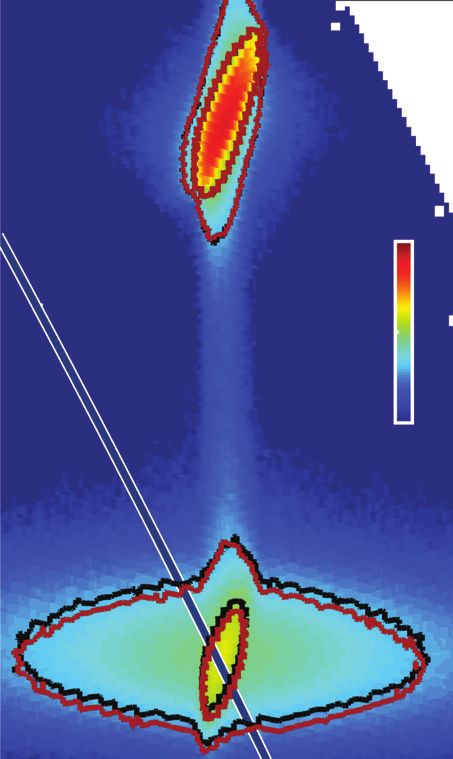
In Fig. 4(a), we display an RSM recorded at the PXS in proximity positive above 300 K, the generated strain is positive, which leads to a
to the NbO2 (200) and TiO2 (220) Bragg reflections. The intensity dis- G to smaller qz.27 The red contour lines in Fig. 4 indicate the
shift of ~
tribution at ~G of the substrate TiO2 illustrates the shape of the PXS’s shift Dqz after a pump–probe delay of 7 ps compared to the RSM
resolution area due to the high crystalline quality of the substrate. In before excitation (black contour lines). The projections onto the qx
principle, it can be approximated by two 2D-Gaussian functions that and qz axes confirm a shift exclusively along qz. Also, the contour lines
are elongated along qz and rotated by the diffraction angle hB .19 The of the substrate reflection do not change since 7 ps is not enough
scanning resolution of the RSM and the small diffraction angle, how- time to transfer significant amounts of energy into the substrate by
ever, limit the clear separation of the Ka doublet. We fit the resolution heat diffusion. Energy deposition inside the substrate by the initial
area with a single 1D Gaussian function with rRA;x ¼ 6 104 Å–1 excitation pulse is extremely unlikely as the bandgap of TiO2 with over
and rRA;z ¼ 6 103 Å–1, which is rotated by hB 3 to account for 3 eV exceeds the used pump photon energy of 1.55 eV.30 The dynam-
splitting. ics of both components from the twofold reflection of NbO2 are the
The intensity distribution in proximity to the NbO2 reflection same since the pump and probe spots of the UXRD measurement
consists of two components that are indicated by the black contour with diameters of 1 and 0.3 mm, respectively, average over many of
the small, equally strained domains with large and small coherence
lengths, as described in the case of static heating.
To quantitatively determine the strain response of the thin NbO2
layer after femtosecond laser excitation, we first recorded full recipro-
cal space maps and later slices of the reciprocal space as a function of
the pump–probe delay under identical measurement conditions. The
intensity distributions of the reciprocal space maps were projected
onto the qz axis, as shown in Fig. 4(b) to extract the shift Dqz for each
delay of pump and probe pulses. This is done with a single Gaussian
fit since the twofold nature of the NbO2 reflection manifests itself only
in the qx direction, not in qz (see Fig. 4). Via the scaled derivative of
Bragg’s law, i.e., the right half of Eq. (3), the strain was calculated and
is plotted in Fig. 5(b) as green circles (gRSM). The error bars indicate
the uncertainty of the strain assessment given by the standard devia-
tion of the strain for negative delays.
In contrast to the full reciprocal space mapping approach, the dif-
fraction geometry is not changed during the reciprocal space slicing.
The detector measures the intensity of the reciprocal space slice along
the 2h-axis indicated by the white line in Fig. 4(a). The intensity distri-
bution before excitation is displayed in Fig. 5(a). The sum of two
Gaussian functions (black) fits the data.
According to Eq. (3), we calculate the strain gðtÞ from the shifts
of the two contributions to the intensity distribution on the detector
D2hðtÞ separately, where S is set to Sn ¼ 2:2 and Sb ¼ 1:1. The result-
ing strain transients gnG and gbG are displayed in Fig. 5(b) as magenta
and blue lines, respectively. The scaling factors are calculated with
Eq. (8) using the widths in the reciprocal space measured at the
synchrotron and the widths of the resolution area of the PXS setup. To
FIG. 4. RSM (a) of the sample with projections onto qz- (b) and qx-axes (c). The account for the Cu Ka doublet, we applied an angular offset of 3 to
TiO2 (110) substrate peak is visible at qz ¼ 1.91 Å–1 and the NbO2 (100) layer the diffraction angle. The transformation of the measured angles into
peak at qz ¼ 1.82 Å–1. The ellipses in (a) are contour lines of the RSM before
reciprocal space is sensitive to experimental parameters such as the
(black) and 7 ps after excitation (red). Accordingly, the projections onto the axes in
(b) and (c) are taken from the RSM before and after excitation. The white line indi- sample-detector distance, the relation between the 2h and pixel axis,
cates the linear subset of the reciprocal space, which is simultaneously measured and the alignment of the sample to the rotation center of the
by the area detector (PSD) and defined by Eq. (4). goniometer.
Struct. Dyn. 8, 014302 (2021); doi: 10.1063/4.0000040 8, 014302-6
C Author(s) 2021
VStructural Dynamics ARTICLE scitation.org/journal/sdy
wavepacket exits the layer toward the substrate, the strain level
decreases to 0.04%, which is 2/3 of the maximum strain as it is
expected for a perfectly impedance matched layer. In this case, we
observe an additional local maximum at 25 ps, which corresponds to
the expansive strain of the partly reflected strain wave from the layer
interface. The residual expansion beyond 35 ps originates solely from
thermal expansion and decays on a nanosecond timescale via heat dif-
fusion. The observed timings of the strain pulse in Fig. 5(b) are consis-
tent with the thickness and the longitudinal sound velocity of the
NbO2 layer.
The presented example demonstrates that reciprocal space slicing
yields the same quantitative and qualitative strain dynamics as conven-
tional reciprocal space mapping does. The full reciprocal space
mapping measurement took three times longer than the slicing while
having only half of the delay steps scanned. Thus, the reciprocal space
slicing can assess strain dynamics in thin films almost an order of
magnitude faster. The slicing approach readily shows that the strain
dynamics of both components of the (200) Bragg reflection in NbO2
have the same amplitude. In general, different samples may exhibit
nano-domains that exhibit disparate strain dynamics, and the slicing
technique would be able to measure this difference as long as the
dynamics are one-dimensional. This illustrates an advantage of the
slicing performed at the PXS compared to the synchrotron evaluation
presented in Sec. III. There, it is only practically possible to determine
the strain from the broad component of the Bragg reflection since the
resolution area was too small and not tilted in the reciprocal space.
Paradoxically, the instrumental broadening by a convergence and
energy spread is beneficial for the slicing scheme for samples of high
crystalline quality.
It may be important to reanalyze experimental work in the field
of ultrafast x-ray diffraction and strain assessment that uses some
FIG. 5. (a) Intensity distribution on the detector line before excitation (black) and form of reduced reciprocal space analysis.8–10,32–48 From the very early
after several ps delays (black to red). The data are fitted with the sum of two days of UXRD using plasma sources, the large convergence of the
Gaussian functions, a narrow Gaussian (nG, magenta) and a broad Gaussian (bG, x-rays was used to speed up the measurements by area detectors. The
blue). (b) Average strain inside the NbO2 layer upon femtosecond laser excitation.
The strain is determined with single Gaussian fits of the full reciprocal space map correct scaling was often considered unimportant, maybe because
projection onto the qz axis (green dots). A sum of two Gaussian functions is used experimental determination of the fluence introduces considerable
to fit the reciprocal space slicing data (black). The latter is the average of the uncertainties. In other cases, only scaled quantities were relevant. We
strain from the narrow Gaussian fit (magenta) and the broad Gaussian fit (blue), would like to note, however, that some publications in this context use
calculated via Eq. (3) with, respectively, different scaling factors Sn ¼ 2:2 and the phrase “rocking curve” for experimental conditions, where the
Sb ¼ 1:1.
sample is not “rocked,” but instead the convergence of the source and
the area detector are used to measure different angles simultaneously.
We now think that it would be good to point out the precise experi-
We observe that the broad Gaussian part (blue) shifts signifi- mental conditions in future publications. Several publications of our
cantly more on the detector after excitation than the narrow Gaussian group were based on UXRD measurements applying the reciprocal
part (magenta), i.e., ðD2hÞb > ðD2hÞn . Only the correct scaling of the space slicing approach.8–10,42–48 We reviewed all of them and found
shifts reveals a qualitative and quantitative agreement of the strain that the claims and findings are still correct. In most cases, this is
value deduced from the change in the diffraction pattern [thin blue because the scaling factor is negligible due to large mosaicities of thin
and magenta lines in Fig. 5(b)]. The strain dynamics observed using films and small diffraction angles. In some other cases, only the quali-
the reciprocal space slicing technique also agree with the strain deter- tative strain response is evaluated, rendering the scaling irrelevant.
mined via conventional full reciprocal space mapping.
The presented strain response in NbO2 upon femtosecond laser V. CONCLUSIONS
excitation corresponds well to the standard model of laser-excited thin Our analysis shows that the interpretation of ultrafast x-ray
film transducers probed by x-ray diffraction.31 A bipolar strain wave is diffraction experiments using RSS instead of full RSM requires quanti-
launched, which traverses and leaves the NbO2 thin film within the tative characterization of the natural Bragg peak widths in reciprocal
first 20 ps. The average layer strain rises while the layer is expanding, space around the investigated reciprocal lattice point. We provide
and the compressive leading half of the bipolar wave is ejected into the formulas to calculate the scaling factor S that is required to quantify
substrate. When the trailing expansive half of the coherent phonon the strain from the shift of a Bragg peak in a reciprocal space slice,
Struct. Dyn. 8, 014302 (2021); doi: 10.1063/4.0000040 8, 014302-7
C Author(s) 2021
VStructural Dynamics ARTICLE scitation.org/journal/sdy
which is recorded in experiments using position-sensitive detectors. RAðqx ; qz Þ ¼ RA1 ðqx ; qz Þ þ RA2 ðqx ; qz Þ
The scaling factor depends on the width of the measured intensity dis-
¼ ARA;1 exp aq2x 2bqx qz cq2z
tributions along qx and qz in reciprocal space. This is given by the
instrumental resolution area, the structural properties of the crystal Dk
þARA;2 exp aq2x 2bqx 1 þ qz
investigated, and the diffraction angle. Reciprocal space slicing is an kin
excellent method for speeding up time-resolved x-ray diffraction 2 !
Dk
experiments. c 1 þ q2z ; (A1)
kin
The formulas for the appropriate scaling factor indicate that the
slicing is generally ineffective, when S is very large, due to a small sig- where kin is the wave vector of Ka1 ; Dk accounts for the separation,
nal-to-noise ratio. This is the case for large diffraction angles or reflec- and ARA;1 and ARA;2 for the relative intensities of the Ka doublet. a,
tions, which are much broader along qz compared to qx because the b, and c are parameters of the ellipsoid and are defined by
measurable shift on the detector D2h then becomes very small. Our
examples show that a broad resolution area may be advantageous for cos ðxÞ2 sin ðxÞ2
a :¼ þ ;
rapid slicing of the reciprocal space. In a typical synchrotron experi- 2r2RA;x 2r2RA;z
ment with negligible instrumental broadening, reflections from crys-
sin ðxÞ sin ðxÞ
tals that have a much larger coherence length along qx than along qz b :¼ þ 2 ; (A2)
exhibit scaling factor S that can be larger than 10, so that shifts along 4r2RA;x 4rRA;z
qz yield only very small observable changes in a reciprocal space slicing sin ðxÞ2 cos ðxÞ2
experiment. For substrate-like reflections, which have large coherence c :¼ þ ;
2r2RA;x 2r2RA;z
lengths along both qx and qz, even tiny strains shift ~ G along qz such
that the detector only intersects the wings of the associated Bragg where rRA;x and rRA;x are the widths in qx and qz directions of the
reflection, with considerable intensity loss. Using a convergent x-ray 2D Gaussian function before rotating by the angle x.
beam with a consequently larger resolution area prevents this at the The convolution of this resolution area with the reciprocal
expense of angular resolution. space of the specimen around ~ G then equals the RSM measured at
We conclude that reciprocal space slicing is a useful tool for the PXS setup Iðqx ; qz Þ, as described by Eqs. (1) and (2) in Sec. II.
strain assessment, from the static heating to femtosecond laser excita- Since convolutions are linear operations of functions, it is suffi-
tion. It works particularly well for small scaling factors S, i.e., small dif- cient to evaluate the convolution integral of RS and the first
fraction angles and small coherence lengths in-plane, for example, thin addend RA1. The convolution of the second part of RA with RS is
metal films with large mosaicities. The average strain of thin layers is identical after a coordinate transformation to account for the
correctly assessed even for inhomogeneous strain patterns, although separation by Dk=kin . We find that the convolution I1 ðqx ; qz Þ
details of the strain distribution are better characterized by full recipro- :¼ ðRS RA1 Þðqx ; qz Þ is again a 2D Gaussian function. In order to
cal space mapping, especially in the context of phase transitions. Even derive the intensity distribution ID1 of a shifted ~G measured along
transient changes of the coherence lengths, due to strongly inhomoge- the slice of the detector, we again substitute qx in I1 ðqx ; qz Þ with its
neous strain patterns, and the resulting changes of the Bragg reflection equivalent expression given in Eq. (4). The function is also
widths can, in principle, be incorporated by a transient scaling factor Gaussian and can, therefore, be written as
and, thus, lead to a correct strain assessment. If strong structural
ID1 ¼ I1 ððqz qz;0 Þ tan ðhB Þ; qz Þ
changes in two or three dimensions, which change the coherence vol- 0 2 1
ume, are expected, full reciprocal space mapping is a better alternative. Dqz
We hope that our analysis will help in designing and interpreting B qz C
@ S A
future UXRD experiments. ¼ AID1 exp ; (A3)
2r2ID1
ACKNOWLEDGMENTS where AID1 is the amplitude and rID1 is the width of the intensity
distribution of the detector projected onto the qz axis. The scaling
We acknowledge the BMBF for the financial support via factor S connects the measured qz shift on the detector (Dqz;D ) with
05K16IPA. The synchrotron experiments were conducted at the the real shift Dqz of ~
G, similar to Eq. (6). In this case, S depends on
XPP-KMC3 beamline D13.2 at the BESSY II electron storage ring the parameters of the resolution area as well.
operated by the Helmholtz-Zentrum Berlin.
DATA AVAILABILITY REFERENCES
1
The data that support the findings of this study are available A. Rousse, C. Rischel, and J.-C. Gauthier, “Femtosecond x-ray crystallography,”
Rev. Mod. Phys. 73, 17–31 (2001).
from the corresponding authors upon reasonable request. 2
M. Bargheer, N. Zhavoronkov, M. Woerner, and T. Elsaesser, “Recent progress
in ultrafast x-ray diffraction,” Chemphyschem 7, 783–792 (2006).
3
M. Chergui and A. H. Zewail, “Electron and x-ray methods of ultrafast struc-
APPENDIX: CALCULATION OF THE SCALING tural dynamics: Advances and applications,” Chemphyschem 10, 28–43
FACTOR FOR THE PXS SETUP (2009).
4
T. Elsaesser and M. Woerner, “Perspective: Structural dynamics in condensed
With an ellipsoidal parameterization of the exponent of the matter mapped by femtosecond x-ray diffraction,” J. Chem. Phys. 140, 020901
Gaussian functions, the resolution area can be described by (2014).
Struct. Dyn. 8, 014302 (2021); doi: 10.1063/4.0000040 8, 014302-8
C Author(s) 2021
VStructural Dynamics ARTICLE scitation.org/journal/sdy
5 24
M. Kozina, M. Fechner, P. Marsik, T. van Driel, J. M. Glownia, C. Bernhard, S. Slesazeck, H. M€ahne, H. Wylezich, A. Wachowiak, J. Radhakrishnan, A.
M. Radovic, D. Zhu, S. Bonetti, U. Staub, and M. C. Hoffmann, “Terahertz- Ascoli, R. Tetzlaff, and T. Mikolajick, “Physical model of threshold switching
driven phonon upconversion in SrTiO3,” Nat. Phys. 15, 387–392 (2019). in NbO2 based memristors,” RSC Adv. 5, 102318–102322 (2015).
6 25
S. Pandey, R. Bean, T. Sato, I. Poudyal, J. Bielecki, J. C. Villarreal, O. Yefanov, M. R. Beebe, J. M. Klopf, Y. Wang, S. Kittiwatanakul, J. Lu, S. A. Wolf, and R.
V. Mariani, T. A. White, C. Kupitz, M. Hunter, M. H. Abdellatif, S. Bajt, V. A. Lukaszew, “Time-resolved light-induced insulator-metal transition in nio-
Bondar, A. Echelmeier, D. Doppler, M. Emons, M. Frank, R. Fromme, Y. bium dioxide and vanadium dioxide thin films,” Opt. Mater. Express 7, 213
Gevorkov, G. Giovanetti, M. Jiang, D. Kim, Y. Kim, H. Kirkwood, A. (2017).
26
Klimovskaia, J. Knoska, F. H. M. Koua, R. Letrun, S. Lisova, L. Maia, V. R. K. Kirby, “Thermal expansion of rutile from 100 to 700 K,” J. Res. Nat. Bur.
Mazalova, D. Meza, T. Michelat, A. Ourmazd, G. Palmer, M. Ramilli, R. Stand. Sect. A, Phys. Chem. 71A, 363–369 (1967).
27
Schubert, P. Schwander, A. Silenzi, J. Sztuk-Dambietz, A. Tolstikova, H. N. J. Kaiser, D. S. Rimai, and R. J. Sladek, “Thermal expansivity in semiconducting
Chapman, A. Ros, A. Barty, P. Fromme, A. P. Mancuso, and M. Schmidt, NbO2,” Solid State Commun. 32, 925–927 (1979).
28
“Time-resolved serial femtosecond crystallography at the european XFEL,” M. Bargheer, N. Zhavoronkov, R. Bruch, H. Legall, H. Stiel, M. Woerner, and
Nat. Methods 17, 73–76 (2020). T. Elsaesser, “Comparison of focusing optics for femtosecond x-ray
7
G. J. Williams, S. Lee, D. A. Walko, M. A. Watson, W. Jo, D. R. Lee, and E. C. diffraction,” Appl. Phys. B 80, 715–719 (2005).
29
Landahl, “Direct measurements of multi-photon induced nonlinear lattice P. Ruello and V. E. Gusev, “Physical mechanisms of coherent acoustic phonons
dynamics in semiconductors via time-resolved x-ray scattering,” Sci. Rep. 6, generation by ultrafast laser action,” Ultrasonics 56, 21–35 (2015).
30
39506 (2016). T. Guang-Lei, H. Hong-Bo, and S. Jian-Da, “Effect of microstructure of tio 2
8
A. von Reppert, L. Willig, J.-E. Pudell, S. P. Zeuschner, G. Sellge, F. Ganss, O. thin films on optical band gap energy,” Chin. Phys. Lett. 22, 1787–1789 (2005).
31
Hellwig, J. A. Arregi, V. Uhl\v r, A. Crut, and M. Bargheer, “Spin stress contri- D. Schick, M. Herzog, A. Bojahr, W. Leitenberger, A. Hertwig, R. Shayduk, and
bution to the lattice dynamics of FePt,” Sci. Adv. 6, eaba1142 (2020). M. Bargheer, “Ultrafast lattice response of photoexcited thin films studied by x-
9
S. P. Zeuschner, J.-E. Pudell, A. von Reppert, M. Deb, E. Popova, N. Keller, M. ray diffraction,” Struct. Dyn. 1, 064501 (2014).
32
R€ossle, M. Herzog, and M. Bargheer, “Measurement of transient strain induced C. Rose-Petruck, R. Jimenez, T. Guo, A. Cavalleri, C. W. Siders, F. Rksi, J. A.
by two-photon excitation,” Phys. Rev. Res. 2, 022013 (2020). Squier, B. C. Walker, K. R. Wilson, and C. P. J. Barty,
10
J. Pudell, A. A. Maznev, M. Herzog, M. Kronseder, C. H. Back, G. Malinowski, “Picosecond–milliångstr€ om lattice dynamics measured by ultrafast x-ray
A. von Reppert, and M. Bargheer, “Layer specific observation of slow thermal diffraction,” Nature 398, 310–312 (1999).
33
equilibration in ultrathin metallic nanostructures by femtosecond x-ray K. Sokolowski-Tinten, C. Blome, C. Dietrich, A. Tarasevitch, M. Horn von
diffraction,” Nat. Commun. 9, 3335 (2018). Hoegen, D. von der Linde, A. Cavalleri, J. Squier, and M. Kammler,
11
U. Pietsch, V. Holy, and T. Baumbach, High-Resolution X-Ray Scattering: From “Femtosecond x-ray measurement of ultrafast melting and large acoustic tran-
Thin Films to Lateral Nanostructures, Advanced Texts in Physics, 2nd ed. sients,” Phys. Rev. Lett. 87, 225701 (2001).
34
(Springer, New York, 2004). C. v. Korff Schmising, M. Bargheer, M. Kiel, N. Zhavoronkov, M. Woerner, T.
12
P. F. Fewster, “Reciprocal space mapping,” Crit. Rev. Solid State Mater. Sci. 22, Elsaesser, I. Vrejoiu, D. Hesse, and M. Alexe, “Strain propagation in nanolay-
69–110 (1997). ered perovskites probed by ultrafast x-ray diffraction,” Phys. Rev. B 73, 212202
13
A. Kinne, M. Thoms, H. R. Ress, T. Gerhard, M. Ehinger, W. Faschinger, and (2006).
35
G. Landwehr, “Image plates as one-dimensional detectors in high-resolution x- A. Morak, T. K€ampfer, I. Uschmann, A. L€ ubcke, E. F€orster, and R. Sauerbrey,
ray diffraction,” J. Appl. Crystallogr. 31, 446–452 (1998). “Acoustic phonons in InSb probed by time-resolved x-ray diffraction,” Phys.
14
O. Masson, A. Boulle, R. Guinebretière, A. Lecomte, and A. Dauger, “On the use of Status Solidi B 243, 2728–2744 (2006).
36
one-dimensional position sensitive detector for x-ray diffraction reciprocal space H. J. Lee, J. Workman, J. S. Wark, R. D. Averitt, A. J. Taylor, J. Roberts, Q.
mapping: Data quality and limitations,” Rev. Sci. Instrum. 76, 063912 (2005). McCulloch, D. E. Hof, N. Hur, S.-W. Cheong, and D. J. Funk, “Optically
15
M. Kozina, T. Hu, J. S. Wittenberg, E. Szilagyi, M. Trigo, T. A. Miller, C. Uher, induced lattice dynamics probed with ultrafast x-ray diffraction,” Phys. Rev. B:
A. Damodaran, L. Martin, A. Mehta, J. Corbett, J. Safranek, D. A. Reis, and A. Condens. Matter Mater. Phys. 77, 132301 (2008).
37
M. Lindenberg, “Measurement of transient atomic displacements in thin films M. Nicoul, U. Shymanovich, A. Tarasevitch, D. von der Linde, and K.
with picosecond and femtometer resolution,” Struct. Dyn. 1, 034301 (2014). Sokolowski-Tinten, “Picosecond acoustic response of a laser-heated gold-film
16
M. Reinhardt and W. Leitenberger, “Xpp: X-ray pump probe station at BESSY studied with time-resolved x-ray diffraction,” Appl. Phys. Lett. 98, 191902
II,” J. Large-Scale Res. Facil. 2, 1–4 (2016). (2011).
17 38
A. Koc, M. Reinhardt, A. von Reppert, M. Roessle, W. Leitenberger, K. F. Quirin, M. Vattilana, U. Shymanovich, A.-E. El-Kamhawy, A. Tarasevitch, J.
Dumesnil, P. Gaal, F. Zamponi, and M. Bargheer, “Ultrafast x-ray diffraction Hohlfeld, D. von der Linde, and K. Sokolowski-Tinten, “Structural dynamics in
thermometry measures the influence of spin excitations on the heat transport FeRh during a laser-induced metamagnetic phase transition,” Phys. Rev. B 85,
through nanolayers,” Phys. Rev. B 96, 014306 (2017). 020103(R) (2012).
18 39
F. Zamponi, Z. Ansari, C. Korff Schmising, P. Rothhardt, N. Zhavoronkov, M. T. G. White, P. Mabey, D. O. Gericke, N. J. Hartley, H. W. Doyle, D.
Woerner, T. Elsaesser, M. Bargheer, T. Trobitzsch-Ryll, and M. Haschke, McGonegle, D. S. Rackstraw, A. Higginbotham, and G. Gregori, “Electron-
“Femtosecond hard x-ray plasma sources with a kilohertz repetition rate,” phonon equilibration in laser-heated gold films,” Phys. Rev. B: Condens.
Appl. Phys. A 96, 51–58 (2009). Matter Mater. Phys. 90, 014305 (2014).
19 40
D. Schick, R. Shayduk, A. Bojahr, M. Herzog, C. von Korff Schmising, P. Gaal, R. Li, H. E. Elsayed-Ali, J. Chen, D. Dhankhar, A. Krishnamoorthi, and P. M.
and M. Bargheer, “Ultrafast reciprocal-space mapping with a convergent Rentzepis, “Ultrafast time-resolved structural changes of thin-film ferromag-
beam,” J. Appl. Crystallogr. 46, 1372–1377 (2013). netic metal heated with femtosecond optical pulses,” J. Chem. Phys. 151,
20
J. Stoever, J. E. Boschker, S. Bin Anooz, M. Schmidbauer, P. Petrik, J. 124702 (2019).
41
Schwarzkopf, M. Albrecht, and K. Irmscher, “Approaching the high intrinsic M. Afshari, P. Krumey, D. Menn, M. Nicoul, F. Brinks, A. Tarasevitch, and K.
electrical resistivity of nbo 2 in epitaxially grown films,” Appl. Phys. Lett. 116, Sokolowski-Tinten, “Time-resolved diffraction with an optimized short pulse
182103 (2020). laser plasma x-ray source,” Struct. Dyn. 7, 014301 (2020).
21 42
T. Sakata, K. Sakata, and I. Nishida, “Study of phase transition in NbO2,” Phys. M. Sander, A. Koc, C. T. Kwamen, H. Michaels, A. v. Reppert, J. Pudell, F.
Status Solidi B 20, K155–K157 (1967). Zamponi, M. Bargheer, J. Sellmann, J. Schwarzkopf, and P. Gaal,
22
S. H. Shin, T. Halpern, and P. M. Raccah, “High–speed high–current field “Characterization of an ultrafast bragg-switch for shortening hard x-ray
switching of NbO2,” J. Appl. Phys. 48, 3150–3153 (1977). pulses,” J. Appl. Phys. 120, 193101 (2016).
23 43
S. Kim, J. Park, J. Woo, C. Cho, W. Lee, J. Shin, G. Choi, S. Park, D. Lee, B. H. A. von Reppert, J. Pudell, A. Koc, M. Reinhardt, W. Leitenberger, K. Dumesnil,
Lee, and H. Hwang, “Threshold-switching characteristics of a nanothin-NbO2- F. Zamponi, and M. Bargheer, “Persistent nonequilibrium dynamics of the
layer-based Pt/NbO2/Pt stack for use in cross-point-type resistive memories,” thermal energies in the spin and phonon systems of an antiferromagnet,”
Microelectron. Eng. 107, 33–36 (2013). Struct. Dyn. 3, 054302 (2016).
Struct. Dyn. 8, 014302 (2021); doi: 10.1063/4.0000040 8, 014302-9
C Author(s) 2021
VStructural Dynamics ARTICLE scitation.org/journal/sdy
44
A. von Reppert, R. M. Sarhan, F. Stete, J. Pudell, N. Del Fatti, A. Crut, J. Koetz, “Tracking picosecond strain pulses in heterostructures that exhibit giant mag-
F. Liebig, C. Prietzel, and M. Bargheer, “Watching the vibration and cooling of netostriction,” Struct. Dyn. 6, 024302 (2019).
47
ultrathin gold nanotriangles by ultrafast x-ray diffraction,” J. Phys. Chem. C A. von Reppert, M. Mattern, J.-E. Pudell, S. P. Zeuschner, K. Dumesnil, and M.
120, 28894–28899 (2016). Bargheer, “Unconventional picosecond strain pulses resulting from the satura-
45
A. von Reppert, L. Willig, J.-E. Pudell, M. R€
ossle, W. Leitenberger, M. Herzog, F. tion of magnetic stress within a photoexcited rare earth layer,” Struct. Dyn. 7,
Ganss, O. Hellwig, and M. Bargheer, “Ultrafast laser generated strain in granular 024303 (2020).
48
and continuous FePt thin films,” Appl. Phys. Lett. 113, 123101 (2018). J.-E. Pudell, M. Mattern, M. Hehn, G. Malinowski, M. Herzog, and M.
46
S. P. Zeuschner, T. Parpiiev, T. Pezeril, A. Hillion, K. Dumesnil, A. Anane, J. Bargheer, “Heat transport without heating?—An ultrafast x-ray perspective
Pudell, L. Willig, M. R€ ossle, M. Herzog, A. von Reppert, and M. Bargheer, into a metal heterostructure,” Adv. Funct. Mater. 30, 2004555 (2020).
Struct. Dyn. 8, 014302 (2021); doi: 10.1063/4.0000040 8, 014302-10
C Author(s) 2021
VYou can also read