Rejuvenation and shear banding in model amorphous solids - ESPCI Paris
←
→
Page content transcription
If your browser does not render page correctly, please read the page content below
PHYSICAL REVIEW E 101, 033001 (2020)

                                  Rejuvenation and shear banding in model amorphous solids
            Armand Barbot ,1 Matthias Lerbinger,1 Anaël Lemaître,2 Damien Vandembroucq,1 and Sylvain Patinet                                   1,*
                    1
                     PMMH, CNRS, ESPCI Paris, Université PSL, Sorbonne Université, Université de Paris, 75005 Paris, France
               2
                   Université Paris-Est, Laboratoire Navier (UMR 8205), CNRS, ENPC, IFSTTAR, F-77420 Marne-la-Vallée, France

                                        (Received 23 June 2019; accepted 19 February 2020; published 4 March 2020)

                       We measure the local yield stress, at the scale of small atomic regions, in a deeply quenched two-dimensional
                    glass model undergoing shear banding in response to athermal quasistatic deformation. We find that the
                    occurrence of essentially a single plastic event suffices to bring the local yield stress distribution to a well-defined
                    value for all strain orientations, thus essentially erasing the memory of the initial structure. It follows that in a
                    well-relaxed sample, plastic events cause the abrupt (nucleation-like) emergence of a local softness contrast and
                    thus precipitate the formation of a band, which, in its early stages, is measurably softer than the steady-state flow.
                    Moreover, this postevent yield stress ensemble presents a mean value comparable to that of the inherent states
                    of a supercooled liquid around the mode-coupling temperature TMCT . This, we argue, explains that the transition
                    between brittle and ductile yielding in amorphous materials occurs around a comparable parent temperature.
                    Our data also permit to capture quantitatively the contributions of pressure and density changes and demonstrate
                    unambiguously that they are negligible compared with the changes of softness caused by structural rejuvenation.

                    DOI: 10.1103/PhysRevE.101.033001

                            I. INTRODUCTION                                       rearrangements [25–28]. No atomistic data, however, exist
                                                                                  that support this idea.
    Shear banding, an intense localization of plastic strain
                                                                                     In this article, we use a recently developed numerical
within narrow bands, is the primary mode of mechanical
                                                                                  method [22,29,30] that permits to access local yield stress at
failure in a variety of amorphous materials including metallic
                                                                                  the zone scale (i.e., in regions a few atoms wide) in arbitrary
glasses [1] or granular media [2]. When loading conditions
                                                                                  orientations. This method was previously applied to quenched
permit, bands may extend throughout a piece of material
                                                                                  glasses prior to any plastic deformation. In a companion paper
and sustain repeated plastic activity while preserving their
                                                                                  [31], we use it to show that the Bauschinger effect results
overall structure [3]. While it is thus clear that the material
                                                                                  from plasticity-induced yield strength anisotropies. Here we
inside shear bands is softer than the surrounding, undeformed,
                                                                                  use this technique to resolve the local yield stress during
glass, the structural origin of this softness constrast, and the
                                                                                  shear banding. We thus demonstrate that the occurrence of
mechanisms underlying its rapid emergence, remain highly
                                                                                  a small amount of plastic strain erases the memory of the
debated topics [4–8].
                                                                                  local structural properties acquired during aging. Moreover, it
    Progress on these issues is hampered by basic difficulties
                                                                                  brings the average local yield stress, in all shear orientations,
in describing the mechanisms of plastic deformation in glasses
                                                                                  to a value smaller than in the steady flow state. The mean yield
[9–15]. In these systems, indeed, structural disorder disallows
                                                                                  stress of postevent zones compares with that of supercooled
the existence of topological defects akin to crystalline dis-
                                                                                  liquid inherent states (ISs) around TMCT : This explains that
locations [16,17], and plasticity results from the intermittent
                                                                                  the equilibration temperature separating ductile and brittle
occurrence of local rearrangements (“flips”) triggered when
                                                                                  responses is located in the vicinity of TMCT [32]. When loading
the atoms within “zones” (small regions a few atoms wide)
                                                                                  a well-relaxed sample, the suddenness of the rejuvenation
reach mechanical instabilities [18–20]. Although the prox-
                                                                                  process causes a rapid drop in the local yield stress which
imity of a packing to instabilities may correlate with usual
                                                                                  precipitates the formation of a band that persists over large
observables such as local density, pressure, or shear stress,
                                                                                  strain scales thanks to the softness contrast.
these correlations are weak [21,22], and the question remains
open of their predictive value in the context of shear banding.
    Mesoscopic models [23,24] of plasticity represent a glass                                        II. NUMERICAL METHODS
as an elastic continuum in which zones are embedded. They
                                                                                     We use the same atomistic model as in Ref. [30]: a
prove able to reproduce most of the phenomenology of
                                                                                  two-dimensional binary system comprising 104 equal-mass
amorphous plastic deformation, in particular the appearance
                                                                                  atoms that interact via a Lennard-Jones (LJ) potential with
of shear bands, yet only by postulating that local plas-
                                                                                  second-order smoothing at cutoff. All values are given in LJ
tic thresholds are weakened after the occurrence of local
                                                                                  units. Preparation and deformation are performed with peri-
                                                                                  odic boundary conditions at a constant volume corresponding
                                                                                  to a density ρ  1.02. Samples are prepared via a slow
                                                                                  temperature ramp at rate Ṫ = 0.32 × 10⁻⁶ across the glass
 *
     sylvain.patinet@espci.fr                                                     transition temperature range. This allows for equilibration

2470-0045/2020/101(3)/033001(10)                                           033001-1                                   ©2020 American Physical Society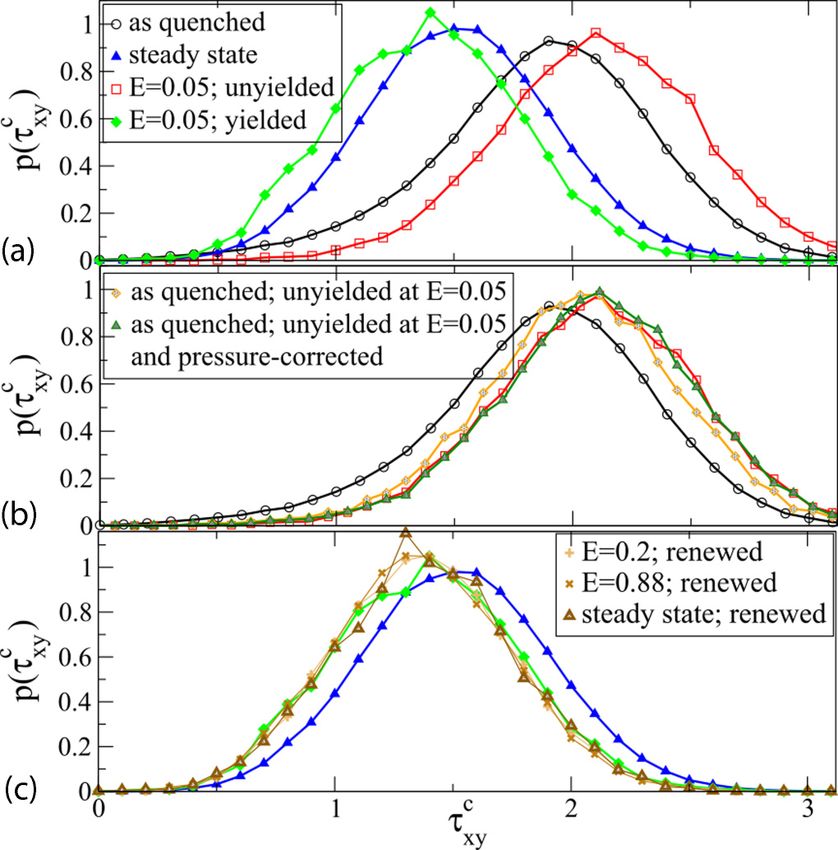
ARMAND BARBOT et al.                                                                            PHYSICAL REVIEW E 101, 033001 (2020)

                                                                         field maps, as shown here at E = 0.05, typically display a
                                                                         high-strain region crossing the cell throughout. This phe-
                                                                         nomenon may only arise from structural causes, since our use
                                                                         of AQS shearing rules out the competition between timescales
                                                                         [6], inertia [8], or local heating [4].
                                                                             Local yield stress values are measured in sheared con-
                                                                         figurations using the method of Refs. [22,30]. It consists in
                                                                         isolating circular inclusions of radius Rfree = 5 and straining
                                                                         them by requiring outer atoms to follow an affine motion
                                                                         corresponding to pure shear along an arbitrary orientation
                                                                         α ∈ [0, π ]. Inner, inclusion atoms are free to move nonaffinely
                                                                         and required, using the AQS method, to remain mechanically
                                                                         balanced. The first plastic rearrangement they undergo deter-
                                                                         mines the yield point of the inclusion in orientation α and
                                                                         defines the local yield stress τ c (α) and critical strain c (α).
                                                                         For any considered α, the yield threshold is thus identified for
                                                                         all inclusions centered at regular grid points. In this article,
                                                                         we primarily focus on the changes in softness that affect the
                                                                         forward barriers, in the loading orientation with α = 0, due
                                                                         to their direct relevance to the forward plastic response. Yet,
    FIG. 1. (a) Mean shear stress τxy (black) and pressure P (blue) as   we will show [Sec. III C] that softening occurs in all shear
a function of Hencky’s equivalent shear strain E during simple shear     orientations, and in particular in the backward one (α = π /2).
AQS loading. Bottom: Local maps at E = 0.05; (b) accumulated                 Let us emphasize that we focus here on the threshold τ c ,
strain  and (c) yield stress τxyc .                                     not on the residual strength τ c = τ c − τ , with τ the local
                                                                         stress. τ c is an adequate predictor of the immediate plastic
                                                                         response [22,30] but explicitly depends on local stress, i.e., on
until the alpha relaxation time is of order Tg/Ṫ  106 , which          elastic loading. τ c does not and thus constitutes an intrinsic
corresponds to a fictive temperature T f  0.29 as detailed              gauge of local glassy structures.
in Appendix A. When reaching T = 0.078 TMCT , each sam-
ple is further quenched by energy minimization to obtain a                         III. LOCAL YIELD STRESS EVOLUTION
mechanically equilibrated state. These initial states are then
subjected to athermal quasistatic (AQS) [18,33] simple shear                                   A. Shear band profiles
deformation along the x axis up to a linear strain γ = 5,                   Figure 1(c) presents the resulting local yield stress map in
with steps γ = 10−4 and a minimization force tolerance of               the loading orientation τ c (α = 0) = τxyc
                                                                                                                     at E = 0.05. When
10−11 . Unless otherwise specified, all averages and distribu-           comparing with the strain map of Fig. 1(b), it is strikingly
tions are obtained by collecting data from 100 independent               clear that the material in the band tends to present lower yield
samples.                                                                 stress values than the material around it. We thus directly see
    In such strongly deformed systems, local strains must                here that, as expected, plasticity induces softening and thus
be computed using finite-strain theory (see Appendix B). A               localization in the band [35]. Below we use this ability to gain
scalar measure of local strain  is provided by the square root          insight on the mechanisms underlying the band formation and
of the second invariant of the logarithmic (Hencky) strain.              stability.
 macroscopic counterpart of this quantity is E = ln(γ /2 +
The                                                                         To quantify the emergence and evolution of bands, we
   1 + γ 2 /4).                                                          focus first on samples (53 of 100) where a single band nu-
    The sample-averaged stress-strain response during                    cleates horizontally.1 We identify as band center the ordinate
constant-volume AQS loading is reported in Fig. 1(a). It                 ySB where the x-averaged local strain reaches its maximum
displays a typical stress overshoot followed by softening.               at the macroscopic strain E = 0.1 where the band is clearly
As observed in other systems [34], macroscopic pressure                  visible in all samples. We then report in Fig. 2, as a function
P rises sharply until the peak and continues to grow,                    of y − ySB , the x-averaged strains and yield stresses at several
albeit more slowly, thereafter. This pressure increase in                macroscopic strains.
our constant-volume simulations is the analog of a volume                   The strain profiles [Fig. 2(a)] clearly show that the band
increase in typical fixed-pressure experiments. It is the                grows over time [13,36]. This would be inaccessible in experi-
signature that plastic activity creates configurations that are          ments as the band evolution is usually interrupted by mechan-
less well packed than the original aged ones, an idea usually            ical failure [1]. But, in simulations, since periodic boundary
invoked to justify the still classical free-volume theory. We
will, however, rule out this interpretation quantitatively by
showing that the plastically induced pressure increase, or                1
                                                                            In 25 samples, a band initially nucleates vertically yet cannot
local density decrease, contributes only a minor fraction of             persist due to the simple shear Lees-Edwards boundary conditions:
strain softening.                                                        A horizontal band then emerges later. The rest of the samples exhibit
    The plastic response of our relaxed systems systematically           more complex behavior and show intermediate crossed configura-
involves shear banding as illustrated in Fig. 1(b): Local strain         tions, porelike structure [36], and multiple shear bands.

                                                                   033001-2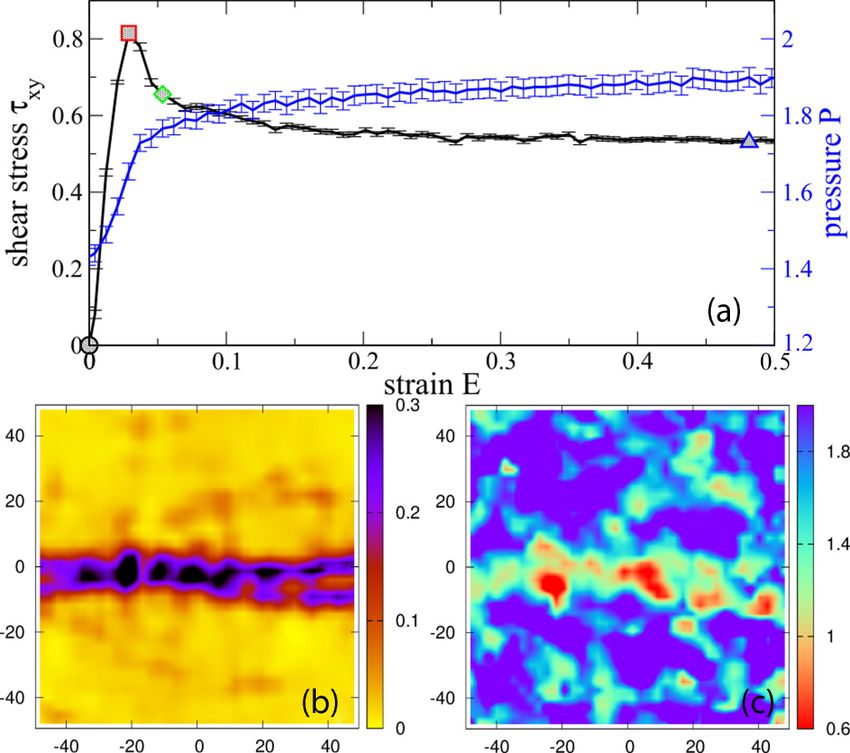
REJUVENATION AND SHEAR BANDING IN MODEL … PHYSICAL REVIEW E 101, 033001 (2020)
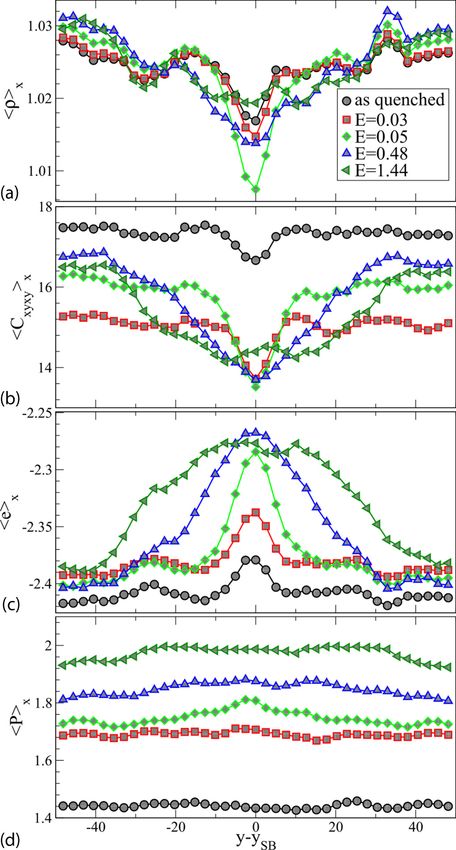
FIG. 2. Local averages computed along the shear direction x for FIG. 3. Top: Average yield stresses τxyc as a function of the
different strain levels E as a function of the vertical position y with normalized local strain / ∗ for various macroscopic strain E . The
respect to the shear band position ySB : (a) strain x and (b) yield continuous, dashed, and dash-dotted horizontal lines correspond
stress τxyc x . The symbols used for the different strain levels are the to τxyc in the as-quenched, steady-state, and renewed ensembles,
same as for Fig. 1(a). respectively. Bottom: Distribution of log10 (/ ∗ ).
conditions maintain the system integrity, the softness contrast
eventually resorbs itself and the system reaches a unique, high-strain ones, which have undergone local plastic events.
statistically homogeneous, steady flow state [31]. The yield As E increases, the first peak expectedly decreases in ampli-
stress profiles [Fig. 2(b)] distinctly show that the softer region tude, while the second one grows and shifts rightward, which
coincides with the band and grows at a similar rate. At E = is expected to result from the accumulation of plastic activity.
0.05, the contrast of local yield stresses between the band and The crossover strain scale between the two peaks happens to
the outer region is of order 27%, in striking agreement with be ∗ 2c , with c = 0.054 the average critical strain
experimental hardness measurements in metallic glasses [37]. in the as-quenched state. ∗ thus corresponds roughly with
Similarly band-centered density, shear modulus, and po- the scale of the local strain change caused by a plastic
tential energy profiles are displayed in Appendix C. They rearrangement.
show that the band also presents a 2% lower density, a 17% The τxy
c
curves of Fig. 3(a) constitute the first direct
lower shear modulus, and a 5% higher potential energy than and quantitative observation of local softening associated
the surrounding material. In agreement with Ref. [38], these with local yielding. They systematically decay with , with
profiles demonstrate that the position of the band correlates, a characteristic strain of order ∗ . This key observation en-
albeit at different degrees, with the initial values of the tails that the memory of the initial state is erased with a
considered properties in the quenched state. Although the characteristic strain corresponding to essentially one event. It
initial central fluctuation would decrease with system size, explains the rapidity of softening and thus localization. Yet
this merely illustrates that the AQS response is completely there are several features of these curves that are surprising
governed by structure. Yet the question remains to understand and call for further explanations: (i) the very low strain
why softening occurs just after a few percentage strains, thus (/ ∗ 0.1), elastic regions present higher yield stress values
promoting the formation of the band. than the quenched state; (ii) there is a significant spread
between the curves, which entails that the local yield stress
depends on both E and ; and, more specifically, (iii) at small
B. Local yield stress vs. local plastic strain E , highly strained regions are unexpectedly softer than the
In this perspective, we report in Fig. 3, for different E ’s, steady (homogeneous) flow state, so that at a given , the
the average yield stress [Fig. 3 (top)] conditioned by the local local yield stress grows with E , which constitutes a hardening
strain from the quench state. These data are collected from effect.
all 100 systems of our ensemble (irrespective of the initial To clarify these issues, we focus on E = 0.05 and dis-
band orientation). The distribution of log10 (/ ∗ ), which is tinguish within each configuration two types of local envi-
the abscissa of this lin-log graph, is reported in the bottom ronments: (a) regions where < ∗ /8 are called “unyielded”
panel and shows a characteristic two-peak structure [20] that and (b) those where > 2 ∗ are called “yielded.” The dis-
separates low-strain, elastically responding regions with the tributions of local yield stresses in these two subsets are
033001-3
ARMAND BARBOT et al.                                                                              PHYSICAL REVIEW E 101, 033001 (2020)

                                                                         (respectively)2 hence affect the whole yield stress distribution;
                                                                         in fact, they even occur in all orientations as shown below in
                                                                         Fig. 5.
                                                                             The hardening of unyielded sites can be attributed pri-
                                                                         marily to a statistical effect: the progressive elimination (ex-
                                                                         haustion) from this ensemble of the weakest sites of the
                                                                         quenched state when they yield [39]. Indeed, if we pick out
                                                                         the unyielded sites at E = 0.05 and plot their yield stress
                                                                         distribution in the initial quenched state [Fig. 4(b), orange dia-
                                                                         monds], then we recover the major part of the hardening. The
                                                                         residual difference is entirely attributable to the large (nearly
                                                                         0.4) pressure increase during loading. Indeed, in unyielded
                                                                         sites, τxy
                                                                                   c
                                                                                      depends roughly linearly, but quite weakly, on P
                                                                         (see Appendix C), and when both exhaustion and the linear
                                                                         pressure dependence of τxy    c
                                                                                                           are taken into account (green
                                                                         triangles), we recover the distribution of yield stress outside
                                                                         shear bands.
                                                                             We previously observed that yielded sites at finite strains
                                                                         (especially E = 0.05) are weaker than the steady flow state.
                                                                         We now show this results from a general property of “freshly
                                                                         renewed,” i.e., postyield sites. To evidence this idea, we pick
                                                                         out sites that yield (i.e., present a local strain change  >
                                                                         2 ∗ ) over a fixed, small amount of macroscopic strain E =
    FIG. 4. (a) Distribution of local yield stresses τxyc in the as-     0.05 (as before), yet starting from different initial states, say,
quenched state (black), the steady flow state (blue), at E = 0.05        strain E . Figure 4(c) compares the yield stress distributions
in the unyielded (red) and yielded (green) areas and the renewed
                                                                         in these postyield states for E values ranging from 0 (as-
state (shades of brown). [(b) and (c)] The effect of pressure and
                                                                         quenched) to the steady AQS flow state. Strikingly, all these
statistical hardening (see text for details) for the as-quenched state
                                                                         distribution collapse. This constitutes a key observation of our
and unyielded sites (b); the steady flow state and yielded sites (c).
                                                                         work. It establishes that essentially one plastic event brings the
                                                                         local structure to a unique yield stress distribution, regardless
                                                                         of the initial state.
                                                                             Note that the final states explored in Fig. 4(c) present suffi-
shown in Fig. 4, along with their counterparts in the initial
                                                                         ciently different pressure levels that we should see systematic
as-quenched ensemble and steady homogeneous flow. We find
                                                                         deviations from collapse.3 This is not the case, which implies
that (A) unyielded regions (mainly outside the shear band)
                                                                         that the pressure-yield-stress relation is specific to each re-
are harder than the as-quenched state and (B) yielded ones
                                                                         newed ensemble as shown in Appendix C: The renewal pro-
are (unexpectedly) softer than the steady flow. The hardening
                                                                         cess does not produce a unique structural “state” but instead
and softening previously noted above under points (i) and (iii)
                                                                         a unique yield stress distribution under different conditions.
                                                                         This idea is often speculated to hold in the construction of
                                                                         mean-field [10,40,41] or mesoscale models [25] but was never
                                                                         directly observed. It entails that shear banding results from a
                                                                         process akin to nucleation: the production of structures of a
                                                                         specific softness level after essentially one plastic event.
                                                                             The hardening of yielded sites with increasing E then
                                                                         appears to occur due to the rapid elimination, via further
                                                                         yielding, of the weakest among the freshly renewed sites. As
                                                                         E increases, beyond 0.05, the regions of a fixed  comprise
                                                                         an increasing fraction of sites that have yielded early but are
                                                                         strong and have resisted since. This finally explains that the
                                                                         steady flow state is harder than the freshly renewed sites.

                                                                          2
                                                                             These effects can also be seen in the τxyc x profiles of Fig. 2(b) as
                                                                         material outside the band initially hardens, while the middle of the
   FIG. 5. Distribution of local yield stresses τxyc in the loading      band softens at largest E ’s.
                                                                           3
(continuous lines) and reverse directions (dashed lines) in the as-          Our renewed ensembles show mean pressure differences up to
quenched state (black), the steady flow state (blue), at E = 0.05 in     0.25 which are expected to correspond to mean yield stress differ-
the unyielded (red) and yielded (green) areas.                           ences ≈0.0625.

                                                                   033001-4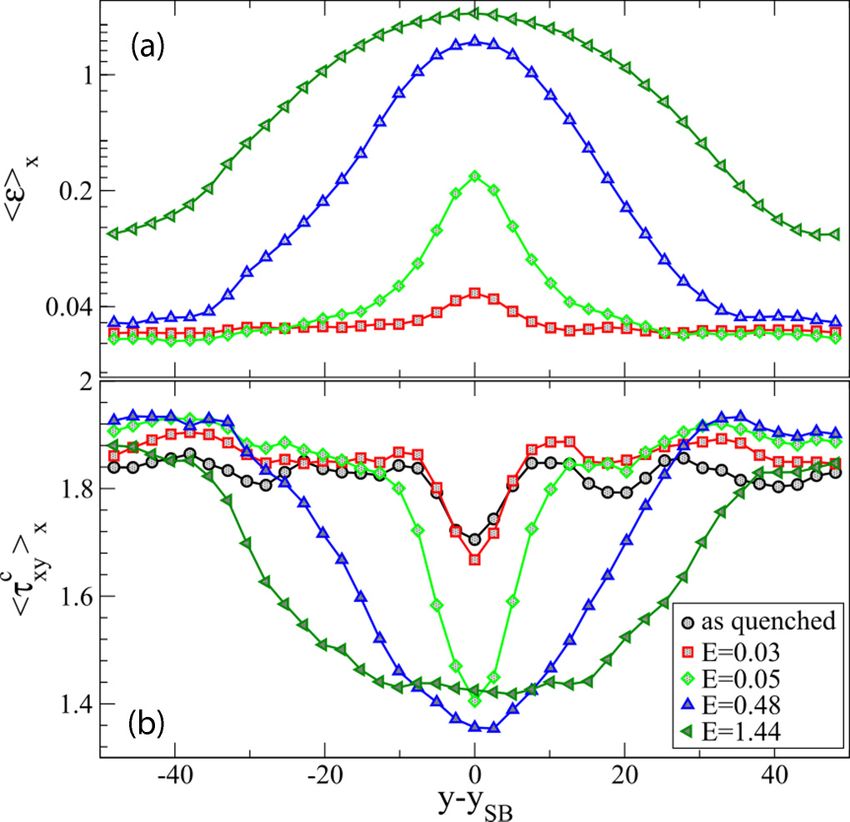
REJUVENATION AND SHEAR BANDING IN MODEL …                                                        PHYSICAL REVIEW E 101, 033001 (2020)

    FIG. 6. Average local yield stress τxyc  as conditioned by local      FIG. 7. Average local yield stresses τxyc  of inherent states as a
density in unyielded (red) and yielded (green) states at E = 0.05 and    function of their parent (liquid) temperatures.
in the renewed ensembles (shades of brown).

                                                                         postyield structures have comparable barriers heights with
            C. Local yield stresses in other directions
                                                                         a liquid lying on the upper layers of the potential energy
    The distributions of local yield stresses in the forward             landscape (PEL). From this standpoint, the fact that the av-
(α = 0) and backward (α = π /2) global shear directions are              erage yield stress in postyield sites compares with that of
shown in Fig. 5. As for the forward simple shear direction               liquid ISs near TMCT appears to constitute a fundamental
investigated above, we report the yielded and unyielded states           feature of the PEL. It then explains that the critical parent
at E = 0.05, along with their counterparts in the initial as-            temperature separating brittle and ductile yielding transitions
quenched ensemble and steady homogeneous flow. Here τxy    c
                                                             =           in amorphous materials is located in the vicinity of TMCT [32],
τ c for 2α = 0 and = −τ c for 2α = π , so that forward (respec-          since a contrast must exist between the yield stress in the
tively, reverse) barriers correspond to positive (respectively,          initial state and in the postyield sites for shear banding to
negative) abscissa. The lack of τxy c
                                       → −τxy c
                                                 symmetry in all         occur.
three deformed ensembles points to a flow-induced anisotropy                 Note, however, that we consider here just an average.
studied in detail in Ref. [31]. We do not address this effect            Furthermore, rearranged and inherent states cannot be strictly
in this article but focus on the overall changes in softness             compared due to the nonzero polarization in the barrier en-
that affect the forward barriers in the loading orientation.             semble along the loading direction [31] and to the slight in-
We see here that the rejuvenation process, in particular the             crease of the pressure in flowing states. Despite this oversim-
strain-softening, occurs in fact in all orientations [31].               plification, an inherent state obtained near TMCT is therefore
                                                                         expected to give a good estimate of the stationary threshold
               D. Local yield stress vs. free volume                     distributions and thus act as a limit between softening (leading
                                                                         to strain localization) and hardening regimes in deeply and
    To quantify the possible role of local expansion in soften-
                                                                         poorly quenched glasses, respectively [32]. This result is also
ing, we report in Fig. 6 τxy
                            c
                               as conditioned by local density in
                                                                         fully consistent with recent findings obtained in oscillatory
both yielded and unyielded site. These data show very clearly
                                                                         shear simulations [42,43], showing that the transition from
that, at the same ρ, yielded and unyielded sites present sharply
                                                                         annealed to yielded behavior is found for parent temperatures
different yield stresses: local density, hence, cannot predict
                                                                         in the vicinity of the dynamical crossover temperature TMCT .
local softness. The 2% density difference seen between the
band and the outer, elastic, region corresponds to a maximum
τxy
  c
    variation of 4%, which is insignificant compared with the                                  IV. CONCLUSIONS
observed 27% change in τxy     c
                                  . The leading cause of softening
is the production by plasticity of packings in a different                   All mesoscopic models of amorphous plasticity, starting
“state,” i.e., presenting different τxyc
                                          vs. ρ (or other) relation,     from the early works by Argon and coworkers [44] to the most
than the initial material.                                               recent space-resolved models [24], postulate the existence of
                                                                         local thresholds that are reshuffled during plastic events and
                                                                         affected by local stress. These general assumptions have been
  E. Variation of local yield stresses with parent temperature           guided by mainly two observations. First, plasticity results
   We report in Fig. 7 the average τxyc
                                          computed for inherent         from the rearrangement of local packings, which suggests
states obtained after instantaneous quenches from different              it is primarily controlled by local yielding thresholds. Sec-
parent temperatures of equilibrated liquids. It is noteworthy            ond, it involves avalanche behavior, which implies long-range
that the value τxy
                 c
                      1.32 in postyield states is comparable           correlations mediated by elastic deformations. Mesoscopic
with the average yield stress in the ISs of a supercooled liquid         models attempt to take these two observations into account
at 0.9 TMCT , a range of temperatures where the dynamics                 by separating short scales (local packings, which determine
of liquids enters the activated regime. This indicates that              local yield stresses) from large scales, i.e., the requirement of

                                                                   033001-5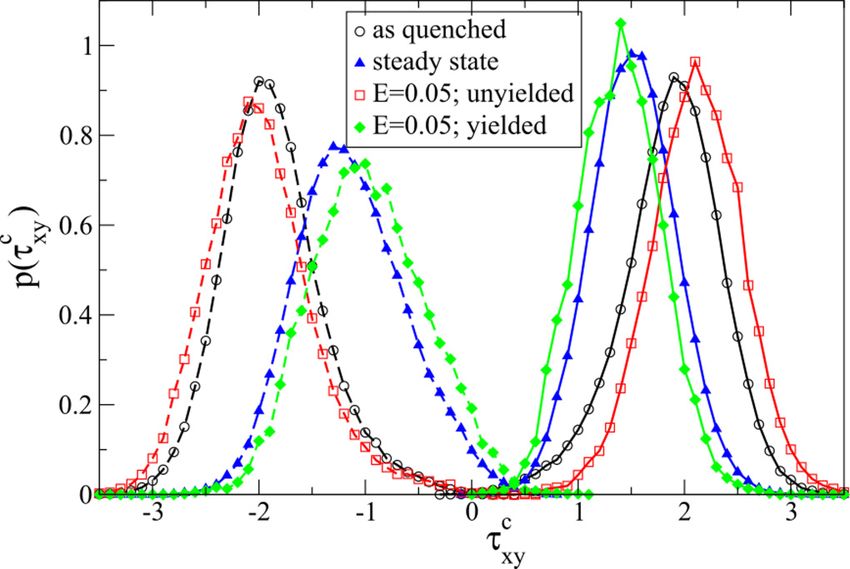
ARMAND BARBOT et al.                                                                         PHYSICAL REVIEW E 101, 033001 (2020)

mechanical balance which couples elastically local stress
levels. So, clearly, all mesoscopic models implement, of ne-
cessity, the same general script. Yet as soon as one looks at
any level of detail beyond these rough guidelines, there is a
flurry of such models and no consensus on the proper way to
define a reliable one.
    The problem is that, until now, as far as we know, no
direct observation had been made of local yield thresholds in
plastically deformed amorphous media. In the absence of such
an observation, it has always remained a question whether the
consideration of local yield thresholds was anything more that
a simplifying assumption. And the key assumption about the
effect of plasticity on local thresholds could only be build
on guesswork: For example, it has never been clear whether
it was meaningful to assume the existence of a well-defined
postyield yield stress distribution. And no test was available           FIG. 8. Inherent-state (IS) potential energy per atom as a func-
for the prediction of models concerning the dynamics of              tion of temperature in equilibrated liquids (gray circles) and in our
their core state variable: the distribution of these local yield     gradually quenched system (blue diamond). The green line is a fit of
stresses.                                                            the equilibrated liquid data. The fictive temperature Tf is estimated
    The present work, although it does not and cannot solve all      as that where the liquid IS energy extrapolates to that of the gradually
these issues, brings hope that they can be addressed rigorously      quenched system (see blue dotted lines).
in the near future. It will not alleviate the need to rely on
simplifying assumptions, and neither is it intended to provide
                                                                     out-of-equilibrium and disordered systems is encoded in their
a recipe for the construction of mesoscopic model—a still
                                                                     structure [45].
distant goal. But it probes the rejuvenation process of atomic-
                                                                        These observations illustrate the remarkable ability of our
scale yield stresses in a model glass undergoing deformation.
                                                                     tool to provide much-needed insights on the local mechanisms
Thus, it brings direct observations that strongly constrain
                                                                     of plasticity. We are convinced that a sustained exchange
both model assumptions, especially about the effect of re-
                                                                     between such numerical probes, which provide both input
juvenation, and model predictions concerning the dynamics
                                                                     and benchmarks, and the construction of mesoscopic models,
of local thresholds. Thanks to the focus on a system un-
                                                                     will be instrumental in the coming years for the advancement
dergoing shear banding, i.e., comprising quite different local
                                                                     of our fundamental understanding of amorphous plasticity.
packings, we could demonstrate that there was indeed a well-
                                                                     We only hope the present work is an early step along this
defined postyield yield stress distribution, quite insensitive
                                                                     promising route.
to the initial ensemble, and we could access it numerically.
This is evidently a key input for theories of amorphous
plasticity.                                                                               ACKNOWLEDGMENTS
    Moreover, we found that rejuvenation was an unexpectedly           M.L. and S.P. acknowledge the support of French National
rapid process, essentially requiring a single event to bring the     Research Agency through the JCJC project PAMPAS under
local packing to a well-defined softness level, comparable to        Grant No. ANR-17-CE30-0019-01.
that of an IS obtained from a supercooled liquid around TMCT .
This brings several important inputs to theories, specifically
                                                                          APPENDIX A: EFFECTIVE TEMPERATURE SCALES
concerning our understanding of shear banding in amorphous
systems. We showed indeed that the rejuvenation drop in                         1. Determination of the fictive temperature
yield stress causes the nucleation-like formation, immediately          The notion of fictive temperature T f is classically used to
after the first yield events, of regions of well-defined softness.   map a nonequilibrium glass state onto an equilibrium liquid.
The rapidity of this process, resulting from the intensity and       Following Ref. [46], the fictive temperature of our gradually
suddenness of rejuvenation softening, explains that, when            quenched glass is defined using the inherent state potential
starting from a well-relaxed glass, only a few plastic events        energy: Namely, T f is defined (see Fig. 8) as the temperature
suffice to locally erase the memory of the initial packing           at which the inherent potential energy of the glass equates that
and achieve a soft state, which precipitates the shear banding       of equilibrated liquids. We obtain T f = 0.291 ± 0.007.
instability. Also, the closeness of the postyield yield stress
distribution to that of a liquid around the crossover region hint
at the possibility to explain how the brittle-ductile transition            2. Determination of the mode-coupling temperature
depend on temperature, a very important practical issue.                  The mode-coupling temperature TMCT is determined from
    By providing access to a relevant internal variable that         a functional fit of the relaxation time τα in the dynamical
characterizes the local mechanical properties, this work opens       regime for different temperatures T [47,48]. We first compute
promising perspectives for describing nucleation and shear           the self-intermediate scattering function FL (q, t ) = cos(q ·
band dynamics in amorphous solids. It also establishes a             (r j (t ) − r j (0))), where the subscript L refers to the “large”
stimulating link between mechanical and thermal proper-              particles, r j (t ) is the position of the jth particle at time t, and
ties, a necessary step to explain how the history of these           . . .  denotes the average over j and the time origin. FL (q, t )

                                                               033001-6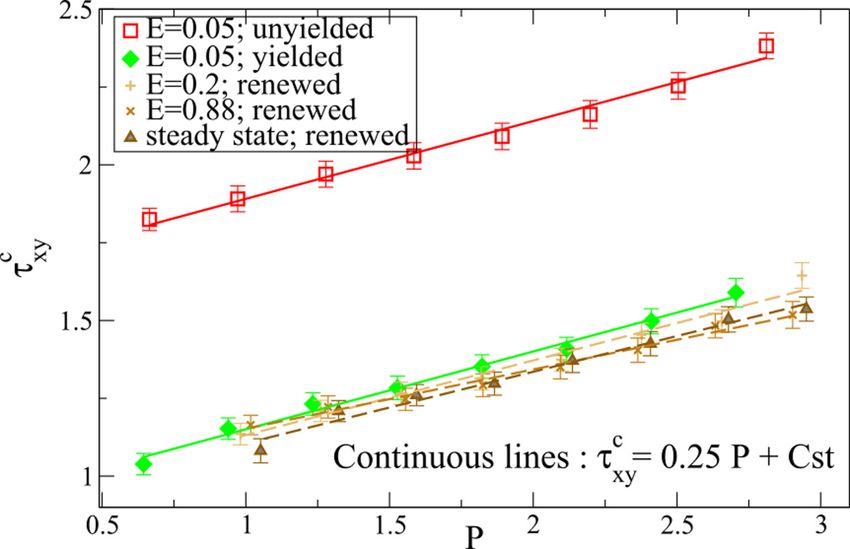
REJUVENATION AND SHEAR BANDING IN MODEL …                                                     PHYSICAL REVIEW E 101, 033001 (2020)

   FIG. 9. Relaxation time τα as a function of the equilibration
temperature. The red line is a power-law fit of the data points for
temperatures larger than 0.4. The vertical blue line represents the
location of estimated TMCT .

is averaged over 100 samples, containing 1024 atoms each,
for every temperature. We define the relaxation time τα as
FL (qSF , t = τα ) = 1e with |qSF | = 6.07 corresponding to the
primary peak of the static structure factor. As reported in
Fig. 9, τα , as computed for temperatures larger than 0.4, is
well fitted by the power-law relation τα ∝ (T − TMCT )γ . We
obtain γ = −0.818 ± 0.005 and TMCT = 0.373 ± 0.001.

             APPENDIX B: STRAIN MEASURES
            1. Hencky equivalent global shear-strain
   Our model glasses are deformed using AQS simple shear
loading up to linear strains γxy = 500%. The global strain
is characterized within the finite-strain theory by using a
Lagrangian description and choosing the Hencky’s logarith-
mic strain definition [49]. The advantages of proceeding in
such a way are threefold: It makes no use of small strain
approximation, it allows us to eliminate rotations, and it will
permit us to characterize macroscopic and microscopic strains
using comparable quantities.
   Given F as the deformation gradient, the logarithmic
                                                                          FIG. 10. Local averages computed along the shear direction x for
(Hencky) strain is E = ln(U), where U is the right stretch
                                                                      different strain levels E as a function of the vertical position y with
tensor, i.e., the unique symmetric and positive-definite tensor
                                                                      respect to the shear band position ySB : (a) density ρx , (b) shear
such that F = RU, with R a rotation. Since the right Cauchy-
                                                                      modulus in the loading direction Cxyxy x , (c) potential energy per
Green strain                                                          atom ex , and (d) pressure Px .
                           FT F = U 2                         (B1)

is positive definite, we may also write E = 21 ln(U2 ). More-                                                  2 2
                                                                      It eigenvalues are λ± = ( γ2 ± 1 + γ4 ) . Noting that
over, U2 can be diagonalized, i.e., written as U2 = P−1 DP
                                                                      λ+ λ− = 1, since det(U2 ) = 1, the square-root of the
with D diagonal and P the associated change of basis matrix.
                                                                      second tensor invariant of E, E ≡ 41 | ln(λ+ /λ− )| =
Finally, the invariants of E = P−1 ln(D)P are those of ln(D).
                                                                      ln ( γ2 + 1 + γ4 ). This is the quantity we refer to in the
                                                                                      2
   For two-dimensional simple shear deformation, the defor-
mation gradient is                                                    manuscript as the macroscopic Hencky strain.

                                1 γ
                         F=                               (B2)                           2. Local strain computation
                               0 1
                                                                         The procedure for computing local strain tensor in our
with γ the linear strain and the right Cauchy-Green strain
                                                                    atomic system is the same as that previously employed in
                             1       γ                                Refs. [22,30]. It relies on the evaluation of the local, coarse-
                     U =
                       2
                                          .               (B3)
                             γ 1 + γ2                                 grained, deformation gradient tensor F.

                                                                033001-7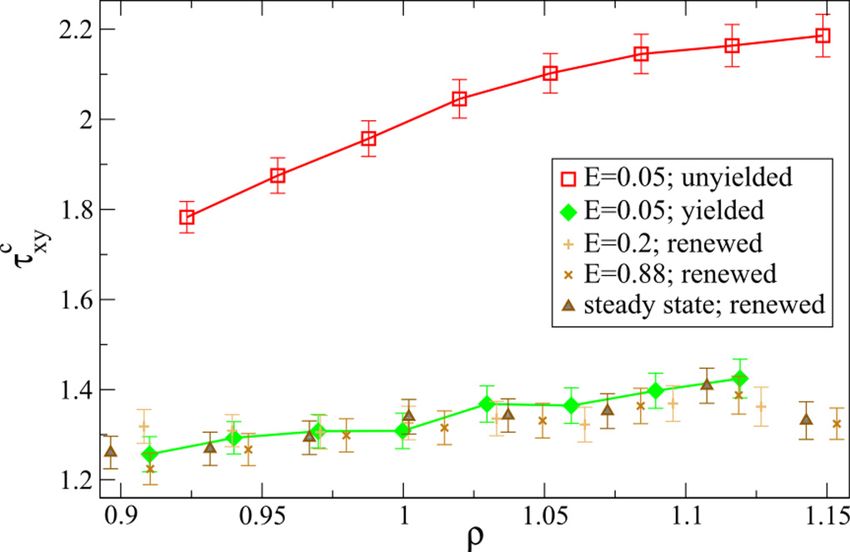
ARMAND BARBOT et al.                                                                         PHYSICAL REVIEW E 101, 033001 (2020)

                                                                       with

                                                                                n
                                                                                   αβ αβ   αβ
                                                                                                        n
                                                                                                           αβ αβ   αβ
                                                                        Yik =      xi Xk g r0 and Zik =    Xi Xk g r0 .
                                                                                β=1                              β=1
                                                                                                                                     (B8)
                                                                           This procedure is used to compute the strain gradient for
                                                                       each atom F between macroscopic configuration separated
                                                                       by small strain intervals γ = 0.01. For larger γ , F is nu-
                                                                       merically integrated by multiplying the deformation gradient
                                                                       tensors F = Fn Fn−1 · · · F2 F1 , where Fi is the deformation
                                                                       gradient tensors between states i and i + 1 separated by γ =
                                                                       0.01.
                                                                           The local strain is reduced to a scalar following the same
                                                                       procedure as for the global strain E , which involves the nu-
   FIG. 11. Local yield stress τxyc as conditioned by local pressure   merical diagonalization of each FT F. Finally, the atomic-level
P in yielded (green) and unyielded (red) regions at E = 0.05 and for   strain  is defined as the second tensor invariant of 21 ln(FT F).
renewed sites (shades of brown) at different macroscopic strains.          The  field is then evaluated on a square grid N 2 by
                                                                       assigning to each grid point the value computed for the closest
                                                                       corresponding atom. The regular grid lattice constant equals
   In continuum mechanics F relates the position in the ref-           to Rsampling = L/39 ≈ Rcut , where L is the dimension of the
erence (undeformed) configuration to the current (deformed)            initially square simulation box and Rcut = 2.5σ is the cutoff
configuration through the Cauchy-Born rule. For an atomic              interatomic potential. The grid deforms affinely with the
system under affine deformation this mapping relates the vec-          overall applied strain in simple shear. The local yield stresses
tors Xαβ and xαβ connecting atoms α and β in the reference             are computed on the same grid.
and current configurations (respectively) by
                                                                                      APPENDIX C: LOCAL PROPERTIES

                              xiαβ          αβ
                                 j = Fi j Xi j                 (B4)                    1. Profiles through the shear band
                                                                           In Fig. 10, we report the average profiles of density ρ,
with i and j coordinate components. Since local strains are            elastic modulus Cxyxy , potential energy per atom e, and pres-
not affine in general (particularly in glasses [50]) the previous      sure P for different macroscopic strain levels. As described in
formula will no longer be exact for each individual atom-              the manuscript, we restrict this analysis to samples featuring
neighbor pair.                                                         only horizontal shear bands. The profiles are centered on the
   For two configurations separated by a small macroscopic             shear band ordinate ySB , which is defined at that where the
strain interval, as proposed by Zimmerman et al. [51], we              x-averaged local strain is maximum for E = 0.1.
define the atomic-level deformation tensor Fiαj for atom α by              The values of ρx , Cxyxy x , and ex in the shear band and
minimizing the function                                                the outer medium are visibly contrasted: The accumulation
                                                                       of plastic rearrangements brings the system to a less dense,

                        n
                          2
                                                 2                 less rigid, and less stable state. Note, however, that all pro-
            Bα =            g r0αβ xiαβ − Fiαj X jαβ ,         (B5)    files eventually become homogeneous in the stationary flow
                        β=1 i=1                                        state.
                                                                           Because of the constant volume loading protocol, the aver-
where the sum runs over the n nearest neighbors of α and               age of ρ is by definition equal to the mean system density.
where g(r0αβ ) is a smooth weighting function that only de-            The local density in the band thus reaches transiently a
                                                                       minimum around E  0.05 before increasing again toward
pends on the distance r0αβ between atoms α and β in the refer-
                                                                       the mean density, its eventual value at large macroscopic
ence configuration [38]. Thus Fiαj is the best fit of Eq. (B4), in
                                                                       strains.
the least-squares sense, for an atom in its cage. We choose
                                                                           The evolution of the elastic moduli is somewhat curious.
for g an octic polynomial function [52]. This function has
                                                                       While it softens in the band, Cxyxy x presents an overall de-
a single maximum and continuously vanishes at a coarse-
                                                                       crease during the early stages of loading up to the peak stress.
graining length RCG = 5:
                                                                       This is expected since the approach to plastic instabilities
                                                                  reduces the macroscopic elastic modulus [18]. The moduli
                                    r 4             r 8
                  15
                         1−2               + for r < RCG   ,           in the outer, elastic region then rapidly rises as the stress
   g(r) =           2
                8πRCG              RCG             RCG
                0,                           otherwise.                decreases from its peak, presumably because the density of
                                                        (B6)           near threshold zone diminishes.
The minimization of Eq. (B5) with respect to Fα gives                      The presence and broadening of the shear band can also be
                                                                       detected by examining the increase in ex . This increase has

                                     2                                 already been observed in a very similar atomic system [13],
                            Fiαj =         Yik Z −1
                                                 jk ,          (B7)    where it has been interpreted as a rise in effective temperature
                                     k=1                               through shear-transformation-zone theory.

                                                                 033001-8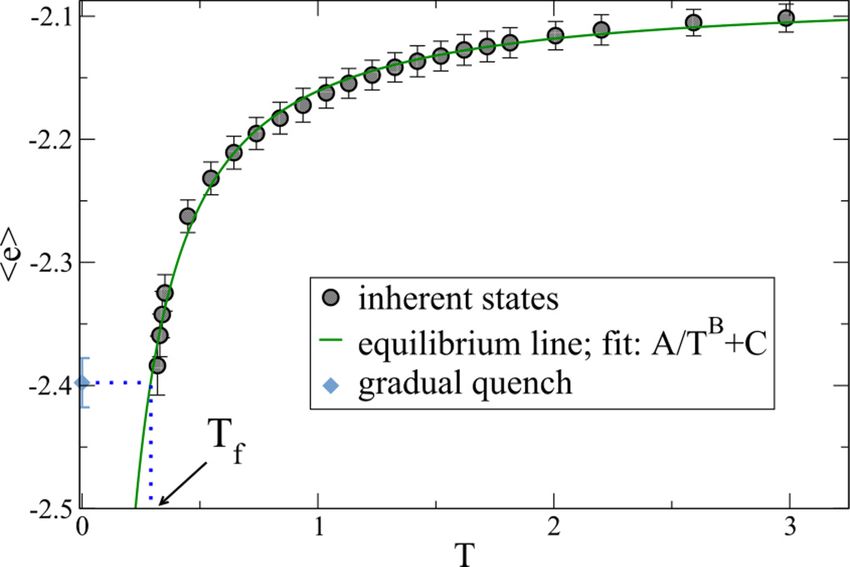
REJUVENATION AND SHEAR BANDING IN MODEL …                                                        PHYSICAL REVIEW E 101, 033001 (2020)

    It is interesting to note that the shear band position at            merely 10%. We therefore choose to adjust the slope on all
E = 0.1, which we take as reference, correlates with various             the data. We find an empirical relationship for yielded and
local properties of the quenched state. Note, finally, that if the       unyielded sites: τxyc
                                                                                                 = 0.25 P + A, where A is a constant.
global pressure increases with plastic deformation (see Fig. 1               Using the identified slope of the local relation between τxy
                                                                                                                                        c

in the manuscript), then it is almost homogeneous along these            vs. P, we can now take into account the effect of local pressure
average profiles due to mechanical equilibrium as reported in            and correct the data in Fig. 4(b) of the manuscript. We
Fig. 10(d).                                                              calculate the threshold distribution of unyielded sites at E =
                                                                         0.05 from the corresponding thresholds in the quenched state
                                                                         as τxy
                                                                              c
                                                                                = τxy
                                                                                    c
                                                                                       (E = 0|E = 0.05,  <  ∗ /8) + 0.25P, where
         2. Variation of local yield stresses with pressure              P is the variation of local pressure on given sites between
    We report in Fig. 11 the average of τxy  c
                                                 as a function of       E = 0 and E = 0.05. The corrected curves [green triangles in
the local pressure P in the yielded and nonyielded regions               Fig. 4(b) in the manuscript] quantitatively reproduce the dis-
at E = 0.05 and for renewed states (see manuscript) for                  tributions τxy
                                                                                      c
                                                                                         of unyielded sites at E = 0.05. This establishes
different macroscopic strains. This plot clearly shows that, at          that changes in the local yield stress for small deformations,
the same P, unyielded and yielded regions present different              mainly outside of the band, can be attributed both to the
yield stresses. Moreover, in either ensemble, the local yield            depletion of weak sites and, in the case of constant volume
stress increases nearly linearly with local pressure. This result        simulations, to the increase in local pressure.
is in agreement with the variation of the yield surface obtained             The relation between τxy  c
                                                                                                           and P for the renewed states
numerically for a metallic glass in Ref. [53], where pressure            at different macroscopic strains still shows a nearly linear
or normal stress give results intrinsically similar to a Mohr-           dependency. It, however, slightly deviates from the relation
Coulomb criterion. The slopes of the τxy  c
                                              relations differ by       found for the yielded sites at E = 0.05.

 [1] A. Greer, Y. Cheng, and E. Ma, Mater. Sci. Eng. R Rep. 74, 71       [20] A. Lemaître and C. Caroli, Phys. Rev. E 76, 036104 (2007).
     (2013).                                                             [21] M. Tsamados, A. Tanguy, C. Goldenberg, and J.-L. Barrat,
 [2] A. Le Bouil, A. Amon, S. McNamara, and J. Crassous, Phys.                Phys. Rev. E 80, 026112 (2009).
     Rev. Lett. 112, 246001 (2014).                                      [22] S. Patinet, D. Vandembroucq, and M. L. Falk, Phys. Rev. Lett.
 [3] C. Pampillo and H. Chen, Mater. Sci. Eng. 13, 181 (1974).                117, 045501 (2016).
 [4] J. J. Lewandowski and A. L. Greer, Nature Mat. 5, 15                [23] B. Tyukodi, S. Patinet, S. Roux, and D. Vandembroucq, Phys.
     (2006).                                                                  Rev. E 93, 063005 (2016).
 [5] C. A. Schuh, T. C. Hufnagel, and U. Ramamurty, Acta. Mater.         [24] A. Nicolas, E. E. Ferrero, K. Martens, and J.-L. Barrat, Rev.
     55, 4067 (2007).                                                         Mod. Phys. 90, 045006 (2018).
 [6] K. Martens, L. Bocquet, and J.-L. Barrat, Soft Matter 8, 4197       [25] D. Vandembroucq and S. Roux, Phys. Rev. B 84, 134210
     (2012).                                                                  (2011).
 [7] S. V. Ketov and D. V. Louzguine-Luzgin, Sci. Rep. 3, 2798           [26] D. Tüzes, P. D. Ispánovity, and M. Zaiser, Int. J. Fract. 205, 139
     (2013).                                                                  (2017).
 [8] A. Nicolas, J.-L. Barrat, and J. Rottler, Phys. Rev. Lett. 116,     [27] D. F. Castellanos and M. Zaiser, Phys. Rev. Lett. 121, 125501
     058303 (2016).                                                           (2018).
 [9] F. Spaepen, Acta Metall. 25, 407 (1977).                            [28] M. Popovic, T. W. J. de Geus, and M. Wyart, Phys. Rev. E 98,
[10] P. Sollich, F. Lequeux, P. Hébraud, and M. E. Cates, Phys. Rev.          040901(R) (2018).
     Lett. 78, 2020 (1997).                                              [29] F. Puosi, J. Olivier, and K. Martens, Soft Matter 11, 7639
[11] M. L. Falk and J. S. Langer, Phys. Rev. E 57, 7192 (1998).               (2015).
[12] M. L. Manning, J. S. Langer, and J. M. Carlson, Phys. Rev. E        [30] A. Barbot, M. Lerbinger, A. Hernandez-Garcia, R. García-
     76, 056106 (2007).                                                       García, M. L. Falk, D. Vandembroucq, and S. Patinet, Phys.
[13] Y. Shi, M. B. Katz, H. Li, and M. L. Falk, Phys. Rev. Lett. 98,          Rev. E 97, 033001 (2018).
     185505 (2007).                                                      [31] S. Patinet, A. Barbot, M. Lerbinger, D. Vandembroucq, and A.
[14] Y. Sun, A. Concustell, and A. L. Greer, Nat. Rev. Mater. 1,              Lemaître, arXiv:1906.09818.
     16039 (2016).                                                       [32] M. Ozawa, L. Berthier, G. Biroli, A. Rosso, and G. Tarjus, Proc.
[15] Y. Tong, W. Dmowski, H. Bei, Y. Yokoyama, and T. Egami,                  Natl. Acad. Sci. USA 115, 6656 (2018).
     Acta Mater. 148, 384 (2018).                                        [33] C. E. Maloney and A. Lemaître, Phys. Rev. E 74, 016118
[16] H. Mecking and U. F. Kocks, Acta Metall. 29, 1865                        (2006).
     (1981).                                                             [34] M. Utz, P. G. Debenedetti, and F. H. Stillinger, Phys. Rev. Lett.
[17] J. Ding, S. Patinet, M. L. Falk, Y. Cheng, and E. Ma, Proc. Natl.        84, 1471 (2000).
     Acad. Sci. USA 111, 14052 (2014).                                   [35] J. R. Rice, in Theoretical and Applied Mechanics: Proceed-
[18] C. Maloney and A. Lemaître, Phys. Rev. Lett. 93, 195501                  ings of the 14th International Congress on Theoretical and
     (2004).                                                                  Applied Mechanics, Delft, 1976, edited by W. T. Koiter,
[19] A. Tanguy, F. Leonforte, and J.-L. Barrat, Eur. Phys. J. E 20,           Vol. 1 (North Holland Publishing Co., Amsterdam, 1976),
     355 (2006).                                                              pp. 207–220.

                                                                   033001-9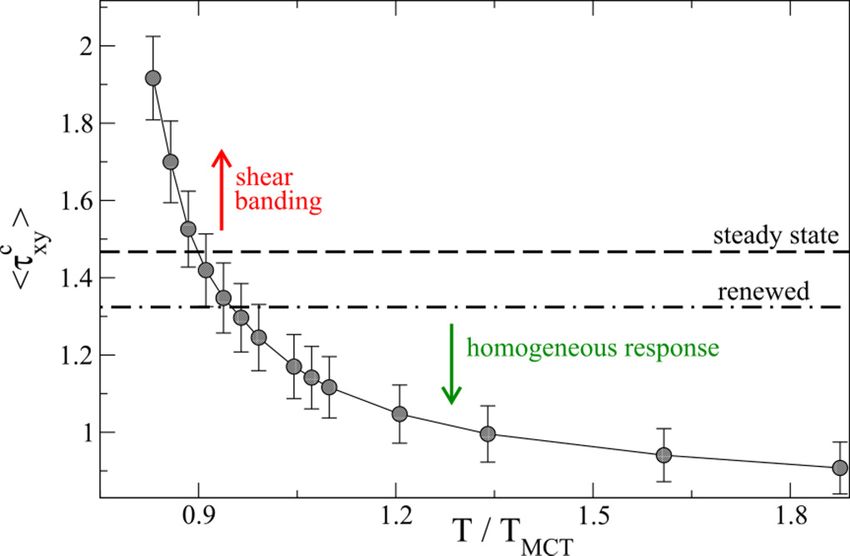
ARMAND BARBOT et al.                                                                            PHYSICAL REVIEW E 101, 033001 (2020)

[36] D. D. Alix-Williams and M. L. Falk, Phys. Rev. E 98, 053002        [45] N. C. Keim, J. Paulsen, Z. Zeravcic, S. Sastry, and S. R. Nagel,
     (2018).                                                                 Rev. Mod. Phys. 91, 035002 (2019).
[37] J. Pan, Q. Chen, L. Liu, and Y. Li, Acta Mater. 59, 5146 (2011).   [46] C. Liu, P. Guan, and Y. Fan, Acta Mater. 161, 295 (2018).
[38] A. R. Hinkle, C. H. Rycroft, M. D. Shields, and M. L. Falk,        [47] T. B. Schrøder, S. Sastry, J. C. Dyre, and S. C. Glotzer, J. Chem.
     Phys. Rev. E 95, 053001 (2017).                                         Phys. 112, 9834 (2000).
[39] J.-C. Baret, D. Vandembroucq, and S. Roux, Phys. Rev. Lett.        [48] A. Cavagna, Phys. Rep. 476, 51 (2009).
     89, 195506 (2002).                                                 [49] P. Neff, B. Eidel, and R. Martin, arXiv:1402.4027.
[40] J. P. Bouchaud, J. Phys. I France 2, 1705 (1992).                  [50] S. Saw, S. Abraham, and P. Harrowell, Phys. Rev. E 94, 022606
[41] P. Hébraud and F. Lequeux, Phys. Rev. Lett. 81, 2934 (1998).            (2016).
[42] W.-T. Yeh, M. Ozawa, K. Miyazaki, T. Kawasaki, and L.              [51] J. A. Zimmerman, D. J. Bammann, and H. Gao, Inter. J. Sol.
     Berthier, arXiv:1911.12951.                                             Struct. 46, 238 (2009).
[43] H. Bhaumik, G. Foffi, and S. Sastry, arXiv:1911.12957.             [52] A. Lemaître, Phys. Rev. Lett. 113, 245702 (2014).
[44] V. V. Bulatov and A. S. Argon, Modell. Simul. Mater. Sci. Eng.     [53] A. C. Lund and C. A. Schuh, Acta Mater. 51, 5399
     2, 167 (1994).                                                          (2003).

                                                                  033001-10
You can also read