Local Government and Housing Committee Response
←
→
Page content transcription
If your browser does not render page correctly, please read the page content below
SSP 44
Ymgynghoriad ar flaenoriaethau'r Pwyllgor Llywodraeth Leol a Thai
ar gyfer y Chweched Senedd
Consultation on the Local Government and Housing Committee's
priorities for the Sixth Senedd
Ymateb gan: Sefydliad Bevan
Response from: Bevan Foundation

Local Government and Housing Committee Response
The Bevan Foundation is Wales’ most influential think-tank. We aim to end poverty and inequality by
working with people to find effective solutions and by inspiring governments, organisations and
communities to take action. We are grateful for the opportunity to respond to the Local Government
and Housing Committee’s consultation on the Committee’s priorities. Our submission draws on our
extensive work on housing, poverty and inequality. We have limited our response to three
suggestions given that we believe that these are the most pressing issues facing local government
and housing from a poverty and inequality perspective today.

1. Better housing for people on low incomes
Everyone in Wales deserves to live in a warm and secure home, but for too many people on low
incomes this is not possible.

A lack of affordable housing pushes thousands of Welsh households into poverty, whilst others are
pushed into homelessness. Many people on low incomes are forced to live in poor quality housing,
increasing their risk of living in fuel poverty and having an impact on their health. Those who live in
the private rented sector often lack housing security, with others forced to move from their
community to find an affordable home. There are major challenges facing both the social and private
rented sector.

In the private rented sector, new research, soon to be published by the Bevan Foundation highlights
that the LHA rate only covered the full, advertised rent of 4.8 per cent of properties on the market
across 10 Welsh local authorities over the summer of 2021. 1 Research published by the Joseph
Rowntree Foundation on the other hand has highlighted how increases to social rent have pushed
40,000 social renters into poverty. 2

The impact of the pandemic is likely to have worsened this situation. The Bevan Foundation’s A
snapshot of poverty in spring 2021 report highlighted that 80,000 Welsh households have either
already lost their home or have been notified that they will lose their home. 3 With protections from
eviction having come to an end, alongside the unwinding of furlough and the cut to Universal Credit
there are concerns that this situation could worsen further.

We believe that the committee should undertake an inquiry into how the housing system in Wales
could be improved to ensure that low income households have access to warm, secure and
affordable housing in both the social and private rental sectors.

1
  See copy attached
2
  Joseph Rowntree Foundation, Briefing: Poverty in Wales 2020 (2 November 2021) available at -
https://www.jrf.org.uk/report/poverty-wales-2020
3
  Bevan Foundation, A snapshot of poverty in spring 2021 (July 2021) available at -
https://www.bevanfoundation.org/resources/poverty-in-spring-2021/
2. Review progress of work on Welsh Benefits
The Benefits in Wales: options for better delivery report published by the Equality, Local Government
and Communities Committee during the last Senedd demonstrated the significant role that local
authorities can play in solving poverty. We were delighted to see the recommendations made to
develop a Welsh Benefits System and understand that the Welsh Government are making some
progress in this work.

Given the significant role we believe the implementation of a Welsh Benefits System could play in
solving poverty, we believe that the time is right for an updated inquiry into the role of benefits in
Wales. We believe that this inquiry should focus on what progress has been made in implementing
the recommendations of the Equality, Local Government and Communities Committee, and what
further action may now be necessary given the economic impact of the pandemic.

3. Council Tax and the Council Tax Reduction Scheme
Council Tax is a major additional cost for households. Our estimates suggests that Council Tax
typically adds 33 – 50 per cent of rent to a household’s housing costs. This cost has increased
significantly over recent years due to changes in local government finance, squeezing families who
were already finding money tight. The challenges faced by low-income household are exacerbated
by the limitations of the Council Tax Reduction Scheme (CTRS).

As you will know CTRS provides people from low-income households with a discount on their Council
Tax, or exempts some households from having to pay any Council Tax at all. Strict eligibility criteria
mean that thousands of low-income households are not eligible for CTRS, however, despite living in
poverty as their income is not deemed low enough. On top of this, even where households are
eligible for CTRS, take-up is substantially below expected levels and is decreasing as households
receiving Universal Credit are not ‘passported’ to CTRS. This leaves families in real hardship and
sometimes in arrears.

This issue has been exacerbated by the pandemic. Council Tax arrears have increased by 42.1 per
cent between 2019/20 and 2020/21 to £160 million. 4 Council Tax arrears do not only present a
challenge for local authorities but also has a detrimental impact on those who have fallen into
arrears. Seven in ten people who have fallen behind on their Council Tax report that they have fallen
behind on another bill whilst one in three report not having enough money to afford to buy food and
other day to day essentials. 5

We believe that an inquiry undertaken by your committee could allow us to gain a better
understanding of the issues within the current system and to develop solutions that could have a
positive impact on people’s lives and improve local government financing.

4
  Welsh Government, Council Tax Collection Rates in Wales: 2020-21 (July 2021) available at -
https://gov.wales/sites/default/files/statistics-and-research/2021-07/council-tax-collection-rates-april-2020-
march-2021-928.pdf
5
  Citizens Advice, Helping to ensure a fairer Council Tax system in Wales (March 2021) available at
https://www.citizensadvice.org.uk/Global/CitizensAdvice/Wales/Wales%20Policy%20and%20Campaigns/Coun
cil%20Tax%20Briefing%20Manifesto%20(1).pdf
0
About the Bevan Foundation
The Bevan Foundation is most innovative and influential think tank. We
develop lasting solutions to poverty and inequality.
Our vision is for Wales to be a nation where everyone has a decent standard of
living, a healthy and fulfilled life, and a voice in the decisions that affect them.
As an independent, registered charity, the Bevan Foundation relies on the
generosity of individuals and organisations for its work.
Acknowledgements
This document forms part of a broader project
of work developed in collaboration between
the Bevan Foundation and the Lloyds Bank
Foundation. The Bevan Foundation would like
to thank the Lloyds Bank Foundation for their
ongoing support.
How you can help
Hundreds of people and organisations across Wales enable the Bevan Foundation
to speak out against poverty, inequality and injustice. We would not exist without
their support.
To make Wales a nation of prosperity for all, where everyone can fulfil their
potential no matter who they are or where they live, please join our community of
supporters.
Your support and that of others makes a difference to us and a difference to
Wales.
Find out more at https://www.bevanfoundation.org/support-us/individuals/ or
email info@bevanfoundation.org to find out what you can do
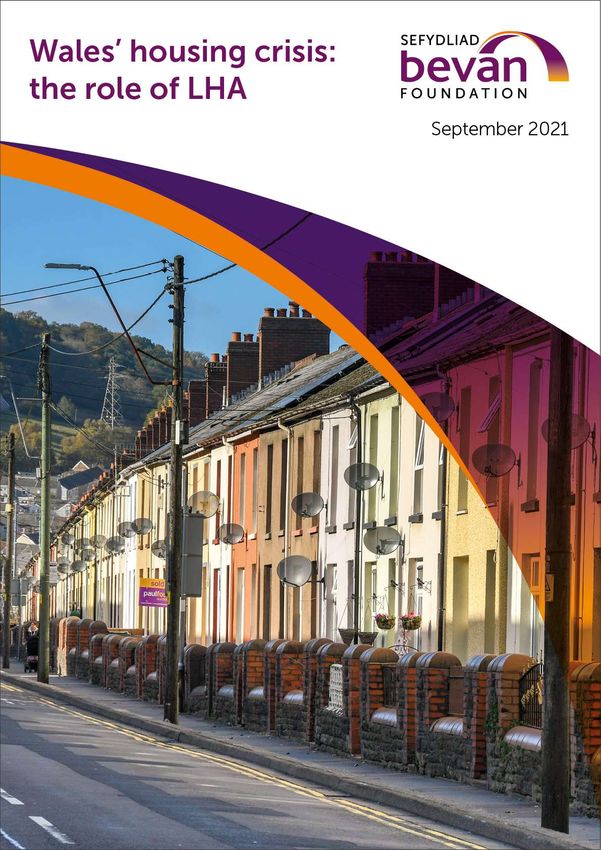
Cover photo: Stock image from Alamy
Copyright Bevan Foundation
Bevan Foundation, 145a High Street, Merthyr Tydfil CF47 8DP
info@bevanfoundation.org www.bevanfoundation.org
Registered charity no. 1104191 Company registered in Wales no. 4175018Contents
Summary ............................................................................................................................................... 1
1. Introduction .................................................................................................................................. 2
2. Understanding LHA ..................................................................................................................... 3
2.1 An overview of LHA ................................................................................................................... 3
2.2 Broad Rental Market Areas ...................................................................................................... 3
2.3 Calculating the LHA ..................................................................................................................4
2.4 Timeline of the LHA ..................................................................................................................4
2.5 Discretionary Housing Payments ........................................................................................... 5
3. Methodology ................................................................................................................................6
4. Issues with the LHA ..................................................................................................................... 7
4.1 The LHA gap ............................................................................................................................... 7
5. Explaining the shortfall ............................................................................................................. 12
5.1 The LHA freeze ........................................................................................................................ 12
5.2 Calculation of LHA .................................................................................................................. 12
5.3 Setting the LHA at the 30th percentile ................................................................................. 13
6. Landlord requirements ............................................................................................................. 15
6.1 Barriers to renting.................................................................................................................... 15
................................................................................................................ 16
7. Quality and Security .................................................................................................................. 19
7.1 Security of tenure .................................................................................................................... 19
7.2 Quality of accommodation ................................................................................................... 19
7.3 Other findings ......................................................................................................................... 20
8. Conclusions ................................................................................................................................ 21
Annex 1. LHA rates for Apr 2020 - Mar 2021 (£ per week) ................................................... 22
Annex 2. List of BRMAs ................................................................................................................ 23
Annex 3. Gap between LHA rates and officially recorded 30th percentile (£ per week) . 24
References ......................................................................................................................................... 25Summary
Everyone has a right to have access to a warm and secure home. However, over 30,000
households sought assistance from local authority homeless services in 2019/20 alone,
whilst thousands more are trapped in unsuitable or insecure housing. There are many
reasons why the housing system fails so many people in Wales, with a key factor being
the weaknesses of the social security system. This report focuses on one of these
weaknesses the design of Local Housing Allowance (LHA).
Local Housing Allowance is used to calculate the maximum amount people renting from
a private landlord can claim in Housing Benefit or Universal Credit. The maximum rent is
based on where someone lives, the number of bedrooms they are deemed to need, and
the rent paid. It is designed to allow a tenant to rent in the cheapest 30 per cent of
properties in a defined area.
Our research has found that the LHA rate only covers the full, advertised rent of 4.8
per cent of properties on the market. On average, there is a gap of £133.53 a month
between the LHA rate and the 30th percentile of advertised rents for shared
accommodation. The gap is even larger for bigger properties, with a gap of £308.71 for
four-bedroom homes. The size of the shortfall pushes some households into financial
hardship, leads others to rent inadequate housing and excludes some from accessing
housing completely, contributing to homelessness and housing insecurity.
The problem is exacerbated by the actions of some landlords. Some landlords require
tenants to have multiple references, raise large deposits or meet minimum income
requirements. These requirements effectively prevent people in receipt of Housing Benefit
or the housing element of Universal Credit from renting the property. When
accommodation with additional requirements is excluded, only 2.7 per cent of homes
that were advertised on the market this summer had rents below LHA and were available
to claimants. Our estimates are based on requirements that were listed in property
adverts there could well have been requirements that were not specified in the advert,
reducing availability even further.
There are numerous locations in Wales where there was no housing available on the
market for people in receipt of Housing Benefit or the housing element of Universal
Credit for which rents were covered in full by LHA.
There are concerns that the situation could deteriorate over the coming months. The UK
to freeze the LHA rate at 2020/21 levels is likely to contribute to a
greater gap between rents and the LHA maximum. This report identifies some interim
solutions to the looming crisis. We will continue our work in this area over the autumn to
develop more robust and long-term solutions. It is vital that both the UK and Welsh
Governments also plan to take action.1. Introduction In recent years housing insecurity has become a more prominent problem in Wales. Between 2015 and 2020 there was a 40 per cent increase in the number of people presenting themselves to homeless services.1 Over the same period, the number of people rough-sleeping more than doubled.2 This does not represent the full extent of housing insecurity in Wales since other forms of housing insecurity, such as the number of people who are issued with eviction notices, who are forced to sofa surf or who fall behind on their rent in the private rental sector (PRS), is not recorded. While there are many reasons for the increase in housing insecurity, one factor is the reforms made to the social security system. These reforms have been numerous, ranging from freezing the value of social security payments to the introduction of the five-week wait for Universal Credit. One key reform has been the changes made to the Local Housing Allowance (LHA). The LHA determines the maximum contribution of the social security system to the rental costs of low-income households living in the PRS. The amount varies depending on the area in which a property is situated, while the amount a household receives varies depending on its composition and income. Successive reforms to the LHA have reduced the value of LHA in real terms. This along with other weaknesses within the LHA system has led to a widening gap between LHA rates and rents charged by landlords. The gap between LHA and rents is widely recognised to strain household budgets, push people into rent arrears, prevent people from finding accommodation and trap people in a cycle of insecure housing and even homelessness. The impact of the reforms to LHA in Wales is exacerbated by the housing system itself. A shortage of shared accommodation, for example, means that there simply are not enough homes available on the market for single people aged under 35 years who need help with their rent. High local rents mean that LHA rates are often lower than the rents charged by landlords, even where there is sufficient stock. And landlord practices such as requirements for deposits and affordability checks can prevent people who are in receipt of Housing Benefit or the housing element of Universal Credit from accessing the rental market even where the amount calculated by the LHA is enough to cover the rent in full Covid-19 has heightened these challenges. The loss of many informal support networks under greater strain despite the existence of temporary protections such as the ban on evictions and the increase in LHA rates. With many of these temporary protections either already lifted or due to be lifted shortly and with a buoyant housing market, there are concerns that the situation may deteriorate in the near future. This report explores the levels of LHA and the advertised rents of properties in Wales, as part of a larger project on the relationship between LHA and homelessness. While there has been some research on the impacts of welfare reform on people in Wales, there is very little specifically on the changes to the LHA. This report starts with by setting out the timeline of reforms to LHA and summarises how the LHA works and how it is calculated. It then explains the methodology we have used to capture data on advertised rents, before going on to highlight our findings on the relationship between LHA and advertised rents. We then consider some of the other requirements set by landlords that may prevent people from renting and finally consider issues of housing quality and security.
2. Understanding LHA
This section will set out in greater detail what is LHA, how the rates are calculated, and the
additional support that is provided for renters. More detailed information on how the LHA
is calculated can be found in the Rent Officers (Housing Benefit Functions) Order 1997.3

2.1 An overview of LHA
The LHA is the mechanism used to calculate the amount of Housing Benefit or housing
element of Universal Credit that someone renting in the PRS is entitled to.

LHA rates depend on two key factors. First, they depend on
including the number of bedrooms and where it is located. An LHA is set at the 30th
percentile of rents for different types of accommodation in a given area (called Broad
Rental Market Areas). Annex 1 includes the 2020/21 LHA rates for shared
accommodation, 1-bedroom, 2-bedroom, 3-bedroom, and four-bedroom properties for
each BRMA. The variation in local rents can be seen, with the lowest shared
accommodation rate being in Brecon and Radnor at £52.50 a week while the highest is in
Newport and Monmouthshire at £75.95 a week.

Second LHA rates                                             . The age of the claimant and
the number of people they live with, including the number, age and gender of any
dependents, sets the maximum number of bedrooms to which they are entitled, which in
turn determines their LHA rate.4 As an indication, a single adult aged under 35 years old
and with no dependents living with them is only eligible to claim the shared
accommodation rate unless they satisfy grounds for exemption.5

The LHA is part of the set of benefits that are subject to the benefit cap, which limits the
amount of social security benefits that that a household can receive. A household subject
to the benefit cap may therefore receive less than the LHA rate if their total benefit
entitlement exceeds the cap.

As social security is not devolved to the Welsh Parliament, the LHA rates, the designation
of BRMAs, and other factors relating to the LHA are reserved to the UK Government and
are the responsibility of the Department of Work and Pensions.

2.2 Broad Rental Market Areas
Rents vary considerably across Wales, so to reflect this different rates are set for areas
with broadly similar market conditions, called Broad Rental Market Areas (BRMAs). Wales
has 23 Broad Rental Market Areas, which are set by the Department of Work and
Pensions. When determining the boundaries, the DWP must ensure residential properties
within an area have adequate access to: 6

   •   health care
   •   education
   •   recreation
   •   banking
   •   shopping

The DWP must consider access to these amenities, ensuring that a BRMA offers
reasonable access to them by both public and private transport. There is a legislative
requirement to consider both the distance of travel and the time taken to travel. If
journeys take an unreasonable length of time, it is likely that an area is too large.

Roughly half of the BRMAs share the same borders as their respective local authorities.
Larger and more rural areas, or areas with geographical features that prevent easy travel,
are often split into multiple BRMAs. In total there are eleven BRMAs that either cover
multiple local authority areas or only cover a part of a local authority area (see Annex 2 for
details). One BRMA, the West Cheshire BRMA, straddles the England and Wales border.

2.3 Calculating the LHA
LHA rates are calculated by Rent Officers, a group of Welsh Government staff who work
to DWP guidance on LHA matters. To calculate the LHA rate for each BRMA in Wales,
Rent Officers must first collect data on the actual rent for one-bedroom, two-bedroom,
three-bedroom, four-bedroom properties and for shared accommodation in each area.
There is a requirement for the Rent Officers to collect data on 20 per cent of all PRS
dwellings of each accommodation type within a BRMA to constitute an adequate sample
size. In the case that they fail to locate enough dwellings, they are allowed to use data
from similar areas within other BRMAs and include it in their sample.

Rent officers are also allowed to exclude some properties from their sample. The Rent
                                                                the rent officer shall
                                                    antly higher that the rent which the
landlord might have been expected to obtain     7
                                                    This rent is then excluded from the
overall dataset.

There are further restrictions on the types of accommodation may be included in a
sample. If a property has someone residing in it who is already in receipt of Housing
Benefit or housing element of Universal Credit, the property will be excluded from the
                                                                                 attributable
to the provision of services   8

Using the data from the sample, rent officers then calculate the rent at the 30th percentile
using a formula.9 This then normally sets the maximum level of Housing Benefit or
housing element of Universal Credit that a household is entitled to receive, unless rates
have been frozen by the UK Government.

2.4 Timeline of the LHA
The LHA was first introduced in 2008 as a reform to the way in which Housing Benefit
entitlement was calculated for someone living in the PRS. When it was rolled out, it was
set at the median rent for an area.10

Numerous reforms were introduced in 2011 that reduced the value of LHA and changed
eligibility. Most notable among these changes was the reduction of the LHA to the 30 th
percentile of rents in a BRMA, rather than at the median. In addition, there were caps on
LHA depending on the size of a property, with the five-bedroom rate being scrapped. The
age below which people were expected to share accommodation was raised from 25 to
35 and the number of bedrooms to which a household is entitled was specified. In
addition, increases to LHA were in line with the Consumer Price Index, rather than
following the 30th percentile of rents.11

A further decline in the support provided was introduced in 2016, when it was announced
that the LHA would be frozen for four years. It was also planned that 30 per cent of the
money saved would be used for Targeted Affordability Funding to support areas where
higher rent increases resulted in a larger gap between the market and the money
provided by the LHA.12
This decision to freeze the LHA was made despite the rising costs of private rentals and
concerns that LHA rates would become increasingly divorced from actual rent levels.
There were worries that this would lead to a gap between the value of LHA and actual
rent levels, making it harder for tenants to access private rented housing. This in turn was
expected to result in an increase in homelessness.13
In 2020, the level of LHA was restored to the 30th percentile of rents in that year14,
enabling it to recover from the CPI cap and subsequent freeze. However, in late 2020 it
was announced that the LHA rate would not be uprated for 2021/22, in effect freezing its
value once again.15
The reforms to LHA were only one part of a broader programme of reforms of the social
security system. Among the most important other reforms that took place over this period
was the introduction of Universal Credit and the subsequent freeze on the value of
Universal Credit payments. The introduction of Universal Credit also brought with it a
five-week-wait for a first payment. Other changes included the introduction of the benefit
cap and the two-child limit on Universal Credit claims, which have particularly affected
larger families. All these reforms combined have affected households afford a
16
good quality home in the PRS.
2.5 Discretionary Housing Payments
Discretionary Housing Payments (DHPs) serve as an additional payment for people in the
PRS. The payment can be used to cover a rent shortfall, to fund a deposit on a rental
property and, in some circumstances, to cover rent arrears. It is designed primarily to act
as a form of short-term relief and can only be accessed by those receiving Housing
Benefit or the housing element of Universal Credit.17
While funding and the general uses of DHPs are set by the UK government, DHPs are
awarded by local authorities which means that there can be local variation.18 Although the
fund is not devolved, the Welsh Government can provide a top up fund to local
authorities,19 which can spend up to two and a half times their allocated budget on
DHPs.20
In 2015 the Senedd Public Accounts Committee heard that DHPs are often inflexible,
unsustainable, and the quality of its administration varies between local authorities.21
Additionally, there are questions regarding how DHP funding is allocated to local
authorities. The formula that the DWP uses to allocate funding means that local
authorities that spend more on Housing Benefit receive larger allocations than others.22
There are some inconsistencies and weaknesses in the administration of DHP payments,
with the majority of local authorities not having a clear DHP policy or guide available to
the public.23 The consequence is that each local authority has a different approach to
administering and determining the outcome of applications.24 The weaknesses of the
DHP system compounds the difficulties faced by households who struggle to access a
good quality housing as a result of the LHA system.3. Methodology The findings in this briefing are based on the initial results of both qualitative and quantitative research undertaken between March and August 2021. This briefing is primarily based on two sources of data. The first source is interviews with officers at eight Welsh local authorities. Interviews were conducted with officials working within the homelessness and housing departments in Cardiff, Rhondda Cynon Taf, Flintshire, Gwynedd, Pembrokeshire, Merthyr Tydfil, Conwy, and Torfaen local authorities. The interviews were semi-structured and undertaken to understand both a set of common themes across multiple local authorities, and to identify whether there were any authorities facing unique, local pressures. The second source was advertised rents of available private rental properties between May and July 2021. Data was gathered about a total of 3,715 accommodation units in Cardiff, Swansea, Rhondda Cynon Taf, Flintshire, Denbighshire, Conwy, Gwynedd, Pembrokeshire, Merthyr Tydfil and Torfaen. These areas were selected to be a cross- section of rural, urban, coastal and valley areas within Wales. For the purpose of this report, we will be presenting data at a local authority level, rather than for each BRMA, because BMRAs are not a geographic entity used in other policy areas. Looking at the local authority level therefore makes it easier to discuss solutions more holistically. In local authority areas where there was more than one BRMA we have taken the mid- point between the differing LHA rates and used this to calculate the gap. Whether the data is analysed at local authority or BRMA area makes little difference to the final set of results produced. Our analysis of the data at BRMA level is available on request. We collected data on the rent being asked in property advertisements as well as any other landlord requirements such as references and deposits, and any indicators of the quality of accommodation. Data was collected primarily from Rightmove.com and Spareroom.com, with some data also collected from informal sources like Facebook and Gumtree. The data we have obtained is the advertised rent asked for a property: the final agreed-upon rent may differ. This is an important distinction as LHA levels are set based on agreed rents rather than advertised rents. We aimed to collect enough data to distinguish between the formal market, being properties advertised by landlords or letting agents on property websites, and the informal market, where properties were advertised on, for example, Facebook and Gumtree. While we were able to find some adverts from the informal market, we were unable to collect sufficient data to effectively analyse it as a separate entity. Further, we are also unable to include properties let via word of mouth, despite the likely size of this market. As such, our data largely reflects formal market trends. In addition, we were unable to collect data on rental properties that are already being let out. As such, the analysis below represents the situation faced by someone if they were to search for accommodation during May and August 2021. Of the initial 3,715 advertised properties, roughly a quarter was student accommodation. These properties were predominately in Gwynedd, Cardiff, Swansea, and Rhondda Cynon Taf. Subsequent analysis excludes student accommodation as it is not typically available to the general public and is not included in the LHA calculations. We therefore analysed data on a total of 2,853 properties.
4. Issues with the LHA
The numerous reforms made to the LHA have resulted in the support provided by the
social security system towards housing costs in the PRS becoming increasingly
inadequate.

There is now an established body of evidence that demonstratesd that a gap has
developed between the LHA rate and rental prices at the 30th percentile. For example, a
2021 report found that in 2019/20 the gap between LHA rates and rental prices at the
30th percentile stood at £6.94 per week in 2019/2020, up from £2.04 per week in
2016/17.25 This shortfall has put households under greater financial pressure and is an
important driver of housing insecurity and homelessness in Wales.26

This section will set out the extent of the gap that has developed between the LHA rate
and homes that were available on the rental market in ten local authorities over the
summer of 2021. There are two main reasons for doing so. First, there is limited evidence
about the gap between rents and LHA in Wales, and second, in 2020/21 the LHA was
restored to the 30th percentile of the market. The existence of a large gap between the
LHA rate and the 30th percentile of advertised rents so shortly after the LHA rate was reset
suggests that the LHA freeze alone is not the only driver of the shortfall between the LHA
and advertised rents.

4.1 The LHA gap
The difference between LHA and actual rents is well-known.27 Previous studies
demonstrated that people in receipt Housing Benefit or the housing element of Universal
Credit are only able to cover the cost of housing of 13 per cent of the market across the
UK, with numerous areas lacking any housing where the rent is fully covered.28 Research
undertaken in Bristol showed an even more challenging picture, with only two per cent of
properties being within the amount provided by Housing Benefit or the housing element
of Universal Credit.29

We have divided our analysis into three to reflect the different market pressures felt by
different household types:

   •   shared accommodation;
   •   one-bedroom accommodation;
   •   two-, three- and four-bedroom accommodation.

In undertaking this analysis, we have explored the number and type of properties
advertised for rent, the number of those properties where the rent is fully covered by
Housing Benefit or the housing element of Universal Credit, the 30th percentile of
advertised rents at the time we undertook our analysis, and the gap between the LHA and
this 30th percentile.

Shared accommodation
Table 1 sets out of findings in respect of shared accommodation. It shows that there is a
large gap between LHA and the rent of the 30th percentile of advertised properties. The
shortfall was more than £50 a month in all local authority areas bar two (Flintshire and
Gwynedd) at the time of our research. Even in Flintshire, where the gap between the LHA
and the 30th percentile of advertised market rents is lowest, a tenant would face a shortfall
of £120 per year. The largest gap was in Denbighshire, where a tenant would be short by
        £1,970.40 each year.

Table 1      Data breakdown for shared accommodation
Local Authority               Number of            Number of             LHA Rate          30th Percentile   Gap between
                              properties         properties that           (£)                   (£)         LHA and 30 th
                              advertised         are within the                                               Percentile
                                                       LHA                                                        (£)
                                                   allowance
Cardiff                                  758                    39              284.44                405           120.56
Conwy                                      42                    3              235.80                380           144.20
Denbighshire                               54                    0             263.58*                400           164.20
Flintshire                                 84                   25                  350               360               10
Gwynedd                                  140                    36                 300                345               45
Merthyr Tydfil                             22                    0                  216               360              144
Pembrokeshire                              77                    0                 240                400              160
Rhondda Cynon Taf                         113                    4                  216               300               84
Swansea                                  142                     2                 250                370              120
Torfaen                                    15                    2                  216               350              134
Total                                  1,447                   111           256.47**                 370           133.53
* In Local Authority in which there are multiple LHA rates, we used the mid-point between the rates
** Based on average across 10 Local Authorities

        Over half of the properties we surveyed were in Cardiff,
        market. Other than this, there do not seem to be any discernible pattern in the difference
        between local authorities. For example, Rhondda Cynon Taf has a smaller gap between
        LHA and advertised rents than Torfaen and Merthyr Tydfil, despite sharing similar
        characteristics. Similarly, the LHA rate in Flintshire is closer to advertised rents than in
        Denbighshire, despite the fact they border each other and share the North Clwyd BRMA in
        areas.

        The lack of any wider trends illustrates that markets are sensitive to local factors. For
        example, our conversation with Torfaen Council revealed that they are seeing increased
        demand for properties due to the opening of the Grange hospital, and an influx of people
        from Bristol as a result of the M4 tolls being removed.

        There are three local authority areas (Denbighshire, Merthyr Tydfil and Pembrokeshire),
        where there is no shared accommodation available where advertised rents are at or
        below LHA rates. Even in Flintshire, the local authority that had highest proportion of
        accommodation within the LHA rate, fewer than 30 per cent of tenants would have their
        rents covered in full.

        Of the 111 shared accommodation units included in our analysis, 105 were found on
        Spareroom.com. Spareroom tends to feature adverts for lodgings made available on a
        bare license, meaning that they offer fewer legal protections than tenancies. We heard
        from local authority officers that this means that often they cannot discharge someone
        from homelessness into such accommodation whilst the properties are less attractive for
        prospective tenants who have not come through the homelessness system.
One-Bedroom properties
The picture for one-bedroom homes is similar to the picture for shared accommodation.
The gap between LHA and advertised rents across 10 local authorities is relatively large,
and someone claiming Housing Benefit or the housing element of Universal Credit can
expect to experience a shortfall of on average £1,926.12 per year. However, half of the
areas surveyed appear to experience smaller LHA gaps for one-bedroom homes than in
shared accommodation.
Table 2 Data breakdown for one-bedroom accommodation
Number of Number of LHA Rate 30th Gap between
properties properties that (£) Percentile LHA and 30th
Local Authority advertised are within the (£) Percentile
LHA (£)
allowance
Cardiff 276 15 483.28 650 166.72
Conwy 10 0 320 445 125
Denbighshire 10 1 344.10* 450 164.20
Flintshire 24 1 368.20 475 106.80
Gwynedd 29 0 317.29* 550 227.80
Merthyr Tydfil 6 0 308.40 430 121.60
Pembrokeshire 9 0 313 400 87
Rhondda Cynon Taf 12 4 304.20* 375 70.80
Swansea 29 0 414.24 595 180.76
Torfaen 4 0 349.24 450 100.76
Total 408 20 439.49** 600 160.51
* In Local Authority in which there are multiple LHA rates, we used the mid-point between the rates
** Based on average across 10 Local Authorities
There appears to be a small positive correlation between local authorities where the LHA
advertised rent gap is smaller for one-bedroom properties than for shared
accommodation, and the number of shared accommodation homes advertised. Areas like
Torfaen, Merthyr Tydfil, and Denbighshire, all of which had a limited number of shared
accommodation homes on the market over the summer, see a smaller LHA-rent gap for
one-bedroom properties than for shared accommodation. A possible explanation for this
is that the lack of supply of shared-accommodation properties is pushing up rents.
Pembrokeshire and Rhondda Cynon Taf were the only areas with an LHA-rent gap below
£100 a week. Rhondda Cynon Taf also had the highest proportion of available one-
bedroom housing. Even so, across the ten local authorities we surveyed, the LHA rate
only fully covered the cost of rent of 5 per cent of one-bedrooms accommodation, far
below the 30th percentile. Six out of the ten areas we surveyed (Conwy, Gwynedd,
Merthyr Tydfil, Pembrokeshire, Swansea and Torfaen) had no one-bedroom
accommodation that was fully covered by Housing Benefit or the housing element of
Universal Credit.Two-, three-, and four-bedroom accommodation
Table 3 collates the data for two-, three-, and four-bedroom accommodation in one
table.
Table 3 Data breakdown for two-, three- and four-bedroom
accommodation
Local Authority Number of Number of LHA gap two- LHA gap LHA Gap
properties properties bedroom three- four-bedroom
advertised found below (£) bedroom (£)
30th (£)
percentile
Cardiff 530 1 201.64 306.56 425.48
Conwy 22 0 169.32 250.68 432.60*
Denbighshire 28 0 194.32 195.68* 282.60*
Flintshire 81 1 93.68 197.28 363.56
Gwynedd 45 0 235.76 616.72 737.64*
Merthyr Tydfil 38 0 204.80 183.76 401.64*
Pembrokeshire 34 1 154.16 211.72 374.64*
Rhondda Cynon Taf 130 2 139.80 199.16 409.96
Swansea 71 0 239.32 266.72 535.36
Torfaen 28 0 101.56 266.72* 301.64*
Total 997 5 182.33** 198** 308.71**
* Low sample size
** Based on average across 10 Local Authorities
The gap between LHA and advertised rents is larger still for two- and three-bedroom
accommodation and increases further for four-bedroom properties. Even in areas with
sufficiently large data samples, there is still a large gap between the LHA rate and the
advertised rent in the 30th percentile of the market. The average gap across the ten local
authorities for a four-bedroom home stands at 308.71 per month, which would equate to
a tenant experiencing an annual shortfall of £3,704.12.
Amongst houses with two or more bedrooms, we were only able to locate five properties
that the rent was advertised for below the 30th percentile. There is a significant lack of
properties available at or below LHA rates for tenants who require a larger property.
It should also be noted that the data for four-bedroom homes is limited, reflecting a
broader lack of four bedroom rental properties in Wales, an issue that was raised by local
authorities during our research.
Conclusions
It is clear that LHA does not cover the advertised rents of the majority of accommodation
available for rent in most local authorities we considered. There are two consequences
of this.
First, there is an acute shortage of properties whose advertised rents are at or below the
LHA rate. We identified just 136 properties on the market in 10 local authorities this
summer where Housing Benefit or the housing element of Universal Credit would cover
rents in full just 4.8 per cent of advertised homes.Second, the vast majority of properties are advertised with rents above the LHA rate. The gap between LHA and advertised rents increases sharply with property size, rising from an average gap of £133.53 a month for shared accommodation to a gap of £308.71 in four- bedroom homes. It should be noted that whilst the LHA-rent gap increases in cash terms with every additional bedroom, the gap is consistently around 32 per cent above LHA for all property types. The properties whose rents were fully covered by Housing Benefit or the housing element of Universal Credit were found in Cardiff, Conwy, Denbighshire, Flintshire, Gwynedd, Pembrokeshire, Swansea, Torfaen, and Rhondda Cynon Taf. None were identified in Merthyr Tydfil.
5. Explaining the shortfall
It is clear that the LHA rate covers the advertised rent of a very small proportion of
properties available in summer 2021. There appear to be three major factors behind this
gap: the LHA freeze, and the way that LHA is calculated. Each of these issues are
discussed below.

5.1 The LHA freeze
The decision to freeze LHA between 2016/17 and 2019/20 contributed significantly to the
emergence of a gap between the LHA rate and landlord rents. Even before the freeze, the
real terms value of the LHA was in steady decline
decision to raise it in line with CPI inflation rather than 30th percentile rents. The decision
to freeze the LHA not only crystalised this existing shortfall but then prevented further
uplifts as rents rose.30 By 2020, Policy in Practice estimated that the LHA freeze had
effectively led to it being equivalent to the 13th percentile of rents.31 Similarly, the
                                                                demonstrated that there are
multiple areas within Wales where less than 10 per cent of the rented properties would be
fully covered by Housing Benefit or the housing element of Universal Credit.

                                                         the contemporary 30th
percentile should have eliminated the gap that had emerged over the previous five years.
Its subsequent decision to re-
opening up a gap between LHA and landlord rents once again.
                               th
                                percentile rents confirms that the new freeze is already
having an impact. After just one year, there are shortfalls of £5 a week or more between
the LHA rate and 30th percentile rents for shared accommodation in Blaenau Gwent,
Merthyr Cynon, North Powys, Pembrokeshire and Taff Rhondda. North West Wales, South
Gwynedd, Pembrokeshire and Cardiff all have shortfalls across all or all bar one type of
accommodation (full details can be found in Annex 1 and 3).32 Some of the gaps may
reflect the impact of Covid-19 on the housing market although there is mixed evidence to
support this.33

It is, however, likely that there are other factors at play which have led to the re-
emergence of the gap between LHA and the 30th percentile of advertised rents in Wales.

5.2 Calculation of LHA
One possible reason for the difference between the LHA rate and landlord rents is how
the LHA rate is calculated. Several local authority officers raised concerns that there is a
lack of clarity about how the LHA is set and how the BRMAs are established.

First, there are concerns about the data used in setting LHA. Data should be collected
from 20 per cent of all PRS dwellings, but rent officers have no powers to compel
landlords to disclose this information, meaning that they are only able to use data
willingly provided by landlords.

Relying on voluntary data collection means that there can sometimes be insufficient
information. In these cases, rent officers may use data from
boost their sample. The limited amount of four-bedroom and shared accommodation in
many areas means that the sample is often smaller than is reliable, and so data for these
types of accommodation are more likely to be supplemented with data from other areas.
This practice adds a further element of unreliability to the determination of LHA indeed
it may skew the data and produce an LHA that is unrepresentative of an area.
A second issue is that LHA rates are based on agreed rents rather than advertised rents. As
such, LHA rates are a snapshot of all rents, some of which may have been agreed many
years ago, rather than an up-to-date reflection of the asking rents of homes currently on
the market. LHA is therefore inherently slow to respond to trends in the rental market,
even if there were no freeze. This particularly affects people seeking a new tenancy. With
a third of PRS tenants having lived in their current address for fewer than 12 months, this
is a large number of tenants seeking a new property each year.34
A third issue with the mechanism for setting LHA relates to the way that BRMAs are
established. When BRMAs are established, access to local authority services is not
considered as one of the factors to be taken into account. We heard from larger, rural
local authorities that many of their services are based in one part of a local authority,
rather than spread across their area. For example, Gwynedd contains two BRMAs: North
West Wales and South Gwynedd. The North West Wales BRMA has a larger population
and so more local authority services are concentrated there. However, properties in South
Gwynedd BRMA are comparatively more affordable for someone claiming Housing
Benefit or housing element of Universal Credit. As such, a tenant in South Gwynedd may
have their rent covered in full but would have to travel long distances to access some
local authority services.
5.3 Setting the LHA at the 30th percentile
Setting LHA at the 30th percentile by definition means that seven out of ten properties
have rents in excess of Housing Benefit or the housing element of Universal Credit. This
section explores the impact on the availability of rental properties in the ten local
authority areas we considered of setting LHA at the 30th percentile of summer 2021
advertised rents and of increasing it to the median. It should be noted that these
estimates do not take into account the potential impact of any change on landlord or
tenant behaviour.
Graph 3: Number of properties available at different LHA levels
1400
1200
1000
800
600
400
200
0
Shared One-bedroom Two-bedroom Three-bedroom Four-bedroom
Accomodation
Properties Avalible at current LHA Properties Avalible 30th percentile
Properties Avalible 50th percentileAs can be observed from graph 3, raising the LHA rates to be in line with the 30th percentile of the advertised rents increases the number of properties with rents at or below this level from 136 to 949, a nearly 600 per cent increase. The increase is even greater if LHA rates were set at the median, with the number of properties available at or below LHA rates increasing to 1,422. The majority of the properties collected are shared accommodation, and the levels of other property types are far lower in comparison. This would indicate that even if the LHA was as a sufficient level, there still may be an issue with the overall stock of different houses.
6. Landlord requirements
Low-income households face challenges accessing accommodation in addition to the
shortage of properties and the shortfall of LHA relative to rents. We heard from local
authority officers that some private landlords had additional requirements that exclude
low-income tenants, even if the rent is at or less than LHA.

6.1 Barriers to renting
Prior to July 2020, landlords were able to refuse to let a property to people in receipt of
social security benefits, with                       referring to the now superseded
Department of Social Security often appearing in letting adverts. A court case in July
2020 found that these practises were discriminatory, and the practice ought now to have
ceased.

With                                                 they have developed a number of
alternative requirements that in practice exclude low-income tenants. Amongst the
techniques used are:

   •   excessive deposits or bonds;
   •   a requirement for multiple references;
   •   a requirement for at least one guarantor;
   •   the setting of minimum income requirements.

Of the adverts we surveyed, 62 per cent referred to the need for a deposit, with the
average deposit being £269.86. Roughly a third of all the properties surveyed asked for
                                                                specified deposits that
were above               rent.

In total, 33 per cent of adverts explicitly asked for references, a credit check or a
guarantor, or a mixture of those three. Ten adverts additionally mentioned wider
background checks, and 27 had a minimum income requirement. It should be noted that
prospective tenants may face additional requirements that have not been made clear in
the advert.

Additionally, 29 per cent of adverts specified that they only wanted to rent to

adverts despite the 2020 legal ruling.
Table 4 Data breakdown for one-bedroom accommodation with no
LHA gap
Local Authority Houses with no LHA Accommodation with Percentage available
gap barriers (%)
Cardiff 55 28 49
Conwy 3 0 100
Denbighshire 1 0 100
Flintshire 27 16 59
Gwynedd 36 13 36
Pembrokeshire 1 0 100
Rhondda Cynon Taf 10 0 100
Swansea 2 0 100
Torfaen 2 2 0
Wales 138 61 44
Merthyr Tydfil is not included due to no accommodation found
deposit at the advertised rent or below and the
need for a reference, a third of all advertised properties specified at least one requirement
that would be likely to prevent someone in receipt of Housing Benefit or the housing
element of Universal Credit from applying to rent it. This included nearly half (61) of the
138 properties where the advertised rent was at or below LHA rates.
The effect is to further reduce the number of properties available to a claimant. A mere
2.7 per cent of homes on the market between May and August 2021 had both their rent
covered in full and had no requirements that likely to exclude low-income households.
94 per cent of homes at the 30th percentile or below were either too expensive to have
their rents covered in full or had other limiting factors.
Of the homes that were available, 27 were located in Cardiff, 23 in Gwynedd, 11 in
Flintshire, 10 in Rhondda Cynon Taf, three in Conwy, two in Swansea, one in
Pembrokeshire, and one in Denbighshire.
We also recorded how many homes would allow tenants to have pets. Of the 2,236
properties we surveyed, 1,454 referred to pets in the adverts. Of these, just 15 per cent
said they would allow or consider allowing pets, the rest stating that pets were not
allowed. The majority of advertisements for properties that allowed pets were for two-,
three- and four-bedroom homes, suggesting that they are targeted towards families. As
properties that allow pets are in short supply, a household with a pet may struggle to find
suitable accommodation if they need to move house. Only ten of the properties that
allow pets had rents that were fully covered by Housing Benefit or the housing element of
Universal Credit.
6.2 Landlords attitudes
Conversations with local authority officers revealed several reasons as to why landlords
set requirements that may exclude low-income renters.
Renters claiming benefits are often seen as a risk by landlords. There is already a body of
research that has explored why this is the case. Many landlords who own a single
property, for example, prefer safe betstherefore avoid renting out to people in receipt of Housing Benefit or the housing
element of Universal Credit , even if the tenant is working.35 Increased demand for
accommodation in the PRS has enabled pick and choose who they rent
36
to. Landlords were also wary of letting to claimants because of the five week wait for
Universal Credit.37
What this indicates is that even if the LHA rates were more closely aligned with advertised
rents, a large proportion of homes in the PRS would not be accessible for prospective
tenants due to landlords . Greater willingness to let properties to tenants
receiving Housing Benefit or the housing element of Universal Credit is required if the PRS
is to be considered secure and accessible for benefit recipients. This is vital if the PRS is to
people who are homeless.
Some local authorities noted that at the beginning of the pandemic landlords became
more willing to house people in receipt of Housing Benefit or the housing element of
Universal Credit because of concerns about the incomes of people in work. Tenants in
receipt of benefits were viewed as a during the pandemic because their
income was guaranteed. This suggests that the crux of the issue for landlords is financial,
with landlords being concerned that benefit claimants cannot reliably pay rent. A gap
between LHA and act
claimants even further.
Our interviews confirmed this point. Officials at Flintshire and Gwynedd, areas where our
research suggests have a small gap between rents and LHA, reported far fewer issues with
landlord willingness to let to claimants compared with local authorities where the gap is
larger. In the latter, we heard that landlords would rather take the risk of having a vacant
property than let to a claimant.
It was also brought to our attention that the terms and conditions of Buy to Let
mortgages often include restrictions on lettings, including preventing landlords from
renting to Housing Benefit or the housing element of Universal Credit claimants. A report
from the NRLA noted that 36 per cent of landlords reported some clause in their
mortgage that prevented them from renting to those claiming Universal Credit.38
A further issue raised by local authorities was that landlords avoid tenants in receipt of
Housing Benefit or the housing element of Universal Credit for fear that they would be
The NRLA noted that 68 per cent of landlords were unwilling to
let to someone who is homeless, and 57 per cent of landlords did not want a tenant who
was claiming Universal Credit.39
We were also told that some landlords are leaving the market. We were heard that
numerous landlords hold negative attitudes towards Rent Smart Wales, environmental
retrofitting, and the Renting Homes (Wales) Act. 51 per cent of landlords in the UK said
that legislative restrictions were a reason for them not wishing to let to people claiming
Universal Credit.40
While there are some financial incentives employed by local authorities to encourage
landlords to let to benefit claimants, research from the NRLA demonstrates that purely
financial incentives, such as paying bonds, paying for repairs, or guaranteeing rent arelargely ineffective in persuading most landlords to work with local authorities when they can earn more money renting above LHA rates.41 The buoyant property market is also affected the availability of rental properties. We heard from some local authority officers that the landlords who had been most willing to work with them historically are most likely to be taking advantage of the current housing market and selling their properties. We also heard that others were turning their rentals into luxury homes to take advantage of a growing middle class professional market. There are concerns therefore that there will be fewer landlords willing to work with local authorities in future on rental schemes that support landlords to rent their homes to tenants that are in receipt of Housing Benefit or the housing element of Universal Credit. The consequences of this lack of landlord cooperation are two-fold. First, it reduces the availability of housing for people claiming support provided by Housing Benefit or the housing element of Universal Credit. Second, it pushes a lot more people out of their accommodation as landlords sell and upgrade. This in turn creates greater demand for homes at the lower end of the market, as well as creating far greater pressure on homelessness services.
7. Quality and Security
The level of LHA and landlord actions have consequences for the quality and security of
accommodation advertised for rent.

7.1 Security of tenure
Of properties advertised to rent during summer 2021, 51 per cent was shared
accommodation. The majority of this accommodation was advertised by landlords
seeking a lodger, rather than as a room in a House in Multiple Occupation (HMO) - In
total, 69 per cent of the adverts for properties on Spareroom were obvious lodging
situations or had a maximum length of tenancy.

This has important implications for security, because lodgings are typically let on a bare
licence, which gives minimal legal protections to tenants. Bare licenses do not offer the
same legal protections against evictions as standard tenancy agreements, nor must they
comply with the same housing quality standards. Indeed, bare licenses are often
considered to be unsuitable for people seeking long-term accommodation or at risk of
homelessness.

7.2 Quality of accommodation
Concerns were raised during our interviews about the quality of housing available to
people in receipt of Housing Benefit or the housing element of Universal Credit. Phrases
like                         were used to describe some of the properties that people
were finding.

Of the 2,853 advertisements we surveyed, only 9.3 per cent gave data on the EPC rating
of the property. If the informal market and Spareroom properties are excluded, just 241
properties, or 16 per cent, on the formal market providing an EPC rating.

                         Graph 5: Proportion of EPC Ratings (%)

                                                   9
                                      21

                                                           35

                                     34

                                           B   C   D   E

Of the properties that did provide a rating, 55 per cent were rated at either D or E. This
suggests that the majority of housing available is expensive to heat. There appeared to be
no relationship between energy efficiency and rents: in our sample, properties with a D
You can also read