Population structure and genetic diversity of invasive Fall Armyworm after 2 years of introduction in India
←
→
Page content transcription
If your browser does not render page correctly, please read the page content below
www.nature.com/scientificreports
OPEN Population structure and genetic
diversity of invasive Fall Armyworm
after 2 years of introduction
in India
N. Nayyar1, R. G. Gracy1, T. R. Ashika1,3, G. Mohan1,3, R. S. Swathi1, M. Mohan1,
M. Chaudhary2, N. Bakthavatsalam1 & T. Venkatesan1*
Fall Armyworm (FAW), Spodoptera frugiperda, is a polyphagous pest capable of feeding over 80 plant
species and was indigenous to the Western Hemisphere. Within a span of 4 years, FAW has established
itself throughout most of the regions in Africa and Asia causing significant losses in maize production.
Owing to its revamped distribution range, it would be prudent to analyze the ensuing genetic changes
and study the emerging phylogeographic patterns across the world. In this regard, we would like to
provide a current snapshot of genetic diversity of FAW in India 2 years after the initial introduction and
compare it with the worldwide diversity in order to trace the origins and evolutionary trajectories of
FAW in India. We have investigated around 190 FAW samples from different regions in India for strain
identity and polymorphism analysis on the basis of partial mitochondrial cytochrome oxidase I (COI)
gene sequences. Apart from the ancestral rice and corn strain haplotype, our study demonstrates
the presence of 14 more haplotypes unique to India at a haplotype diversity of 0.356. We were also
able to record inter-strain hybrid haplotypes of rice and corn strains in India. Regional heterogeneity
within Indian populations seems to be quite low representative of extensive migration of FAW within
India. Distribution analysis of pairwise differences and rejection of neutrality tests suggest that the
FAW population in India might be undergoing expansion. Our data is consistent with the findings
suggesting a recent and common origin for invasive FAW populations in Asia and Africa, and does not
indicate multiple introductions to India. This study reports the highest genetic diversity for Indian FAW
populations to date and will be useful to track the subsequent evolution of FAW in India. The findings
would have important ramifications for FAW behavior and composition throughout the world.
Fall Armyworm (FAW), Spodoptera frugiperda (J.E. Smith), is a polyphagous pest native to Western Hemisphere
and is capable of feeding over 80 plant species. In 2016, it was first reported outside America in the African sub-
continent and became notorious for its rapid expansion throughout the subcontinent and significant economic
losses in maize production in a short span of time1–3. In 2018, reports of its presence in the Indian subcontinent
were abounded and it was again found to be majorly associated with maize crops across different regions in the
country4–6. Within a span of 2 years, FAW has established itself throughout most of the regions in India and has
been found to attack maize, sorghum, sugarcane, and millets7–11. Additionally, FAW invasion has been reported
from 19 Asian countries including Myanmar, China, Vietnam, Japan, Korea and in February, 2020, it was detected
in Queensland, Australia as well (https://gd.eppo.int/taxon/LAPHFR/distribution). The rapid dispersal of FAW
to these widespread regions and varied landscapes is alarming and poses a major threat to the food security
efforts of different countries.
Several studies have focussed on genetic analysis to understand the origins of FAW at the newly invaded
regions and to ascertain its crop preferences and insecticide resistance potential. Spodoptera frugiperda is known
to exist as two genetically distinct but morphologically identical sister strains, designated as ‘Rice strain’ (R strain)
and ‘Corn strain’ (C strain) which differ in their host preferences. R-strain is most consistently found in millet
and grass species associated with pasture habitats while the C-strain prefers corn, cotton and s orghum12,13. Apart
from the variable host distribution, the strains exhibit restricted mating potential and changes in pheromone
1
ICAR-National Bureau of Agricultural Insect Resources, Bellary Road, Hebbal, Bengaluru 560024, India. 2CABI,
South Asia-India, CG Block, NASC Complex, DP Shastri Marg, PUSA, New Delhi 110012, India. 3These authors
contributed equally: T. R. Ashika and G. Mohan. *email: Venkatesan.T@icar.gov.in
Scientific Reports | (2021) 11:7760 | https://doi.org/10.1038/s41598-021-87414-5 1
Vol.:(0123456789)
www.nature.com/scientificreports/
Figure 1. Locations of the FAW samples analysed in this study. The size of the dot is indicative of the number
of samples analysed from that location. The map was drawn using R package rworldmap v 1.3.6 and tidyverse v
1.3.023,24.
composition as documented by several studies14,15. Owing to similar morphological phenotypes, the two strains
of FAW are mainly classified on the basis of polymorphisms in mitochondrial gene cytochrome c oxidase subunit
1 (COI) and a nuclear gene triosephosphate isomerase (tpi)16,17. The correspondence between the two markers is
highly significant for the identification of FAW strains in the Western Hemisphere. However, when the invasive
populations from Africa, India and southeast Asia were examined for strain identity by using the two markers,
the results were found to be highly discordant. In general, Tpi gene was found to accurately predict the host
association in invasive p opulations3,18,19. The discordance between the two markers was reflective of the hybrid
nature of the invasive populations which was subsequently corroborated with whole-genome studies20,21. Barring
the detection of two maternal COI lineages and a limited number of Tpi haplotypes, genetic variability in the
invasive populations was found to be very low. In addition, detection of a unique African Tpi ‘rice’ haplotype in
the populations from India and south east Asia further strengthened the hypothesis that the invasive populations
shared a recent and a common o rigin18,19. Though the notion was challenged by whole mitochondrial sequenc-
ing analysis, but there was consensus on highly reduced genetic diversity in invasive populations indicative of
a small number of founders22.
Most of the studies analyzing the genetic diversity of FAW in India were primarily undertaken in 2018, when
FAW was first detected in India and had spread to limited regions within the country21,22. The Indian population
exhibited high homogeneity with East and South African populations with the majority showing mitochondrial
rice strain COI and nuclear corn strain Tpi marker18. Mitochondrial diversity of the analyzed specimens was
found to be very low when compared to the native p opulation7,21. Thereafter, the dissemination of FAW in dis-
perse regions, potential subsequent introductions in India and adaptive changes could possibly lead to deviations
from the original structure. We were interested in finding whether the Indian FAW populations still conformed
to the findings of the previous studies or were they beginning to show digression. This study was designed to
capture the diversity of FAW populations in India in the last 2 years, to understand how FAW has adapted to the
Indian landscape and to compare the same across the newly expanded range of FAW across the world.
Results
Strain identity. In India, S. frugiperda was found to be a serious pest in maize, sorghum and was occasion-
ally found on sugarcane and cotton in different parts of the country. 92 FAW specimens were collected from 39
different regions in India and Nepal during the year 2018–20 and were subjected to molecular identification at
Division of Genomic Resources, ICAR-NBAIR, Bengaluru, India. The generated COI sequences showed 100%
similarity with S. frugiperda and were deposited in NCBI GenBank database. The sequences and the specimen
details were submitted to the BOLD database and DNA barcodes were generated. A list of all COI sequences gen-
erated at ICAR-NBAIR is provided in Supplementary File (Table 1a; 1–92). Additional 105 COI sequences which
were already deposited in GenBank from different parts of India between 2018 and 2020 were also retrieved
and combined with the ICAR-NBAIR dataset to study the diversity of Indian populations. Furthermore, FAW
sequences from America (n = 163), Africa (n = 150) and the rest of Asia [China, Japan, Vietnam, Korea, Bangla-
desh, Pakistan, Myanmar] (n = 76) were collected for comparative sequence analysis and inter-population stud-
ies. The approximate locations from which the analyzed specimens were collected are depicted in Fig. 1 and the
details of all the retrieved sequences are provided in Supplementary File (Table 1).
We began by investigating the polymorphisms in FAW COI and Tpi gene sequences in India, using strain-
defining loci and polymorphic sites reported by Nagoshi et al.18. COIA region or the barcode segment contains
polymorphic strain defining locus mCOI602Y, which has been used to distinguish between ‘R’ and ‘C’ sis-
ter strains of FAW in the Western Hemisphere. Upon investigation of the mentioned locus, out of 192 COIA
sequences from India, 91% of the samples belonged to ‘R’ strain, while the rest belonged to ‘C’ strain. The
observed structure is reminiscent of the populations from East Africa and the previously characterized Indian
populations from the state of Karnataka18. Based on the fact that the specimens were mainly collected from corn
crops, it reflects the discordance between the COI marker and the host association of FAW.
Scientific Reports | (2021) 11:7760 | https://doi.org/10.1038/s41598-021-87414-5 2
Vol:.(1234567890)
www.nature.com/scientificreports/
Figure 2. Strain distribution for FAW populations in India based on mitochondrial gene COI and Tpi gene
markers. (a) COIA distribution; (b) COIB distribution; (c) Tpi distribution.
Another strain marker COIB, a segment downstream of the barcode region, was analyzed which contains
polymorphic loci mCOI1164D and mCOI1287R giving rise to five haplotypes, four belonging to Corn strain
(CSh1-4); and one to the Rice Strain category. The relative distribution of COIB haplotypes, CSh4 and CSh2,
has been used as an indicator to study the descent of FAW populations in America. FAW populations collected
from Florida and the East coast of America majorly belong to CSh4 haplotype while those from Texas and most
other parts of America show a predominance of CSh2 h aplotype25. COIB haplotyping was done for 72 popula-
tions of FAW in India, out of which 68 belonged to ‘R’ strain while the rest demonstrated CSh4 haplotype. We
did not find any specimen belonging to other ‘CS’ haplotypes. Overall, the distribution and the composition of
both COIA and COIB markers at strain-defining loci were strikingly similar to those o f18, and do not show much
variation in the span of last 2 years (Fig. 2a, b). The list of all the sequences used for COIB analysis are provided
in Supplementary File (Table 2).
The polymorphisms at strain-defining loci of the fourth exon and intron segment of Tpi gene were studied,
which identified four haplotypes in Indian populations (n = 66), i.e. TpiCa1a homozygous (n = 39), TpiCa2a
homozygous (n = 6), TpiCa2b homozygous (n = 4) and TpiRa1a homozygous (n = 4). Besides this, thirteen speci-
mens demonstrated the heterozygous corn-strain haplotypes (TpiCa1a/Ca2a; TpiCa1a/Ca2b; TpiCa2a/Ca2b) as
observed by their overlapping DNA sequence chromatographs (Fig. 2c). While TpiCa1a is still the predominant
haplotype as suggested by Nagoshi et al. (2019), but our data shows higher frequency for TpiCa2a and TpiCa2b
haplotypes than that observed e arlier18. Tpi ‘R’ haplotype was detected from the states of Karnataka and Tripura
in India and shared sequence with the unique TpiRa1a haplotype detected from Africa. Akin to the invasive
populations from other countries, 90% of the specimens in India exhibited discordant Tpi and COI markers for
host association prediction18,19. 94% of the samples collected from corn crops demonstrated Tpi ‘C’ haplotype.
But, the four specimens belonging to Tpi ‘R’ haplotype were also collected from corn fields. So, it is yet to be
ascertained whether the TpiRa1a specimens in India show a preference towards rice strain host crops or not. A
list of all Tpi gene sequences used in this study is provided in Supplementary File (Table 3).
Polymorphism analysis for FAW populations in India. In order to understand the haplotype diver-
sity of FAW in India, we analyzed 460 bp of COIA barcode region for 183 specimens from India. We were able
to find 20 polymorphic sites (21 mutations) in the dataset at a nucleotide diversity of 0.00313. The occurrence
of non-synonymous mutations (60%) was higher than the synonymous ones. We also identified 16 different
haplotypes from Indian COIA sequences at a haplotype diversity of 0.356, out of which 13 haplotypes belonged
to the rice strain while three belonged to the corn strain. As per our knowledge, this study catalogs the highest
genetic diversity for FAW reported from India to date. The majority of the analyzed COI sequences belonged
to a single rice haplotype (79.7%; India_haplotype 1; n = 146) which was distributed throughout the country.
This was followed by the predominant ‘C’ strain haplotype (India_haplotype 2; n = 12) and another ‘R’ strain
haplotype from India (India_haplotype 4; n = 12). The remaining haplotypes from India were found as singletons
(Fig. 3a, b). We did not find region-specific association of any haplotype in India. Fu’s Fu test and Tajima’s D test
Scientific Reports | (2021) 11:7760 | https://doi.org/10.1038/s41598-021-87414-5 3
Vol.:(0123456789)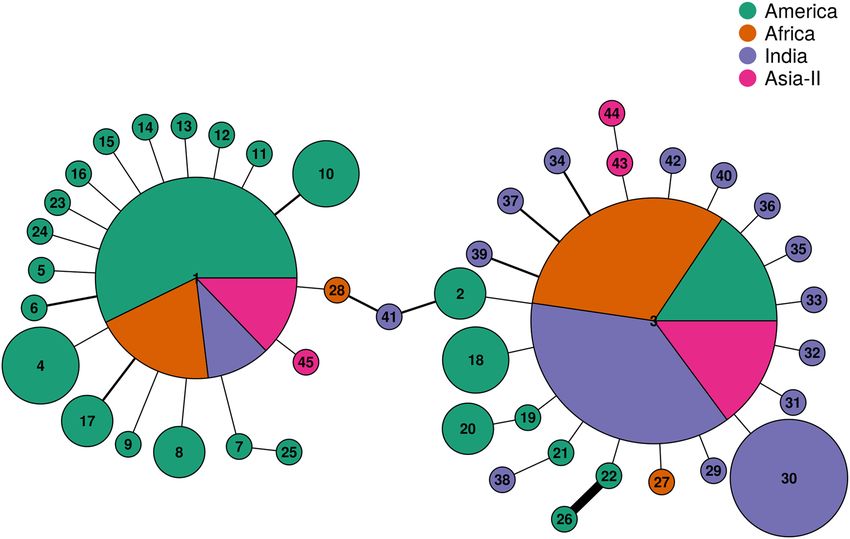
www.nature.com/scientificreports/
statistic were significantly negative, suggesting that the FAW population in India might be undergoing expansion
(Table 1). Within ‘R’ strain (n = 169) and ‘C’ strain (n = 14) populations, the nucleotide diversity was higher in ‘C’
strain than ‘R’ strain. Mismatch distribution curve followed a largely unimodal curve for ‘R’ strain populations,
representing population expansion within the strain (Fig. 3c). The same was well corroborated with Fu’s Fu and
Tajima’s D neutrality tests statistics (Table 2). Surprisingly, we found two gene conversion tracts within India_
haplotype 16 and one gene conversion tract in India_haplotype 15, indicative of mitochondrial recombination
events between ‘C’ and ‘R’ strain in India (Fig. 3d). Both the haplotypes were identified as ‘C’ strain haplotypes
on the basis of mCOI602C locus but demonstrated an inter-strain haplotypic signature. Both the haplotypes
were found in close proximity to each other in the Indian state of Tamil Nadu.
Comparative genetic analysis across the geographical range. We were interested in comparing the
diversity of Indian FAW population with that of other geographic regions to study the biogeographic patterning
of FAW and to study the relatedness of different sub-populations with each other. For this, we divided the FAW
population in four broad groups where population-level studies were feasible. These groups included 1. America
(contains population from North and South America); 2. Africa, 3. India and 4. Asia-II (includes populations
from Bangladesh, China, Korea, Vietnam, Japan, Myanmar and Pakistan). Along with the previously defined 183
specimens from India, we analyzed 163 COI sequences from America, 150 from Africa and 76 from rest of the
Asian countries for polymorphisms. For a comparative study, analysis from all sequences was performed using
the same 460 bp region of COI gene which was used for the analysis of Indian populations. In the process, we
observed 27, 3, 5 haplotypes, respectively from America, Africa and East-Asia. The predominant ‘R’ and ‘C’ COI
haplotypes from America [GenBank Accession: U72977.1, U72974.1] represent the principal haplotypes in all
the invaded regions and are presumed to represent the ancestral haplotypes introduced to these regions. Other
than the ancestral haplotypes, Africa, India and Asia-II were represented by 2, 14 and 3 haplotypes specific to
these regions, respectively. Neutrality test statistics for both African and rest of Asian populations suggested that
the populations are still evolving rather neutrally in these places (Table 1).
We compared the polymorphic sites among the different sub-populations to access the shared polymorphisms
across the groups (Fig. 4). We found that African and American populations shared the maximum number of
mutations (n = 7), while both India and Asia-II shared six mutations each with the American population. Also
among the invading populations, India had the highest number of unshared polymorphisms with the other
populations (n = 15), upholding the other statistics regarding population expansion in India.
Haplotype network and genealogical inferences. Haplotypes networks were constructed using hap-
lotypes and their frequencies from populations of America, Africa, India and Asia-II using R-package pegas
v0.14. The network constructed for 45 FAW haplotypes across all locations is shown in Fig. 5. The network
clearly shows the star-like expansion pattern for the two ancestral rice and corn strain COIA FAW haplotypes.
Both the ancestral haplotypes are dominant haplotypes of each of the four geographical regions. However, there
are clear differences in the distribution of these haplotypes across the four regions. While the frequency of rice/
corn haplotypes in America is 0.41; rice haplotype is the dominant haplotype of the three invaded regions with
Africa, India and Asia-II showing frequencies of 0.84, 0.91 and 0.79, respectively. The network suggests the
introduction of the two identical maternal lineages at all the invaded regions. Apart from that, there is no evi-
dence to propose multiple introduction events in the invaded regions on the basis of this data. Most of the novel
corn haplotypes were found in America whilst most of the novel rice haplotypes were sequenced from India
despite much recent invasion of the ancestral rice strain in India. Hap41 from India represent a link between
the two ancestral haplotype networks. Hybrid haplotypes of this nature have not been found or reported from
any other region before. Notably, gene-conversion tracts were also observed in the same haplotype through
polymorphism studies.
Population structure. Genetic structure between the four geographical groups was analyzsed using
AMOVA. We ran seven separate AMOVA analyses, initially comparing the four geographical groups and then
the same analysis was performed between different combinations of groups (i.e. America and Africa, America
and India, America and Asia-II, Africa and India, Africa and Asia-II, India and Asia-II). The results are shown
in Table 3. The results suggest significant genetic differentiation between the four geographical groups (26%)
indicating the existence of population structure between regions. In addition to this, significant variation was
observed between native American and the invasive populations, with the highest differentiation seen with
respect to Indian populations (42.9%). Also, the results predict that both India and Asia-II are genetically more
similar to the African population than America.
Similar results were corroborated with DAPC analysis and the resultant membership table which indicated
two clear discriminant clusters between America and India (Fig. 6).
Discussion
An ideal design for any population genomics study would involve diligent tracing of the evolutionary course of
a population over geography or time. Spodoptera frugiperda provides an excellent model system in this regard
since it is believed to have expanded its distribution range very recently and has been well documented and char-
acterized for its diversity in its native as well as the extended range. Most of the studies analysing the diversity of
Indian FAW populations were performed around 2 years ago from a few locations where it was first detected in
India7,18,21,22. Thus we thought it was imperative to understand the diversity of the Indian FAW population over
the course of the last 2 years after the expansive migration of FAW across India.
Scientific Reports | (2021) 11:7760 | https://doi.org/10.1038/s41598-021-87414-5 4
Vol:.(1234567890)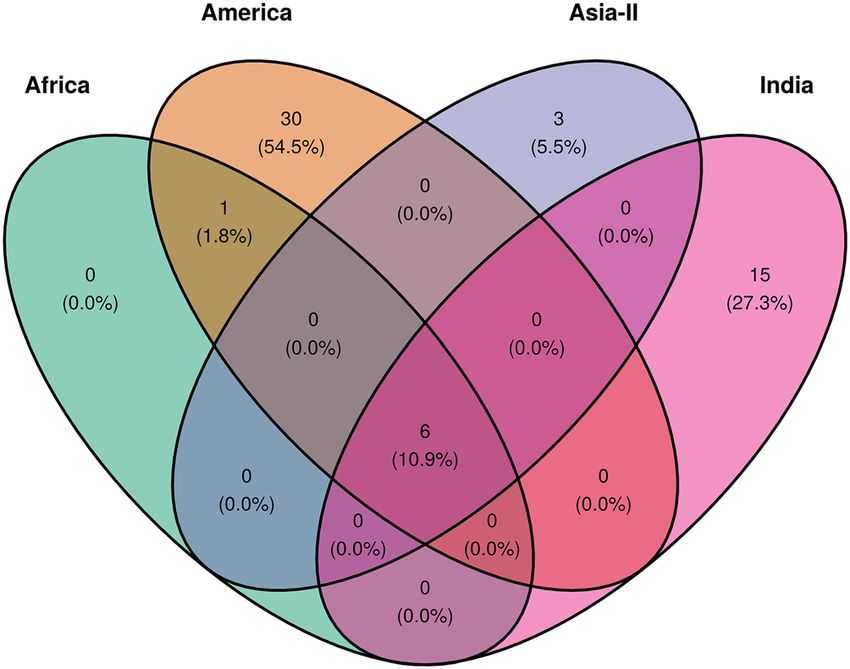
www.nature.com/scientificreports/

                                  Figure 3.  FAW COIA haplotypes from India. (a) Distribution of 16 different FAW haplotypes across India.
                                  (b) Frequency of the different haplotypes found in India. (c) Mismatch distribution curve for COIA rice strain
                                  haplotypes in India. (d) Depiction of polymorphisms in India_haplotype 15 and 16 within 490 bp region of
                                  mtCOIA gene with respect to Rice strain (RS) haplotype and a Corn strain (CS) haplotype. India_haplotype
                                  15 and 16 showed characters typical of an inter-strain hybrid haplotype. The figure was drawn using R package
                                  tidyverse v 1.3.0 and patchwork v 1.1.124,26.

Scientific Reports |   (2021) 11:7760 |               https://doi.org/10.1038/s41598-021-87414-5                                                   5

                                                                                                                                           Vol.:(0123456789)
www.nature.com/scientificreports/
India America Africa Asia-II Total
No. of sequences 183 163 150 76 572
No. of sites 459 459 452 460 450
No. of polymorphic sites 20 35 7 9 49
No. of mutations 21 37 7 9 54
No. of haplotypes 16 27 4 5 45
Haplotype diversity 0.356 0.698 0.284 0.383 0.493
Nucleotide diversity 0.00229 0.00772 0.00360 0.00462 0.00562
Fu’s Fs statistic − 9.667 − 8.46 3.864 2.98 − 29.43
Fu and Li’s D* test statistic − 5.04** − 4.97** 0.241 − 0.099 − 8.98**
Fu and Li’s F* test statistic − 4.58** − 4.16** 0.457 0.086 − 6.78**
Tajima’s D − 1.93* − 1.35 0.659 0.41 − 1.86*
Table 1. Summary of the genetic diversity of FAW populations analysed on the basis of partial mtCOIA gene
from four geographical locations viz. India, America, Africa and Asia-II. (**P < 0.02) (*P < 0.05).
COIA ‘R’ COIA ‘C’
No. of sequences 169 14
No. of sites 459 460
No. of polymorphic sites 15 5
No. of mutations 15 5
No. of haplotypes 13 3
Nucleotide diversity 0.00065 0.00234
Haplotype diversity 0.250 0.275
Fu’s Fs statistic − 17.677 1.014
Fu and Li’s D* test statistic − 6.75** − 0.223
Fu and Li’s F* test statistic − 6.08** − 0.51
Tajima’s D − 2.29** − 1.09
Table 2. Comparison between genetic diversity of FAW sister strains in India. (**P < 0.02).
Figure 4. Shared polymorphisms in partial mtCOIA gene for FAW populations across the four geographical
groups viz. America, Africa, India and Asia-II. The figure was made with the help of R package tidyverse v 1.3.0
and ggvenn v 0.1.824,27.
Scientific Reports | (2021) 11:7760 | https://doi.org/10.1038/s41598-021-87414-5 6
Vol:.(1234567890)www.nature.com/scientificreports/
Figure 5. Haplotype network of partial mtCOIA gene sequences of FAW from four geographical groups viz.,
America, Africa, India and Asia-II. Each pie represents a unique haplotype, the radius of the pie is proportional
to the number of sequences belonging to a particular haplotype. The divisions in the pie chart represent the
haplotype representation among the four geographical groups. The edge width in the network represent the
number of mutation separating the haplotypes from one another, the thinnest edge denotes a single mutation
difference.
Groups Source Df SS Variance components Total variance (%) P value
Between groups 3 279.485 0.656 26.122 0.001
All Within groups 568 1053.791 1.855 73.878
Total 571 1333.276 2.511 100
Between groups 1 251.676 1.448 42.957 0.001
America and India Within groups 344 661.665 1.923 57.043
Total 345 913.341 3.372 100
Between groups 1 152.492 0.961 28.865 0.001
America and Africa Within groups 311 736.485 2.368 71.135
Total 312 888.978 3.329 100
Between groups 1 8.597 0.045 3.514 0.005
Africa and India Within groups 331 406.273 1.227 96.486
Total 332 414.871 1.272 100
Between groups 1 77.065 0.716 20.333 0.001
America and Asia-II Within groups 237 665.186 2.807 79.667
Total 238 742.251 3.523 100
Between groups 1 1.618 − 0.001 − 0.075 0.282
Africa and Asia-II Within groups 224 392.126 1.751 100.075
Total 225 393.743 1.749 100
Between groups 1 13.258 0.112 8.314 0.001
India and Asia-II Within groups 257 317.306 1.235 91.686
Total 258 330.564 1.347 100
Table 3. Results of AMOVA analysis among the four FAW geographical groups.
Scientific Reports | (2021) 11:7760 | https://doi.org/10.1038/s41598-021-87414-5 7
Vol.:(0123456789)www.nature.com/scientificreports/
Figure 6. DAPC analysis. (a) Clustering of four geographical groups by discriminant analysis of principal
components (DAPC) of S. frugiperda samples (n = 572). (b) DAPC analysis of S. frugiperda samples (n = 572)
after randomly assigning geographical groups to samples showing no discrimination between clusters. (c)
Posterior membership probability plot shows posterior probability assignment of samples to their respective
geographical groups.
During our preliminary investigation of strain defining loci from COI and Tpi genes, we did not find much
variation between our dataset and the previous study from India by Nagoshi et al.18. The structure and composi-
tion of the FAW strains for COI locus was well preserved over this period. We found a disagreement of nearly
90% between COI and Tpi gene markers for the prediction of host association as has been ubiquitously reported
for the populations from most of the newly invaded regions across the w orld3,18,19. Tpi gene loci provided a better
estimate for host preference in the specimens investigated in our study.
When polymorphisms in mitochondrial COIA gene were studied in Indian populations, we found several
novel haplotypes predominantly belonging to the COIA ‘R’ strain, which were unique to India. Several popu-
lation genetic test statistics suggested population expansion in India while indicating that the populations in
Africa and other East Asian countries were still evolving neutrally. We tried to investigate the reasons behind the
same. First, we analyzed the distribution of different haplotypes in India to understand the impact of regional
influences in shaping the genetic diversity in India. India is considered as one of the most biodiverse countries
of the world and contains four major biodiversity hotspots in a dense cluster28,29. It is divided into 15 differ-
ent agro-climatic zones on the basis of soil type, climate, water availability etc. (http://mowr.gov.in/agro-clima
tic-zones), which is partly responsible for the observed diversity in India. Previous studies on the intra-species
diversity of certain insect pests in India have suggested geographical sub-structuring within different regions
of India30–32. We looked at the distribution of the different haplotypes in India but most of the novel haplotypes
in India at present are too infrequent and dispersed to attribute them to specific ecozones of India. Moreover,
looking at the rampant distribution of the predominant rice and corn haplotypes throughout India, the migra-
tion of FAW within India does not anyhow seem restricted. However, future studies would help to shed more
light on regional associations or microcosms of different haplotypes in India and their adaptive advantage over
other haplotypes in the Indian landscape.
As an alternate hypothesis, we tried to investigate whether multiple introductions of FAW could contribute
to the higher diversity seen in India. In this regard, shared polymorphism analysis or network studies from
partial COIA sequences did not provide any evidence for multiple introductions to India. Most of the novel
haplotypes seen in India belonged to the COIA ‘R’ strain category and were not found in America or any other
part of the world. In fact, India, Africa and other regions of Asia shared common ancestral haplotypes and similar
Scientific Reports | (2021) 11:7760 | https://doi.org/10.1038/s41598-021-87414-5 8
Vol:.(1234567890)www.nature.com/scientificreports/
polymorphisms with each other, signifying a common source for all these populations. However, a recent study
involving whole-genome sequencing of FAW populations from New World and invaded regions has proposed
multiple origins for FAW in the invaded countries22. On that basis, we think it would be prudent to analyze the
diversity in Indian populations with multiple gene loci to conclusively trace the geographic origins or monitor
the outflows from India. However, based on our analysis from a large dataset of FAW COI sequences, we found
that the mtCOI gene was useful in sub-structuring the populations from different geographical groups but did
not indicate introduction of multiple COI haplotypes to India.
Conversely, on a different note, it is important to state that within our primary data generated from 92 FAW
specimens collected from 39 different regions of India, we did not observe similar diversity levels as those found
in other FAW sequences reported from India. We could only find the two ancestral COIA ‘rice’ and ‘corn’ haplo-
types which are reported from invasive populations of Africa and East Asia. The observed haplotype diversity was
much in line with that found in Africa (Supplementary File, Table 4). So, it is possible that with more sampling
from India, the reported diversity levels get normalized and come more in accordance with those found at other
newly invaded countries.
Two haplotypes found in Indian populations were particularly interesting and represented a hybrid between
the rice and corn strains. The haplotypes appear to originate from gene conversion events by recombination
between the strains. Though, the polymorphisms could be attributed to mutation events, but it is unlikely to
observe as many mutations as shown by these haplotypes specifically in the parsimony informative sites for FAW
strain identification. Recombination in animal mitochondrial DNA, though sporadic, has been observed in
several natural populations and inter-specific crosses33–35. Higher levels of divergence between the haplotypes or
species aid in the identification of these events, which might otherwise remain unnoticed. In the likely scenario
of a gene recombination event, the presence of these haplotypes suggests that inter-strain matings between the
COIA ‘R’ and ‘C’ strains are occurring in the field conditions. But it is important to understand that COIA’R’
strain found in India or other recently invaded countries does not represent the true ancestral ‘R’ strain. Multiple
studies have suggested it to be a hybrid strain as marked by the discordance between Tpi and COIA markers and
by other genome sequencing s tudies18,20,21. Thus, the behavior of this population is not well characterized and
the mating barriers between this population and the ancestral strains are also not yet known. Nevertheless, it
would be fascinating to study the behavior of the inter-strain hybrid COIA haplotypes found in India and future
studies might help us in assessing any potential benefits of these mating events for the evolution of FAW in India.
This is amongst the first studies to demonstrate the genetic diversity of FAW across its entire geographical
range after its recent invasions to other parts of the world. The data suggests that India might be emerging as the
new hotspot for the expansion of FAW particularly for the COIA rice haplotypes. Inter-strain recombination has
also been noticed in India, which opens up a possible new evolutionary trajectory. As FAW has started expand-
ing its host range in India, this study would prove helpful to ascertain the association between host range and
the novel FAW haplotypes detected in India. Future studies would also focus on assessing the control efficacy of
different insecticides and biocontrol agents on the different FAW haplotypes in India. Lastly, this study would
serve as a good reference to track the subsequent evolution and spread of FAW in India as well as the rest of the
demographic range.
Methods
Sample collection, DNA extraction and PCR amplification. 92 FAW specimens were collected from
39 different regions in India and Nepal during the years 2018–2020. The larvae from each collection were stored
in absolute ethanol at − 80 °C until DNA extraction. Genomic DNA was isolated from single larva by using
QIAGEN DNeasy blood and tissue kit, Germany, following the manufacturer’s protocols. The remaining larvae
were kept as voucher specimens at − 80 °C. DNA thus obtained was subjected to PCR amplification using a Bio-
Rad C1000 Thermal Cycler. Each PCR reaction of 50 μL consisted of 5 μL 10X DreamTaq master mix, 2 μL of
10 mM dNTP mix, 1 μL (20 pmol/μL) each of gene-specific forward and reverse primer (COIA: LCO1490 and
HCO2198, 658 bp36; COIB: 891F and 1472R; Tpi gene: 412F and 1140R18), 0.5 μL DreamTaq DNA polymerase
(5 U/μL), 5 μL DNA (50 ng/μL), and 35 μL sterile water. Thermo-cycling parameters used for the study consisted
of an initial denaturation of 94 °C for 5 min, followed by 30 cycles of denaturation at 94 °C for 1 min, anneal-
ing at specific temperatures for 1 min, extension at 72 °C for 1 min. The amplified products were analyzed on
1.5% agarose gel electrophoresis. Each specimen PCR sample was bi-directionally sequenced and checked for
homology, insertions and deletions, stop codons, and frame shifts by using NCBI-BLAST and ORF finder. The
COIA generated sequences showed 100% similarity as S. frugiperda and were then deposited in NCBI GenBank
database and accession number was retrieved for all the populations. Further the sequences and the specimen
details were submitted to the BOLD database and DNA barcodes were generated.
DNA polymorphism analysis. 105 additional mitochondrial COIA sequences deposited from India dur-
ing the year 2018–2020 were retrieved from GenBank. These sequences were aligned along with the sequences
generated at ICAR-NBAIR with MEGA-X ver. 10.1.7 using C lustalW37. The aligned sequences were trimmed
to 460 bp length since this region was commonly present in 183 sequences from India. The rest of the COIA
sequences which did not contain the selected 460 bp region were removed from further analysis. The final list
of COI sequences used for the polymorphism analysis is provided in Supplementary File (Table 1a). Addition-
ally, 163 COI sequences deposited from America, 150 from Africa and 76 from rest of the Asian countries were
retrieved from GenBank and were trimmed to the same length as the Indian sequences and used for polymor-
phism studies. The dataset was divided into four broad categories as (1) America, (2) Africa, (3) India, (4) Asia-II
based on the geographical distribution. These groups were analyzed for descriptive statistics such as nucleotide
Scientific Reports | (2021) 11:7760 | https://doi.org/10.1038/s41598-021-87414-5 9
Vol.:(0123456789)www.nature.com/scientificreports/
diversity, number of haplotypes (H), haplotype diversity (Hd), genetic neutrality tests and mismatch distribution
analysis using DnaSP ver 6.12.0338.
Network plot. Haplotype network plot was constructed using the R package pegas v0.1439,40. The package
uses a parsimony network described by41 for establishing relationship among haplotypes. Each pie represents
a unique haplotype; the radius of the pie is proportional to the number of sequences belonging to a particular
haplotype. We transformed the number of sequences with log2 + 1, to enable optimal visualization of haplotypes
with a single sequence.
AMOVA. MOVA42. Analysis of molecular
Population structure was studied from the alignment file using A
43
variance (AMOVA) was performed using the R package poppr v2.8.6 . The hierarchy for this analysis was based
on four predetermined geographical regions America, Africa, India and Asia-II. The percentage of observed
variance within and between groups was calculated initially among all the regions and then the same analysis
was performed between different combinations of two groups (America and Africa, America and India, America
and Asia-II, Africa and India, Africa and Asia-II, India and Asia-II). The significance of observed variance
between groups was tested by a randomization test with 1000 permutations. This test was performed using the
accompanying R package ade4 v1.7.15 and the function randtest44.
DAPC. A second method discriminant analysis of principal components, was used to further study the popu-
lation structure. This analysis was performed using the R package adegnet v2.1.345,46. This method was applied to
the aligned sequence file to find the extent of discrimination between different predefined groups. The balance
between discrimination power and overfitting was maintained by selecting the optimal number of principal
components for analysis using the a-score optimization test from the function optim.a.score. We have retained
eight principal components as the optimum number based on the a-score optimization test. As there are four
geographical groups, we retained three discriminant functions. Predefined groups were then randomized and
the analysis was repeated with the new randomized data to confirm that discrimination between clusters does
not occur by chance. DAPC analysis was also used to study the level of admixture in the predefined groups.
Samples with less than 50% posterior membership probability were considered admixed while the samples with
more than 50% posterior membership probability were allotted with their respective group.
Received: 25 November 2020; Accepted: 16 March 2021
References
1. Goergen, G., Kumar, P. L., Sankung, S. B., Togola, A. & Tamò, M. First report of outbreaks of the fall armyworm Spodoptera
frugiperda (J E Smith) (Lepidoptera, Noctuidae), a new alien invasive pest in West and Central Africa. PLoS ONE 11, e0165632
(2016).
2. Nagoshi, R. N. et al. Comparative molecular analyses of invasive fall armyworm in Togo reveal strong similarities to populations
from the eastern United States and the Greater Antilles. PLoS ONE 12, e0181982 (2017).
3. Nagoshi, R. N., Goergen, G., Plessis, H. D., van den Berg, J. & Meagher, R. Genetic comparisons of fall armyworm populations
from 11 countries spanning sub-Saharan Africa provide insights into strain composition and migratory behaviors. Sci. Rep. 9,
1–11 (2019).
4. Ganiger, P. C. et al. Occurrence of the new invasive pest, fall armyworm, Spodoptera frugiperda (J.E. Smith) (Lepidoptera: Noctui-
dae), in the maize fields of Karnataka, India. Curr. Sci. 115, 621 (2018).
5. Deshmukh, S. et al. First report of the fall armyworm, Spodoptera frugiperda (J E Smith) (Lepidoptera: Noctuidae), an alien invasive
pest on maize in India. Pest Manag. Hortic. Ecosyst. 24, 23–29 (2018).
6. Shylesha, A. N. et al. Studies on new invasive pest Spodoptera frugiperda (J. E. Smith) (Lepidoptera: Noctuidae) and its natural
enemies. J. Biol. Control 32, 145–151 (2018).
7. Swamy, H. M. M. et al. Prevalence of “R” strain and molecular diversity of fall army worm Spodoptera frugiperda (J.E. Smith)
(Lepidoptera: Noctuidae) in India. Indian J. Entomol. 80, 544 (2018).
8. Chormule, A. et al. First report of the fall armyworm, Spodoptera frugiperda (J. E. Smith) (Lepidoptera, Noctuidae) on sugarcane
and other crops from Maharashtra, India. J. Entomol. Zool. Stud. 7, 114–117 (2019).
9. Visalakshi, M. et al. Report of the invasive fall armyworm, Spodoptera frugiperda (J.E. Smith) (Lepidoptera: Noctuidae) and its
natural enemies on maize and other crops from Andhra Pradesh, India. J. Entomol. Zool. Stud. 7, 1348–1352 (2019).
10. Srikanth, J. et al. First report of occurrence of fall armyworm Spodoptera frugiperda in sugarcane from Tamil Nadu, India. J. Sug-
arcane Res. 8, 195–202 (2019).
11. Babu, S. R. et al. Report of an exotic invasive pest the fall armyworm, Spodoptera frugiperda (J.E. Smith) on maize in Southern
Rajasthan. J. Entomol. Zool. Stud. 7, 1296–1300 (2019).
12. Pashley, D. P. Host-associated genetic differentiation in fall armyworm (Lepidoptera: Noctuidae): a sibling species complex?. Ann.
Entomol. Soc. Am. 79, 898–904 (1986).
13. Pashley, D. P., Sparks, T. C., Quisenberry, S. S., Jamjanya, T. & Dowd, P. F. Two fall armyworm strains feed on corn, rice and
Bermuda-grass. La. Agric. 30, 8–9 (1987).
14. Pashley, D. P. & Martin, J. A. Reproductive incompatibility between host strains of the fall armyworm (Lepidoptera: Noctuidae).
Ann. Entomol. Soc. Am. 80, 731–733 (1987).
15. Lima, E. R. & McNeil, J. N. Female sex pheromones in the host races and hybrids of the fall armyworm, Spodoptera frugiperda
(Lepidoptera: Noctuidae). Chemoecology 19, 29–36 (2009).
16. Levy, H. C., Garcia-Maruniak, A. & Maruniak, J. E. Strain identification of Spodoptera frugiperda (Lepidoptera: Noctuidae) insects
and cell line: PCR-RFLP of cytochrome oxidase C subunit-I gene. Fla. Entomol. 85, 186–190 (2002).
17. Nagoshi, R. N. The fall armyworm triose phosphate isomerase (Tpi) gene as a marker of strain identity and interstrain mating.
Ann. Entomol. Soc. Am. 103, 283–292 (2010).
Scientific Reports | (2021) 11:7760 | https://doi.org/10.1038/s41598-021-87414-5 10
Vol:.(1234567890)www.nature.com/scientificreports/
18. Nagoshi, R. N. et al. Genetic characterization of fall armyworm infesting South Africa and India indicate recent introduction from
a common source population. PLoS ONE 14, e0217755 (2019).
19. Nagoshi, R. N. et al. Southeastern Asia fall armyworms are closely related to populations in Africa and India, consistent with
common origin and recent migration. Sci. Rep. 10, 1–10 (2020).
20. Zhang, L. et al. High-depth resequencing reveals hybrid population and insecticide resistance characteristics of fall armyworm
(Spodoptera frugiperda) invading China; https://doi.org/10.1101/813154 (2019).
21. Yainna, S. et al. Genomic balancing selection is key to the invasive success of the fall armyworm; https://d
oi.o
rg/1 0.2 2541/a u.1 6036
3803.32074105/v1 (2020).
22. Tay, W. T. et al. Global FAW population genomic signature supports complex introduction events across the Old World. bioRxiv;
https://doi.org/10.1101/2020.06.12.147660 (2020).
23. South, A. rworldmap: a new R package for mapping global data. R J. 3(1), 35–43 (2011).
24. Wickham, et al. Welcome to the tidyverse. J. Open Source Softw. 4(43), 1686 (2019).
25. Nagoshi, R. N. et al. Using haplotypes to monitor the migration of fall armyworm (Lepidoptera: Noctuidae) corn-strain popula-
tions from Texas and Florida. J. Econ. Entomol. 101, 742–749 (2008).
26. Pedersen, T. L. patchwork: the composer of plots; https://CRAN.R-project.org/package=patchwork (2020).
27. Yan, L. ggvenn: draw Venn diagram by ‘ggplot2’; https://CRAN.R-project.org/package=ggvenn (2020).
28. Marchese, C. Biodiversity hotspots: a shortcut for a more complicated concept. Glob. Ecol. Conserv. 3, 297–309 (2015).
29. Myers, N., Mittermeier, R. A., Mittermeier, C. G., da Fonseca, G. A. B. & Kent, J. Biodiversity hotspots for conservation priorities.
Nature 403, 853–858 (2000).
30. Behere, G. T., Tay, W. T., Russell, D. A., Kranthi, K. R. & Batterham, P. Population genetic structure of the cotton bollworm Heli-
coverpa armigera (Hübner) (Lepidoptera: Noctuidae) in India as inferred from EPIC-PCR DNA markers. PLoS ONE 8, e53448
(2013).
31. Chowda-Reddy, R. et al. Bemisia tabaci phylogenetic groups in India and the relative transmission efficacy of tomato leaf curl
Bangalore virus by an indigenous and an exotic population. J. Integr. Agric. 11, 235–248 (2012).
32. Naik, V. C. B. et al. Evidence for population expansion of cotton pink bollworm Pectinophora gossypiella (Saunders) (Lepidoptera:
Gelechiidae) in India. Sci. Rep. 10, 1–11 (2020).
33. Ciborowski, K. L. et al. Rare and fleeting: an example of interspecific recombination in animal mitochondrial DNA. Biol. Lett. 3,
554–557 (2007).
34. Andolfatto, P., Scriber, J. M. & Charlesworth, B. No association between mitochondrial DNA haplotypes and a female-limited
mimicry phenotype in Papilio glaucus. Evolution 57, 305 (2003).
35. Gantenbein, B., Fet, V., Gantenbein-Ritter, I. A. & Balloux, F. Evidence for recombination in scorpion mitochondrial DNA (Scor-
piones: Buthidae). Proc. R. Soc. B Biol. Sci. 272, 697–704 (2005).
36. Hebert, P. D. N., Cywinska, A., Ball, S. L. & Dewaard, J. R. Biological identifications through DNA barcodes. Proc. R. Soc. Lond. B
Biol. Sci. 270, 313–321 (2003).
37. Kumar, S., Stecher, G., Li, M., Knyaz, C. & Tamura, K. MEGA X: molecular evolutionary genetics analysis across computing
platforms. Mol. Biol. Evol. 35, 1547–1549 (2018).
38. Rozas, J. et al. DnaSP 6: DNA sequence polymorphism analysis of large data sets. Mol. Biol. Evol. 34, 3299–3302 (2017).
39. R Core Team. R: a language and environment for statistical computing (R Foundation for Statistical Computing, 2020).
40. Paradis, E. pegas: an R package for population genetics with an integrated-modular approach. Bioinformatics 26, 419–420 (2010).
41. Templeton, A. R., Crandall, K. A. & Sing, C. F. A cladistic analysis of phenotypic associations with haplotypes inferred from restric-
tion endonuclease mapping and DNA sequence data. III. Cladogram estimation. Genetics 132, 619–633 (1992).
42. Excoffier, L., Smouse, P. E. & Quattro, J. M. Analysis of molecular variance inferred from metric distances among DNA haplotypes:
application to human mitochondrial DNA restriction data. Genetics 131, 479–491 (1992).
43. Kamvar, Z. N., Tabima, J. F. & Grünwald, N. J. Poppr: an R package for genetic analysis of populations with clonal, partially clonal,
and/or sexual reproduction. PeerJ 2, e281 (2014).
44. Dray, S. & Dufour, A.-B. The ade4 package: implementing the duality diagram for ecologists. J. Stat. Softw. 22, 1–20 (2007).
45. Jombart, T., Devillard, S. & Balloux, F. Discriminant analysis of principal components: a new method for the analysis of genetically
structured populations. BMC Genet. 11, 94 (2010).
46. Jombart, T. adegenet: a R package for the multivariate analysis of genetic markers. Bioinform. Oxf. Engl. 24, 1403–1405 (2008).
Acknowledgements
The lead author was supported by funding from DST-INSPIRE Faculty Fellowship, Government of India while the
study was funded by CABI, South-Asia-India under the project “Emergency response to address Fall Armyworm
(Spodoptera frugiperda) in India through deployment of proven IPM Technologies for its management. CABI
is an international intergovernmental organisation, and we gratefully acknowledge the core financial support
from the member countries (and lead agencies) including the United Kingdom (Foreign, Commonwealth &
Development Office), China (Chinese Ministry of Agriculture and Rural Affairs), Australia (Australian Centre
for International Agricultural Research), Canada (Agriculture and Agri-Food Canada), Netherlands (Directorate
General for International Cooperation), and Switzerland (Swiss Agency for Development and Cooperation). See
https://w
ww.c abi.o
rg/a bout-c abi/w
ho-w
e-w
ork-w
ith/k ey-d
onors/ for full details. The authors are thankful to the
Director, ICAR-NBAIR, Bengaluru, India for providing necessary facilities to carry out the research.
Author contributions
N.N., M.G., A.T.R., S.R.S. conducted the experiments and performed the analysis. N.N. and M.G. drafted the
manuscript. N.N., T.V., G.R.G., M.M., C.M., B.N. made substantial contributions to the conception and design
of the experiments. All authors reviewed the manuscript.
Competing interests
The authors declare no competing interests.
Additional information
Supplementary Information The online version contains supplementary material available at https://doi.org/
10.1038/s41598-021-87414-5.
Correspondence and requests for materials should be addressed to T.V.
Reprints and permissions information is available at www.nature.com/reprints.
Scientific Reports | (2021) 11:7760 | https://doi.org/10.1038/s41598-021-87414-5 11
Vol.:(0123456789)www.nature.com/scientificreports/
Publisher’s note Springer Nature remains neutral with regard to jurisdictional claims in published maps and
institutional affiliations.
Open Access This article is licensed under a Creative Commons Attribution 4.0 International
License, which permits use, sharing, adaptation, distribution and reproduction in any medium or
format, as long as you give appropriate credit to the original author(s) and the source, provide a link to the
Creative Commons licence, and indicate if changes were made. The images or other third party material in this
article are included in the article’s Creative Commons licence, unless indicated otherwise in a credit line to the
material. If material is not included in the article’s Creative Commons licence and your intended use is not
permitted by statutory regulation or exceeds the permitted use, you will need to obtain permission directly from
the copyright holder. To view a copy of this licence, visit http://creativecommons.org/licenses/by/4.0/.
© The Author(s) 2021
Scientific Reports | (2021) 11:7760 | https://doi.org/10.1038/s41598-021-87414-5 12
Vol:.(1234567890)You can also read