A STUDY OF HUMOUR ADVERTISEMENT AND ITS INFLUENCE ON CONSUMER PURCHASHING DECISION: EVIDENCE FROM MALAYSIA
←
→
Page content transcription
If your browser does not render page correctly, please read the page content below
International Journal of Accounting & Business Management
Vol. 5 (No.2), November, 2017
ISSN: 2289-4519
                                                                                             www.ftms.edu.my/journals/index.php/journals/ijabm
DOI: 24924/ijabm/2017.11/v5.iss2/34.52
               This work is licensed under a
               Creative Commons Attribution 4.0 International License.

    Research Paper

     A STUDY OF HUMOUR ADVERTISEMENT AND ITS INFLUENCE ON
         CONSUMER PURCHASHING DECISION: EVIDENCE FROM
                          MALAYSIA

                                                      Sashi Kumar Kovindasamy
                                                            MBA Graduate
                                              Lords Ashcroft International Business School
                                                     Anglia Ruskin University, UK
                                                       sashiekumar@gmail.com

                                                    Emmanuel Abiodun Ogundare
                                                           Senior Lecturer
                                            School of Accounting and Business Management
                                                       FTMS College, Malaysia
                                                       Emmanuel@ftms.edu.my

                                                               ABSTRACT

    The main aim of the study is to analyse the impact of humorous advertisement on the purchasing
    decision of Malaysian consumers. The background of the study proved that humour advertisement has
    always remained important to the marketers. Furthermore, it has also been observed that humour
    advertisement is also studied vastly by the previous researchers in different contexts using different
    strategies. However, the research gaps identified above has revealed a lacking of research studies in
    the context of Malaysia. The study also found to be significant because the previous studies have
    highlighted that a Malaysian advertisement agency a huge amount of money on humour
    advertisement, but due to lack of studies on humour advertisement and buying behaviour the
    marketers and the companies are unable to determine the significance of their spending. The objective
    of the research has been fulfilled by testing the hypothesis of the study. The questionnaire based
    survey has been undertaken upon the sample of 360 respondents. Furthermore, data analysis has
    been carried forward with the help of SPSS through regression and correlation. The results reveal
    that significant relationship exists between the independent variable (humour advertisement) and all
    the dependent variables (Purchase Decision, Attitude towards Brand, Attitude towards Quality,
    Attitude towards Presentation, and Attitude towards Entertainment) as the value of sig. appeared to
    be less than 0.05. However, strong correlation only exists between humour advertisement and attitude
    towards advertisement and consumer purchase decision.

    .
    Key Terms: Humour Advertisement, Purchase Decision, Brand, Quality, Presentation,
    Entertainment, Attitude

    1.          INTRODUCTION

    ISSN: 2289-4519                                                      Page 34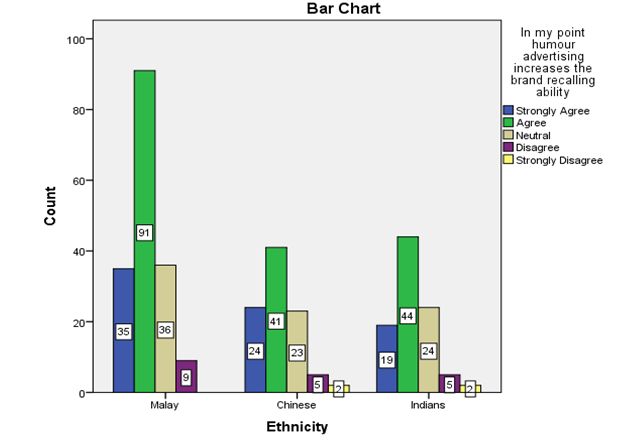
In the view of Powers, Advincula, Austin, Graiko and Snyder (2012), the advertising
comes from a Latin word which means “adventure” which means “turning the mind
towards”. Therefore, marketers use advertisements as a psychological tool to influence the
decisions of the consumers. In the same manner, the advertisement is an important vehicle for
marketing also aims at persuading the potential customers. Similarly, Hartmann and
Apaolaza-Ibáñez (2012) stated that to achieve the ultimate goal of persuading customers, the
advertisement is one of the essential tools used by the Malaysian brands. In the view of Sabri
(2012), most of the most of the consumer products that serve the global markets use the
element of humour in their ad campaigns. However, the some of these types of campaigns
have remained unsuccessful since one humour message does not fit in a cross-culture manner.
One of the research conducted on humour advertisement in Malaysia revealed that the
responses of the consumers towards humorous advertisements have rained limited, despite
the fact that companies spent about US$ 119 million in 2013 on humorous advertisements
(Chang and Chang, 2014). Kim, Kim and Goh (2011) stated that most of the humour
advertisement in Malaysia is based on instinct rather than on evidence, due to which the
consumers are unable to decipher the message that the company aims to send using humour
advertisement. In the same manner, Eisend (2011) suggested that there are various factors
that affect the humour advertisements such as demographics, psychographics, cultural and
behavioural which includes familiarity with the brand. In the same manner, the research
conducted by Vohs, Baumeister, Schmeichel, Twenge, Nelson, and Tice (2014) showed that
there are various elements that reflect research scope on the humour advertisement in
Malaysia. These elements also include the 7Cs such as culture, categorisation, content,
context, consumer, consequences and complexities.

Research rationale

        Sabri (2012) indicated that some studies conduct on humour advertisement in
Malaysia have used different variables to responses of the consumer towards such
advertisement. For example, the research conducted by Powers, Advincula, Austin, Graiko
and Snyder (2012 on humour advertisement uses brand awareness, brand perception, the
content of the message, and the message context as the main research variables while
dependent variable of the research was consumer purchase decision. The study used
interview technique to gather the data from the respondents. Likewise, the survey conducted
by Kim, Kim and Goh (2011) on the impact of sarcastic humour on the buying behaviour of
the consumers. The study showed that humour tends to relax the audience, develops a
connection with the customer and helps in breaking the ice. Due to this reason, most of the
public speakers also tend to start their conversation with a light joke so that a frank or a
familiar relationship can be developed. Ali, Kapoor and Moorthy (2010) showed that 24% of
the advertisement is displayed in prime time uses humour advertisement, in the same manner,
about 35% of the advertisement on the aired through radios used humour advertisement. Most
of the studies have also shown that advertisement containing humour displayed effectively
can attract more customers than advertisements that do not. On the contrary, the study
presented by Eisend, Plagemann and Sollwedel (2013) showed that since humour is a
complex subject, therefore, there are various factors that tend to affect the efficiency of the
humour advertisement.

         The research conducted by Islam and Rahman (2011) showed that although different
studies have been conducted on the topic of humour advertisement, however, none of the
studies have been conducted in the context of Malaysia, using the two main variables i.e.
humour advertisement and consumer purchase decision. Therefore, the current study aims at
fulfilling the research above gap by researching Malaysian consumers. Most of the previous
researches conducted on Malaysian humour advertisement usually had a sample size of 150-

ISSN: 2289-4519                             Page 35
200 respondents, due to small sample size, the previous studies were unable to generalise the
results to the overall population, therefore, and this study has filled in the above gap by taking
a larger sample size.
Research objectives
The study aims to accomplish the following objectives:
1. To explain the concept of the humour advertisement;
2. To explore the process of consumer purchase decision;
3. To investigate the difference between ethnic groups (Malay, Chinese and Indian) on
their attitude towards the brand, attitude towards quality, presentation and
entertainment of humour advertisement;
4. To investigate the relationship between attitudes and purchase intentions for various
ethnic groups (Malay, Chinese and Indian) when view and respond towards humour
advertisements.
2. LITERATURE REVIEW
Large portions of the most vital advertisement campaigns around tend to be funny in
one way or another. Sponsors utilise this technique to pull in clients to their item. The way to
a funny advertising campaign is assuring the humour is suitable for both item and client.
Crowds jump at the chance to be entertained. Individuals will give careful consideration to a
humorous business than a genuine or extreme one (Chan, 2011). The harmony amongst
interesting and unpalatable can frequently be sensitive, and an advertiser must be certain the
beneficial outcomes exceed the negative points before an ad can be introduced. Another point
to consider when using humour in advertising is that some things are funny to some people, it
is not a must that one funny ad is funny for another person too. The market to target and the
audience to target should dependably be considered (Sabri, 2012). In the view of Hartmann
and Apaolaza-Ibáñez (2012) the purchasing decision of the consumer's plays is largely
dependent upon their willingness to purchase particular products. Consumers willing to
purchase particular products would be more likely to make decisions which would result in
them paying the required amount of money to purchase the desired products. On the other
hand, it has been stated by Ali, Kapoor and Moorthy (2010) that the purchasing power of the
consumers also has a substantial impact on their purchasing decision-making process. The
income level of the consumers determines the products that they can afford to buy and those
that they cannot. Furthermore, individuals belonging to lower income groups are more
inclined towards buying those products that are considered as necessary for their survival
rather than spending on luxurious items.
One of the theories that can be linked with the behaviour of the consumers is the
theory of reasoned action. As stated by Kim, Kim and Goh (2011) theory of reasoned action
illustrates that the behaviour of the consumers is based on the particular outcome that they are
expected to achieve. Therefore, customers are expected to make choices which are in their
best interest. Furthermore, the theory suggests that consumer only takes specific actions when
they are expecting equally specific results. Therefore, it is imperative for the marketers to
provide customers with the reason for making decisions to buy their products and services.
ISSN: 2289-4519 Page 36Figure 1: Effect of Intention and Attitude on Consumers
Eisend (2011) researched how humour works in the advertisement and its effect on
the attitude of the consumers towards the brand. The variables that were used in the study
were humorous advertisement and impact on consumer attitude. The sample size which was
adopted was 601. Quantitative methodology was adopted to derive the desired outcomes of
the study. Tests such as structural equation model and meta-analysis correlation were applied
to analyse the data which was obtained from the respondents. The findings which were
obtained through this analysis indicated that humour leads towards the reduction in negative
cognitions which are related to ads. On the other hand, Stathopoulou, Borel, Christodoulides,
& West (2017) stated that the primary reason behind that is the fact that humorous
advertisement serves as a source of distraction from counter argumentation. The findings
further illustrated that humour enforces a strong impact on generating the positive attitude of
the consumers towards the advertisement of a particular product or service. The
recommendation that has been linked to the findings indicate that humour within
advertisement campaigns need to be involved to overcome shortcomings that are present
within advertisements such as weak brand arguments, improper presentation or even adverse
information which can have a negative impact on consumer purchase decision.
Moreover, De Pelsmacker and Geuens (2015) suggested that further research needs to
be carried out to discover further aspects concerning the benefits of humour advertisement on
consumer attitude towards the brand and its quality. In addition to that, Chang and
Bandyopadhyay (2014) stated that humour in advertisement possesses a high attraction
ability which encourages customers to emphasise more on the message. Furthermore, high-
quality and develops high-quality product image in the minds of consumers. However, the
message which is being delivered in these advertisements needs to be of a positive nature. In
contrast to the above findings Swani, Weinberger and Gulas (2013) researched the impact of
violent humour on consumer purchase intention. The independent variable in this study is
violent humour and the dependent variable is purchase decision. A quantitative approach was
used to obtain the findings along with the application of the structural equation model. The
findings of the results were based on the reaction of female regarding the violent nature of
advertisement along with the differences between the reaction of male and females regarding
humorous advertisement. The findings that were derived indicated that there is a difference
between the perception of the male and female audience and the ways in which they react
towards these kinds of advertisements. Females are generally found to be giving poor
feedback regarding violent advertisements as they perceive it to be the violation of social
norms. Contrary to the findings of Swani, Weinberger and Gulas (2013) Petrescu,
Korgaonkar, and Gironda (2015) found that male consumers are found to have more positive
response towards violent humour within advertisements. The reason that has been identified
in this respect is concerned with the difference in their perception regarding violent humour
ISSN: 2289-4519 Page 37within advertisements. The male consumer does not mind viewing violent humour within
advertisements as it provides them joy and excitement as opposed to the female audience. On
the other hand, the research conducted by Senthilkumar and Venkatesh (2017) recommended
that while developing violent humour advertisements, the marketers need to develop different
kinds of ads for both male and female consumers to create a positive impact on consumer
buying decision. Huanga, Su, Zhou and Liu (2013) researched the attitude of the consumers
towards viral ads and expansion of traditional models of advertising to Interactive advertising
models. The variables that are part of this research are traditional and interactive
advertisements.
A qualitative approach was adopted by the researcher to obtain the desired level of
findings. Development of hypothesis and statistical models was also undertaken to support
the analysis. The findings which were obtained by the quantitative methodology indicated
that more and more organisations are moving towards the use of interactive advertising which
is different from traditional modes of advertisement. Some of the examples of the use of
interactive advertisement techniques used by the firms these days are the use of social media
along with the use of humour in advertisements.In the same manner, the findings gained by
Chang and Bandyopadhyay (2014) on humour advertisement and brand quality further
illustrated that humorous advertisement is beneficial to create affection for the brands. As a
result of that, they provide the valuable source of interactive advertisement for the
organisations. However, one of the recommendations that are linked to these findings made
by Khattak and Baig (2016) indicates that managers need to find an appropriate balance
between the image of their brand and the need to reach out towards the customers with the
content that would be desirable for the target audience. In addition to that, Malik, Ghafoor,
and Iqbal (2014) stated that managers need to take into consideration not only the purchase
intention of the consumers, but they also need to be aware of their intentions regarding
interactive advertisement technique. Limbu, Huhmann and Peterson (2012) researched
examining humour and endorser effects on responses of the consumers towards direct to
consumer advertising. The variables that have been used in this research are humour and
endorser effects along with consumer responses towards direct-to-consumer advertisement. A
sample size of 420 was used for this study. Quantitative analysis was used to obtain the
intended findings. The statistical tests that were implemented during this study were mean,
standard deviation along with MANOVA. The findings that were obtained by this
methodology indicate that humour or a celebrity endorsement improves the quality of ads and
the overall attitude of the brands. Furthermore, it also enhances brand recall along with copy
point recall of the consumers. Nevertheless, Chang and Bandyopadhyay (2014) found that an
expert endorser is believed to be more effective in terms of improving the overall credibility
of the ads. On the other hand, the results found by Malik Ghafoor, and Iqbal (2014) further
indicated that collaboration between humour, endorser and involvement was evident
illustrating that the celebrity endorser in collaboration with humour together was able to
generate more positive responses in comparison to other combinations of advertisement and
promotion tools when the product involvement was low. Consequently, the recommendations
that have been provided by findings are that humour and celebrities need to be involved by
the marketers on a consistent basis within their advertisements to attract customers. However,
the outcomes have also suggested that humour and celebrity endorsements may not always
prove to be useful in the long run.
ISSN: 2289-4519 Page 38Figure 2: Conceptual Framework
2.1. Hypotheses Development
H1: There is a significant relationship between brand and purchase decision in
humour advertisement - The hypothesis has been taken from the study conducted by Chan
(2011) on consumer purchase decision. The results of the study showed that humour
advertisement tends to influence the purchase decision of the consumers by enhancing the
image of the brand positively. According to Chang and Chang (2014) research, the output
showed that humour advertisement has great impacts and influences on consumer purchase
decision. Meanwhile, respondents feel the connection towards products and services through
brand perception are essential.
H2: There is a significant relationship between quality and purchase decision in
humour advertisement - Previous research by Chang and Bandyopadhyay (2014) described
that humours advertisement which contains good quality and positivity towards product
advertiser has a positive relationship with consumer purchase decision. Paquette (2013)
depicted humorous advertisement play a very important role in attracting customer's attention
and influencing their decision. Therefore, humours advertisement seems to work effectively
as long as it contains quality characteristic.
H3: There is a significant relationship between entertainment and purchase decision in
humour advertisement - Teixeira, Picard, & Kaliouby (2013) highlighted in their research that
entertainment in humour advertisement is an effective persuasive method which can bring a
smile on audience’s faces, and it is a highly associated factor with consumer purchase
decision.
H4: There is a significant relationship between presentation and purchase decision in
humours advertisement - Verma (2015) depicts that effective advertisement influences
consumer purchase decision, and the advertisement which includes humour and great content
seem to attract more people to make purchases.
3. RESEARCH DESIGN AND DEVELOPMENT
Philosophy of the research is related to writing and interpretation of the knowledge
gained after conducting the study. Philosophies of the research are categorised as positivism
approach, interpretivism and realism (Saunders and Lewis, 2012). Each of the above mention
philosophy has its model, which is known as the research paradigm. According to Saunders
ISSN: 2289-4519 Page 39(2011), positivism is the oldest and widely used philosophy. However, the usage of
philosophy depends upon the nature of the research. Positivism uses a quantitative research
approach by testing the hypothesis drawn from the theories. The positivism research
paradigm is used when the research aims at discovering the relationships that can be
generalised to a population. Dell, Era and Landoni (2014) added that in a positivism
approach, the subjective experience and the meanings of the behaviours could be disregarded
since positivism approach only studies the objective features of an action.
The three types of research designs are explanatory, exploratory and descriptive. As
the word suggest, the exploratory research design is used when the variables of the research
are unexplored because of the new problem such as the decline in sales, high turnover,
consumer response towards a new product or the importance business process re-engineering
(Gray, 2013). On the other hand, the descriptive research strategy is used when the key
variables of the study have already been explored such as analysing the trends in downsizing
in the last ten years. The impact of previous product recalls on the share price of the company
etc. whereas, explanatory research design is utilized when both the variables as well as the
association between them has been explored and tested in the form of theory, but the aim of
the researcher is to test the relationship between the variables in a new context (Creswell and
Poth, 2017). Therefore, in the current research the explanatory design of research will be
applied because, the main variables of the research i.e. humour advertisement and consumer
buying behaviours have already been explored in previous studies such done by Huanga, Su,
Zhou and Liu (2013) Eisend (2011), and Limbu, Huhmann and Peterson (2012). In the same
manner, most of the studies have also tested the relationship between the two variables such
as the study conducted by Yoon and Tinkham (2013) showed a positive and significant
impact of humorous advertisement on the purchase decision of consumers. Therefore, the
current research aims at testing the similar relationship between the humour advertisement
and consumer purchase decision in a different context, i.e. Malaysia using quantitative
approach.The study employed the use of both primary and secondary sources of data
collection techniques. The primary data collection technique has been used for data analysis;
while the secondary sources of data collection are used to support the analysis and for
explaining concepts with the help of theories and definitions. Under primary research
method, the questionnaire technique has been adopted in the study, while for secondary data,
the previously published research is considered. In the same manner, the research has
collected quantitative data. The quantitative data has been collected from the survey analysis
using the questionnaire. The details of the questionnaire are discussed in the next heading.
The tools which are used by the researcher for collecting or recording the data is
called data collection instrument. Different instruments are used for collecting qualitative and
quantitative data (Burrell and Morgan, 2017). The qualitative tools of data collection include
in-depth interviews from the respondents using open-ended questionnaires, online forums,
where an open debate is held between the respondents, focused group analysis, under which
the actions, views, reactions, and the comments of the respondents is judged. In the same
manner, other tools of qualitative data collection include web chat surveys through which the
interview from the respondents is done using the web forum (Khan, 2014). Likewise, the
tools used in quantitative studies include face-to-face surveys, where, the respondent is given
a survey questionnaire and is asked to fill it. The other includes the self-administered
questionnaire, telephonic, postal or emails (Churchill, 2014). In the current research, the
close-ended questionnaire will be used as a tool for data collection. The questionnaire has
been divided into seven sections; the first is about demographics, while the rest of the section
consists of statements related to the dependent and independent research variables. The
questionnaire of the research will be developed using five point’s Likert scale; the five
options include:
ISSN: 2289-4519 Page 401-Strongly Disagree
2- Disagree
3-Neutral
4-Agree
5. Strongly Agree
With the help of questionnaire instrument, different questions related to the dependent
and independent research variables were asked and the respondents gave answers based on
the Likert scale. The population of Malaysia was estimated at 31.7 million persons
(Department of Statistics Malaysia, 2016). As this study specifically looks at the three ethnic
groups, there is 68.6 percent of Bumiputera ethnic (Malay), followed by Chinese (23.4%),
Indians (7.0%) and others (1.0%). The percentage of non-Malaysian citizen was at 10.3
percent out of total population of Malaysia (Department of Statistics Malaysia, 2016). The
sample size was predetermined by the consideration of the pseudo factorial design used in
this study. This study will use 3 ethnic groups (Malay, Chinese and Indian) x 4 variables
(purchase intention, attitude towards the brand, and attitude towards quality, presentation and
entertainment of humour advertisement) factorial design. A minimum of 30 respondents and
maximum 50 respondents per cell are required (Malhotra, 2004), meaning that there will be a
requirement of minimum 360 respondents needed (3 ethnic groups x 4 variables x 30
respondents).In the view of McMillan and Schumacher (2014), sampling is defined as the
process of selecting different units from a population having a common interest, so that by
studying the sample, the results obtained can be generalised to the overall population. The
sampling techniques are categorised as probability sampling and non-probability sampling
(Creswell 2013).
The data were analysed using the statistical software called SPSS; the software helped
in generating charts and graphs and in carrying out different statistical tests that seem
necessary for the study. Using the SPSS v. 22.0, the different test that will be carried out
includes descriptive statistics, which helped in analysing the central tendency of the gathered
data, reliability analysis, frequency analysis, correlation analyses and regression analysis. The
correlation analysis was also helpful in determining the direction of the dependent and
independent variables, while the regression analysis will be estimating the impact of one
variable on the other and the sig. The value obtained from the regression analysis has helped
in testing the hypothesis of the research. The model of regression that will be tested in the
research is shown as under:
From the above equation, it can be observed that buyer decision making and attitudes
towards the brand, quality, presentation and entertainment are the dependents. Whereas, α is
the value of constant and β represents the coefficient of humour advertisement. The change in
buyer decision making due to humour advertisement is determined by the value of β.
ISSN: 2289-4519 Page 414. RESULT AND DISCUSSION
4.1. Demographic Analysis
Gender - As shown on the figure 1 below, there were more female participants than
male. 52.22% of the respondents were female, while 47.78% were males.
Figure 3: Gender Analysis
Age - The age of the respondents was divided into three categories shown on the
figure 2 below, i.e. between 18-24, 25-31 and 32-28. It can be seen that 28% of the
respondents belong to the age group of 36% belongs to the age group of 25-31, while 36% of
the respondents belong to the age group of 32-38 years. Therefore, it can be concluded that
most of the respondents belong to the mature age group, i.e. in between 25-38. One of the
advantages of having a mature age group is that respondents of this age are well aware of the
brands in the market and has developed a strong perception of the brand in terms it's
packaging, quality and other attributes, thus, it can be stated that the study has been able to
get mature and sensible responses from well-informed people.
Figure 4: Age Analysis
Ethnicity - The chart 3 below showed the distribution of ethnicity where the
respondents were divided among three ethnic groups namely Malay, Indians and Chinese. It
can be deduced from the chart that 47% of the respondents were Malays, 28% were Chinese,
while 26% were Indians. Thus, it can be stated that the research mostly reflected the
viewpoints, Malay respondents, however, due to the presence of Chinese and Indian
ISSN: 2289-4519 Page 42participants as well, it can be stated that a diversified perception has been obtained and
revealed in the research about the effect of humour advertisement.
Figure 5: Ethnicity Analysis
4.2. Descriptive Analysis
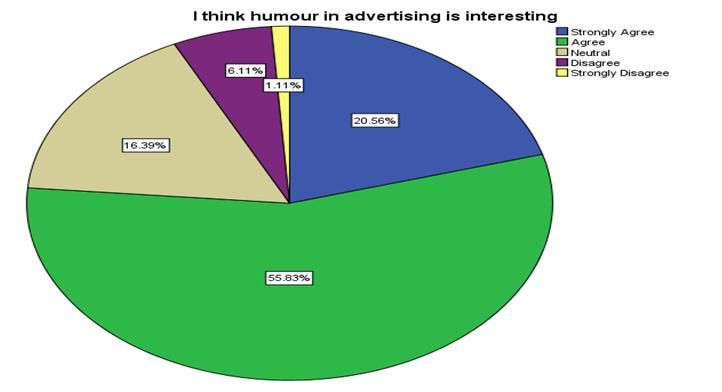
Interest towards humour advertisement - As shown on figure 4 below, there were
five questions asked from the respondents about their views on humour advertisement. The
responses to the first question revealed that about 47% of the sample population believed that
humour advertisement is very interesting. Likewise, about 55% agreed to the question. In the
same manner, the results showed that 6% of the respondents disagreed while 1% strongly
disagreed with the question about humour advertisement. Therefore, it can be deduced that
most of the respondents found humour advertisement an interesting marketing concept.
Figure 6: Interest towards Humorous ads
Reliability Test - Test for reliability is carried out to check the internal consistency of
the data. The consistency of the internal data is measured through the value of Cronbach’s
alpha, which checks the inter-correlation of the major research variables. The value of
Cronbach’s alpha is also dependent upon the number of items, as it is stated that fewer item
leads towards small value, while more items lead towards higher values (Mayers, 2013). The
value reviles whether all the variables included in a study are reliable or otherwise. It is also
stated that the value of alpha that is greater than 0.5 indicates that the items in the study are
reliable and can be interpreted (Polit, 2013).
ISSN: 2289-4519 Page 43Table 1: Reliability Analysis
Variable Cronbach’s Alpha Number of Items
Humour Advertisement .814 5
Consumer Purchase Behaviour .759 5
Attitude Towards Quality .736 5
Attitude towards Entertainment .781 5
Attitude Towards Presentation .733 5
The table above showed the number of items included in each variable and their
respective alpha values. It can be seen that the number of items under each variable is 5.
However, alpha values are different for each variable. The most reliable values among all
have appeared to be Humour Advertisement having the value of about 0.814, i.e. 84%.
Similarly, the least reliable variable is Attitude towards Presentation having the alpha value
of about 0.733, i.e. 73.3%. While the reliabilities of the other elements lie in between .736-
.781. Thus, it can be stated that all the variables of the research have appeared to be highly
reliable since the value of aloha for all the items and variables is greater than 0.5. Thus, after
gaining reliable data, the study can apply other tests on the data set to test the hypothesis of
the research.
Crosstabs Analysis
The cross tab analysis is carried out to compare the responses of the individuals with
their demographic categories. The chart above represents the distribution of ethnic group in
brand recall. It can be seen that majority of the Malays have agreed with the statement, while,
other ethnic groups have also agreed with the statement. The chart below represents the
distribution of ethnic group in brand recall. It can be seen that majority of the Malays have
agreed with the statement, while, other ethnic groups have also agreed with the statement.
Figure 7: Ethnicity and Brand Recall
Correlation Analysis
The test for correlation shows the direction and the movement of the variables. The
correlation is determined by the value of Pearson Correlation, while the sig. Value shows
whether the movement between them is significant or not. The relationship between the two
variables is said to very strong if the value of Pearson Correlation lies in in-between .80-1.
ISSN: 2289-4519 Page 44Similarly, the strong correlation exists between the variables if the value of correlation lays
in-between .60-.79, while moderate correlation exists if the value of correlation is about .50-
59. In the same manner, positive value shows that both the variables are directly proportional,
while negative sign shows that due to increase in one variable the other variable tends to
decrease by the same number (Cohen, Cohen, West, & Aiken, 2013).
The Table 2 in the appendixes showed that humour advertisement has shown
significant correlation with all the other variables in the study. The strength of the relation
between them has differed. As humour advertisement has shown very strong association with
the attitude towards entertainment as the value of Pearson Correlation has appeared to be
.751. While on the other hand, the association of humour advertisement with purchase
decision has appeared to be .625 which means moderate relationship exists between the two
variables. In the same manner, humour advertisement has shown the weak association with
the attitude towards the brand, attitude towards quality and attitude towards presentation.
However, it has also been observed that all the variables are positively associated with
humour advertisement.
4.3. Regression Analysis
The general equation of regression is:
In the above equation, y represents dependent variable such s humour advertisement,
whereas, α shows the value of constant and β represents that coefficient of the independent
variable, while x is the dependent variable.
The table 3 in the appendices showed that the relationship exists between all the
dependent variables with the only independent variable, i.e. humour advertisement. The
relationship regarding the equation is explained further:
From the equation above it can be stated that due to one unit increase in the humorous
advertisement, the buyer decision making will increase by .579 units. In the same manner, if
no change is observed in humour advertisement, the change in buying decision making would
be .950, while the sig. Value has also appeared to be less than 0.05, indicating that the
relationship is highly significant. The value of R-square shown the impact of one variable on
the other, which has appeared to be .625.
The equation above has shown that any change in the humorous advertisement will
change the attitude towards the brand by .400 units. Whereas, the value of R-square has
appeared to be .672 which means that the association between two is quite moderate.
It can be inferred from the above equation that due to any change in humour
advertisement towards quality will effect by .469 units, the relationship between the two
variables have appeared to be significant since the sig. Value has appeared to be less than
0.05.
ISSN: 2289-4519 Page 45It can be seen that humorous advertisement tends to affect attitude towards
presentation by .599, which has appeared to be highly significant. In the same manner, the R-
square has appeared to be .894.
One unit change in the humorous advertisement will change the attitude of the
consumers by .668, and the relationship has also appeared to be significant. In the same
manner, the relationship between the two variables has appeared to be strong, i.e. about .751.
5. DISCUSSIONS
Objective 1: To explain the concept of the humour advertisement: The first
objective of this research revolves around gaining the understanding concerning the basic
concept of the humour advertising. This objective has been achieved by virtue of extensive
literature review. As highlighted by Chan, (2011) extensive parts of the most fundamental
commercial battles tend to be amusing. Patrons use this strategy to pull in customers to their
thing. The path to a clever promoting effort is guaranteeing the amusingness is appropriate
for both thing and customer. Group seizes the opportunity to be engaged. People will give
watchful thought to a clever business than a certified or extraordinary one. The concordance
among fascinating and unpalatable can much of the time be touchy, and a promoter must be
sure the helpful results surpass the negative focuses before an advertisement can be
presented. Another point to consider when utilizing diversion in promoting is that a few
things are entertaining to a few people, it is not an unquestionable requirement that one clever
advertisement is amusing for someone else as well. The market to target and the crowd to
target ought to constantly be viewed as (Sabri, 2012). The best things to offer utilizing
diversion tend to be those that buyers need to ponder. Things that are for the most part
economical, and habitually consumable, can be addressed without giving a ton of assurances,
and that is the place there's space for funniness. Funniness in promoting tends to upgrade
check affirmation, notwithstanding, does not improve thing audit, message trustworthiness, or
purchasing aims. Figuratively speaking, clients may be familiar with and have positive
estimations towards the thing, yet their acquiring decisions will apparently not be affected
(Chang & Chang, 2014).
Objective 2: To explore the process of consumer purchase decision: The second
objective of this study was to identify the process of consumer purchase decisions that has
also been achieved with the help of literature review. Hartmann and Apaolaza-Ibáñez (2012)
the purchasing decision of the consumer's plays is largely dependent upon their willingness to
purchase particular products. Consumers willing to purchase particular products would be
more likely to make decisions which would result in them paying the required amount of
money to purchase the desired products. On the other hand, it has been stated by Ali, Kapoor
and Moorthy (2010) that the purchasing power of the consumers also has a substantial impact
on their purchasing decision-making process. The income level of the consumers determines
the products that they can afford to buy and those that they cannot. Furthermore, individuals
belonging to lower income groups are more inclined towards buying those products that are
considered as necessary for their survival rather than spending on luxurious items. According
to Lay-Yee, Kok-Siew and Yin-Fah (2013), one of the key types of decisions that are
undertaken by the customers while purchasing products is the nominal decision making also
referred to as habitual decision making. As it is habitual purchasing; therefore, not much
ISSN: 2289-4519 Page 46efforts are being made while making purchase decisions as the majority of the purchasing is
being done as part of the routine.
Objective 3: To determine the relationship between humour advertisement and
consumer purchase decision: The third objective of the study was to determine the
relationship between humour advertisement and consumer purchase decisions which have
been achieved by virtue of literature review and primary data analysis. In the perspective of
Wijaya (2015) the utilization of diversion inside commercial is, for the most part, helpful, as
it is much of the time utilized by individuals while conveying every day. Amusingness has
the ability to build up an association between the communicator and the intended interest
group which gives a chance to the advertisers to draw in clients in extensive numbers.
Consistent review of the promotion could well outcome in buyers getting associated with
acquiring the item that is being shown in the notice. Then again, it has been expressed by
Hutter and Hoffmann (2011) that occasionally the real qualities and the elements may not be
exceptionally energising and alluring; in this way, the utilisation of silliness, for this situation,
is valuable with a specific end goal to get the consideration of the customers.
As per the discoveries of Yus (2016), the component of absurdity in ads tends to
expand influence in a roundabout way by expanding the inspiration of the customers to
deliberately dissect the promotion. Moreover, it has been proposed that the nearness of
diversion inside commercials is useful in giving happiness to the clients that for the most part
brings about enhancing their disposition and impacting the path in which they process ads
The other noteworthy advantage related with the nearness of funniness inside notices is that
they have the quality to take out the normal propensity of the watchers to take part in counter
contentions when confronting distinctive sorts of messages, for example, well-being and
cautioning messages. Thus, it has been assessed from the discussion and analysis of the
primary data that significantly positive relation exists in between the independent variable of
the study and dependent variable of the study.
Objective 4: To identify the impact of humorous advertisement on the purchase
decision of Malaysian consumers: The fourth objective of the study was to identify the
impact of humorous advertisement on the purchase decision of Malaysian consumers which
has been achieved with the help of primary data assessment. The findings gained from the
different test analysis showed that most of the consumers like to watch the humorous
advertisement. In the same manner, the results of the study also showed that the element of
humour is easily retained in the minds of the consumers. Likewise, the findings reveal that
consumers like to buy branded products because of its superior quality and that some of the
consumers are also willing to pay extra for branded products only if the quality of the product
is high. Thus, it has been assessed that the positive impact of humour advertisement exists on
the purchase decisions of the Malaysian customers.
The findings gained from the different test analysis showed that most of the
consumers like to watch the humorous advertisement. In the same manner, the results of the
study also showed that the element of humour is easily retained in the minds of the
consumers. Likewise, the findings reveal that consumers like to buy branded products
because of its superior quality and that some of the consumers are also willing to pay extra
for branded products only if the quality of the product is high. The research conducted by
Bates and Ferry (2010) humour advertisement showed that marketers insert the element of
humour in their ads as it pleases the customers. Similarly, Chan (2011) stated that
advertisement has the element of humour stays longer in the minds of the consumers.
However, the study conducted by Shah, Aziz, Jaffari, Waris, Ejaz, Fatima, & Sherazi (2012)
showed advertisements also tends to alter the perception of the consumers related to a
product.
ISSN: 2289-4519 Page 47In the same manner, from the results, it can also be concluded that the purchase
decision of the consumers are influenced by the word of mouth marketing since most of the
consumers tend to prefer good products in their social circle. In the same manner, the results
also reveal that significant relationship exists between the independent and all the dependent
variables as the value of sig. has appeared to be less than 0.05. However, strong correlation
only exists between humour advertisement and attitude towards advertisement and consumer
purchase decision.
5. CONCLUSION
The analyses and evaluation above have been able to prove that there is a remarkable
impact of humour advertising on the consumer purchasing decisions. The study was able to
identify that the purchasing decision of the consumer's plays is largely dependent upon their
willingness to purchase particular products. Consumers willing to purchase particular
products would be more likely to make decisions which would result in them paying the
required amount of money to purchase the desired products which is instigated by the virtue
of advertising initiatives. Using the SPSS software, the different test that has been carried out
includes descriptive statistics, which has helped in analysing the central tendency of the
gathered data, reliability analysis, frequency analysis, correlation analyses and regression
analysis. The correlation analysis helped in determining the direction of the dependent and
independent variables, while the regression analysis has estimated the impact of one variable
on the other and the sig. the value obtained from the regression analysis has helped in testing
the hypothesis of the research. The results also reveal that significant relationship exists
between the independent and all the dependent variables as the value of sig. has appeared to
be less than 0.05.
REFERENCES
Ali, J., Kapoor, S., and Moorthy, J. (2010). Buying behaviour of consumers for food products in an
emerging economy. British Food Journal, 112(2), 109-124.
Bates, S., and Ferry, A. J. (2010). What’s Entertainment? Notes toward a Definition. Studies in
Popular Culture. 33(1).
Burrell, G., & Morgan, G. (2017). Sociological paradigms and organisational analysis: Elements of
the sociology of corporate life. Routledge.
Chan, F. F. Y. (2011). The use of humour in television advertising in Hong Kong. Humor-
International Journal of Humor Research, 24(1), 43-61.
Chang, W. Y., and Chang, I. Y. (2014). The influences of humorous advertising on brand popularity
and advertising effects in the tourism industry. Sustainability, 6(12), 9205-9217.
Chang, Y. Y., & Bandyopadhyay, S. (2014). The impact of American advertising humor on
Taiwanese consumers. The International Business & Economics Research Journal
(Online), 13(1), 93.
Churchill, S. D. (2014). Phenomenology. In Encyclopaedia of critical psychology (pp. 1389-1402).
Springer New York.
ISSN: 2289-4519 Page 48Cohen, J., Cohen, P., West, S. G., and Aiken, L. S. (2013). Applied multiple regression/correlation
analysis for the behavioural sciences. Routledge.
Creswell, J. W. (2013). Research design: Qualitative, quantitative, and mixed methods approaches.
Sage publications.
Creswell, J. W., & Poth, C. N. (2017). Qualitative inquiry and research design: Choosing among five
approaches. Sage publications.
De Pelsmacker, P., & Geuens, M. (2015). The Advertising Effectiveness of Different Levels of
Humor and Warmth and the Moderating Role of Affect Intensity. In Proceedings of the 1998
Academy of Marketing Science (AMS) Annual Conference (pp. 11-16). Springer, Cham.
Dell’ Era, C., & Landoni, P. (2014). Living Lab: A methodology between user‐centred design and
participatory design. Creativity and Innovation Management, 23(2), 137-154.
Eisend, M. Plagemann, J, Sollwedel. J. (2013) Gender Roles and Humor in Advertising: The
Occurrence of Stereotyping in Humorous and Non-humorous Advertising and Its
Consequences for Advertising Effectiveness.
Eisend, M. (2011). How humour in advertising works: A meta-analytic test of alternative
models. Marketing Letters, 22(2), 115-132..
Gray, D. E. (2013). Doing research in the real world. Sage.
Hartmann, P., and Apaolaza-Ibáñez, V. (2012). Consumer attitude and purchase intention toward
green energy brands: The roles of psychological benefits and environmental concern. Journal
of Business Research, 65(9), 1254-1263.
Huang, J., Su, S., Zhou, L., and Liu, X. (2013). Attitude toward the viral ad: Expanding traditional
advertising models to interactive advertising. Journal of Interactive Marketing, 27(1), 36-46.
Hutter, K., and Hoffmann, S. (2011). Guerrilla marketing: The nature of the concept and propositions
for further research. Asian Journal of Marketing, 5(2), 39-54.
Islam, M. S., and Rahman, S. A. (2011). Anomaly intrusion detection system in wireless sensor
networks: security threats and existing approaches. International Journal of Advanced
Science and Technology, 36(1), 1-8.
Khan, S. N. (2014). Qualitative research method-Phenomenology. Asian Social Science, 10(21), 298.
Khattak, M. A., & Baig, M. (2016). Impact Of Humor In Advertising Marketing, On Purchase Intent
A Study To Investigate The Effectiveness Of Humor When Introduced In Marketing
Communication As Advertisement. SGBED wishes to recognize the following sponsors, 801.
Kim, Y. H., Kim, M., and Goh, B. K. (2011). An examination of food tourist’s behavior: Using the
modified theory of reasoned action. Tourism Management, 32(5), 1159-1165.
Lay-Yee, K. L., Kok-Siew, H., and Yin-Fah, B. C. (2013). Factors affecting smartphone purchase
decision among Malaysian generation Y. International Journal of Asian Social
Science, 3(12), 2426-2440.
Limbu, Y. B., Huhmann, B. A., and Peterson, R. T. (2012). An examination of humour and endorser
effects on consumers' responses to direct-to-consumer advertising: The moderating role of
product involvement. International Journal of Pharmaceutical and Healthcare
Marketing, 6(1), 23-38..
ISSN: 2289-4519 Page 49Malik, M. E., Ghafoor, M. M., & Iqbal, H. K. (2014). The Impact of Advertisement and Consumer
Perception on Consumer Buying Behavior. International Review of Social Sciences and
Humanities, 6(2), 55-64.
Mayers, A. (2013). Introduction to Statistics and SPSS in Psychology. Pearson.
McMillan, J. H., & Schumacher, S. (2014). Research in education: Evidence-based inquiry. Pearson
Higher Ed.
Paquette, H. (n.d.). Social Media as a Marketing Tool: A Literature Review. Retrieved September,
2016, from
ttp://digitalcommons.uri.edu/cgi/viewcontent.cgi?article=1001&context=tmd_major_papers
Petrescu, M., Korgaonkar, P., & Gironda, J. (2015). Viral advertising: A field experiment on viral
intentions and purchase intentions. Journal of Internet Commerce, 14(3), 384-405.
Polit, D. F. (2013). Statistics and Data Analysis for Nursing Research: Pearson New International
Edition: Do I Really Need This Stuff? Pearson Higher Ed.
Powers, T., Advincula, D., Austin, M. S., Graiko, S., and Snyder, J. (2012). Digital and social media
in the purchase decision process. Journal of advertising research, 52(4), 479-489.
Sabri, O. (2012). Taboo advertising: can humour help to attract attention and enhance recall? Journal
of Marketing Theory and Practice, 20(4), 407-422.
Saunders, M. N. (2011). Research methods for business students, 5/e. Pearson Education India.
Saunders, M. N., & Lewis, P. (2012). Doing research in business & management: An essential guide
to planning your project. Pearson.
Senthilkumar, N., & Venkatesh, S. (2017). Impact of Television Media in Influencing Consumer
Buying Behaviour Through. Online Journal of Communication and Media
Technologies, 7(2).
Shah, S. S. H., Aziz, J., Jaffari, A. R., Waris, S., Ejaz, W., Fatima, M., and Sherazi, S. K. (2012). The
impact of brands on consumer purchase intentions. Asian Journal of Business
Management, 4(2), 105-110.
Stathopoulou, A., Borel, L., Christodoulides, G., & West, D. (2017). Consumer branded# hashtag
engagement: can creativity in TV advertising influence hashtag engagement?. Psychology &
Marketing, 34(4), 448-462.
Swani, K., Weinberger, M. G., and Gulas, C. S. (2013). The impact of violent humour on advertising
success: A gender perspective. Journal of Advertising, 42(4), 308-319.
Teixeira, T., Picard, R., & Kaliouby, R. E. (2013). Why, When and How Much to Entertain
Consumers in Advertisements? A Web-based Facial Tracking Field Study. Retrieved August,
2016, from http://affect.media.mit.edu/pdfs/14.Teixeira-etal.pdf
Verma, S. (2009). Do All Advertising Appeals Influence Consumer Purchase Decision: An
Exploratory Study. Global Business Review, 10(1), 33-43. Doi:
10.1177/097215090801000102
Vohs, K. D., Baumeister, R. F., Schmeichel, B. J., Twenge, J. M., Nelson, N. M., and Tice, D. M.
(2014). Making choices impairs subsequent self-control: a limited-resource account of
decision making, self-regulation, and active initiative.
Wijaya, B. S. (2015). The development of hierarchy of effects model in advertising. International
Research Journal of Business Studies, 5(1).
ISSN: 2289-4519 Page 50Yoon, H. J., and Tinkham, S. F. (2013). Humorous threat persuasion in advertising: The effects of
humour, threat intensity, and issue involvement. Journal of Advertising, 42(1), 30-41.
Yus, F. (2016). Humour and Relevance (Vol. 4). John Benjamins Publishing Company
Appendices
Table 2
Correlations
Humour Purchas Brand Attitud Attitude Attitude
e Attitude e Presentat Entertainme
Decision Quality ion nt
Humour Pearson 1 .625** .467** .497** .494** .751**
Correlatio
n
Sig. (2- .000 .000 .000 .000 .000
tailed)
N 360 360 360 360 360 360
Purchase Pearson .625 ** 1 .457** .473** .469** .690**
Decision Correlatio
n
Sig. (2- .000 .000 .000 .000 .000
tailed)
N 360 360 360 360 360 360
Brand Pearson .467** .457** 1 .537** .532** .603**
Attitude Correlatio
n
Sig. (2- .000 .000 .000 .000 .000
tailed)
N 360 360 360 360 360 360
Attitude Pearson .497** .473** .537** 1 .575** .714**
Quality Correlatio
n
Sig. (2- .000 .000 .000 .000 .000
tailed)
N 360 360 360 360 360 360
Attitude Pearson .494 ** .469 ** .532** .575** 1 .634**
Presentati Correlatio
on n
Sig. (2- .000 .000 .000 .000 .000
tailed)
N 360 360 360 360 360 360
Attitude Pearson .751 ** .690 ** .603** .714** .634** 1
Entertain Correlatio
ment n
Sig. (2- .000 .000 .000 .000 .000
tailed)
N 360 360 360 360 360 360
**. Correlation is significant at the 0.01 level (2-tailed).
ISSN: 2289-4519 Page 51Table 3
Constant Beta
Variable R-Square (α) (β) Sig. Value
Purchase Decision .625 .950 .576 .000
Attitude towards Brand .672 1.503 .400 .000
Attitude towards Quality .797 1.455 .469 .000
Attitude towards Presentation .894 1.351 .599 .000
Attitude towards Entertainment .751 .805 .668 .000
IJABM is a FTMS Publishing Journal
ISSN: 2289-4519 Page 52You can also read