Vulnerability Evaluation of Groundwater of N'Djamena City: Contribution of the Parametric Methods GOD and SI
←
→
Page content transcription
If your browser does not render page correctly, please read the page content below
Journal of Environmental Protection, 2021, 12, 472-489
                                                                                               https://www.scirp.org/journal/jep
                                                                                                          ISSN Online: 2152-2219
                                                                                                            ISSN Print: 2152-2197

Vulnerability Evaluation of Groundwater of
N’Djamena City: Contribution of the Parametric
Methods GOD and SI

David Deubalbe1, Edith Kadjangaba1,2, Djimako Bongo3, Sabine Djimouko4,
Jean Claude Doumnang Mbaigane1, Yaya Mahmout5
1
 Geology Department, Faculty of Exact and Applied Sciences, University of N’djamena, N’djamena, Chad
2
 Faculty of Sciences and Techniques, University of Doba, Doba, Chad
3
 Higher Normal School of Technology of Sarh, Sarh, Chad
4
 Letters, Arts and Human Sciences Faculty, University of Moundou, Moundou, Chad
5
 Natural Substances Laboratory, Exact and Applied Sciences Faculty, University of N’Djamena, N’Djamena, Chad

How to cite this paper: Deubalbe, D.,         Abstract
Kadjangaba, E., Bongo, D., Djimouko, S.,
Mbaigane, J.C.D. and Mahmout, Y. (2021)       The purpose of this work is to study the vulnerability of the Quaternary aqui-
Vulnerability Evaluation of Groundwater       fer that lies beneath the N’Djamena city Chad. The subsoil of N’Djamena city
of N’Djamena City: Contribution of the
                                              Chad is made up of a multilayered aquifer in which there are two main aqui-
Parametric Methods GOD and SI. Journal
of Environmental Protection, 12, 472-489.     fers located respectively at a depth of about 10 and 60 m, between the two
https://doi.org/10.4236/jep.2021.127030       there is an intermediate aquifer at about 30 m depth. It is this latter water ta-
                                              ble, generally captured by human-powered pumps, that is the subject of this
Received: May 28, 2021
                                              study. Because of anarchic garbage dumping, wastewater discharge, latrines
Accepted: July 12, 2021
Published: July 15, 2021                      scattered throughout the city, chemical fertilizers and herbicides used on the
                                              banks of Chari River and its tributary the Logone for market gardening, the
Copyright © 2021 by author(s) and
                                              quality of the water in this aquifer is highly threatened. Moreover, it has been
Scientific Research Publishing Inc.
This work is licensed under the Creative      noting that the sources of pollution are constantly increasing in conjunction
Commons Attribution International             with the growth of the population, so the knowledge and protection of ground-
License (CC BY 4.0).                          water are necessary. We have therefore carried out a study of intrinsic vulne-
http://creativecommons.org/licenses/by/4.0/
                                              rability using two mapping methods (GOD and SI), as mapping is recognized
               Open Access
                                              as an effective tool for decision support in the case of safeguarding water re-
                                              sources. The results obtained by the GOD method show that 38% of the study
                                              area is covered by high vulnerability, 29% by moderate vulnerability, 21% by
                                              low vulnerability and 21% by the very low vulnerability. With the SI method,
                                              54% of the study area is covering by low vulnerability and 46% by the low and
                                              moderate vulnerability. The coincidence rate of low nitrate values in ground-
                                              water with areas of very low and low vulnerability is 91% and 76% for the GOD
                                              and SI methods, respectively. Although these observations validated the dif-

DOI: 10.4236/jep.2021.127030 Jul. 15, 2021                      472                          Journal of Environmental Protection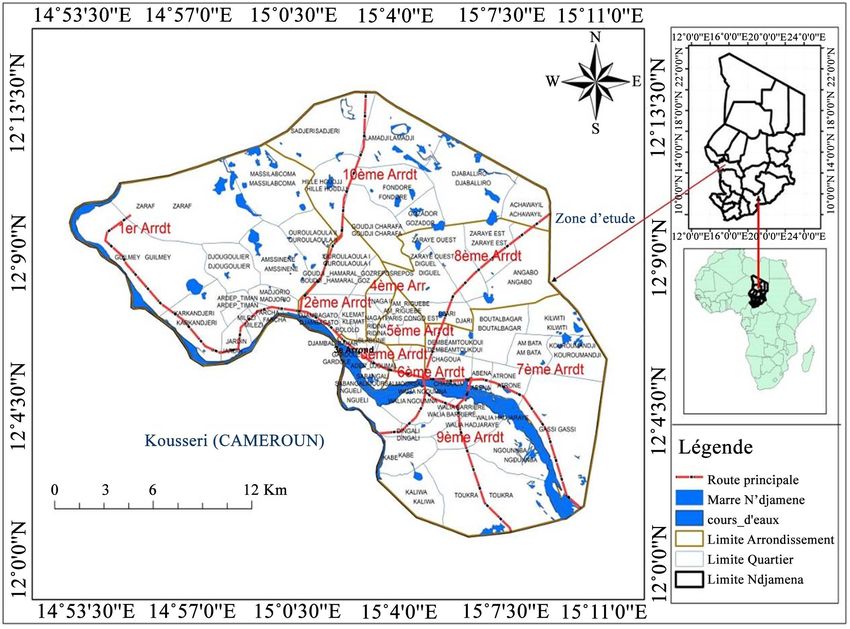
D. Deubalbe et al.

                                 ferent maps obtained, the SI approach seems to be the most adequate for
                                 vulnerability tracing in our study area.

                                 Keywords
                                 Vulnerability, GOD, SI, Groundwater, Nitrate, N’Djamena City

                               1. Introduction
                               Water is necessary for all life on planet and is a factor in promoting the health of
                               individuals and the socio-economic development of human communities [1].
                               Groundwater, which represents a total of about 97% of liquid continental fresh-
                               water [2], is increasingly exploited for drinking water supply (DWR). This is re-
                               flected in the renewed interest in human-powered boreholes observed in recent
                               times in Sub-Saharan African countries.
                                  Groundwater is not immune to surface pollution since it is largely renewed by
                               rainwater that falls on the surface before infiltrating through the soil to the water
                               table, carrying with it certain undesirable products. However, natural ground-
                               water is generally free of contamination, especially when it is deep, because of
                               the purifying power of soil; but in recent decades, there has been an increased
                               degradation of this resource.
                                  The process of water degradation, although very slow, can have serious effects
                               [3], especially on human health. The increasing pollution of the groundwater
                               leads to the alteration of the quality and the decrease of the quantity of drinking
                               water. This is very worrying because, in the long term, water resources will be
                               weakened even if they are renewable. This pollution is the consequence of the
                               galloping demography and the intensity of uncontrolled anthropic activities in
                               the urban environment. Scientists have developed the concept of vulnerability to
                               the pollution of aquifers in order to find a solution to the increasing deteriora-
                               tion of water resources. Knowing that in a given region, the vulnerability of
                               aquifers to pollution results from the interaction of several factors, among which
                               we can enumerate the hydrogeology, the aquifer-contaminant reaction and the
                               sources of pollution [4].
                                  In N’Djaména city Chad, groundwater contamination is essential of anthro-
                               pogenic origin [5] [6] [7] [8]: it is reflected in the high presence of nitrate levels
                               in the water resulting from the discharge of wastewater, industrial effluents, un-
                               authorized dumping of garbage, latrines, dilapidated sewage systems or animal
                               excrement.
                                  The decontamination of water is not always easy, because it requires large fi-
                               nancial means, which is not always within the reach of developing countries and
                               especially Chad. In view of this, it is necessary that measures be taken to know
                               and protect the groundwater of the N’Djamena city Chad.
                                 In this context, measures to help protect and prevent groundwater pollution
                               become an important step towards which many efforts must be provided. Among

DOI: 10.4236/jep.2021.127030                        473                           Journal of Environmental Protection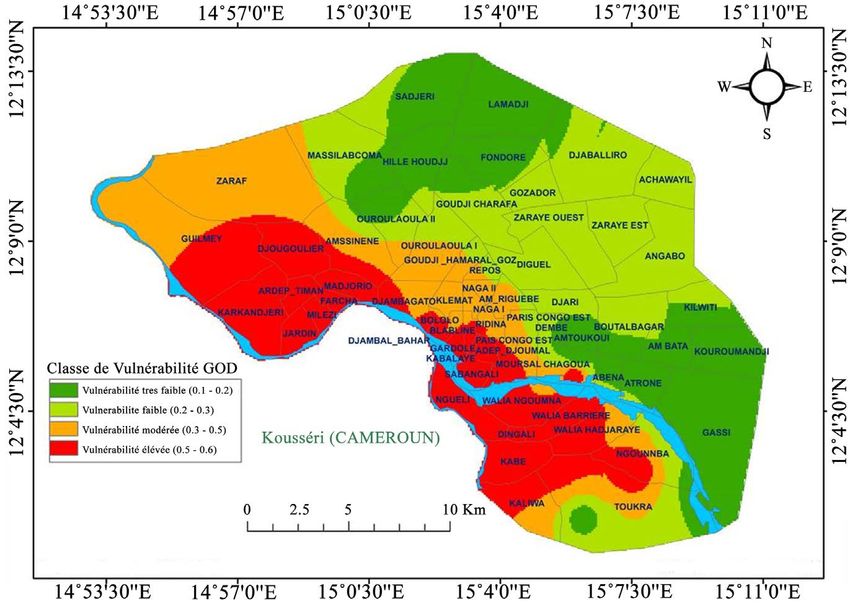
D. Deubalbe et al.

                               these measures, the mapping of areas vulnerable to pollution [9] is a decisive
                               tool for decision support. This is widely used for groundwater protection and
                               decision-making in the case of land use planning [10] [11] and water develop-
                               ment projects. Vulnerability maps identify the different degrees of sensitivity of
                               the aquifer [12] and the identification of areas of high vulnerability can prevent
                               some of the contamination.
                                 There are many methods for estimating groundwater vulnerability, and these
                               are broadly dividing into three groups [13] [14]. These include statistical me-
                               thods, simulation models and index mapping methods.
                                 In the case of this study, we chose the parametric index mapping methods GOD
                               and SI. The GOD method was developing by [15] to assess the intrinsic vulnera-
                               bility of the aquifer to pollutants while the SI or DRATOS method was develop-
                               ing in Portugal by [16] to take into account the behavior of pollutants of agri-
                               cultural origin such as nitrates.
                                 The aim of this work is to study the vulnerability of the Quaternary aquifer
                               under N’Djamena city Chad, using the GOD and SI parametric methods. The
                               highlighting of nitrate mapping, which is an indicator of anthropogenic pollu-
                               tion, is part of the validation process of vulnerability maps. The parameter “land
                               use” of the SI method allows taking into account the risks linked to anthropic
                               actions likely to generate groundwater pollution and contaminant aquifers of
                               Ndjamena Chad.

                               2. Materials and Methods
                               2.1. Presentation of Area Study
                               N’Djamena, capital of Chad, is the largest city in country. It was creating on April
                               22, 1900 and established as a commune in 1919. Geographically, N’Djamena city
                               Chad (study area) is located in western Chad on the border with Cameroon be-
                               tween 12˚06'59'' North and 15˚04'20'' East. N’Djamena city Chad has a popula-
                               tion of about 1,500,000 (INSEED, 2017) with an annual growth rate of about 7%
                               and a density of about 83 inhabitants/ha according to the 2013 National Sympo-
                               sium report. The city is located on a relatively flat area with an average elevation
                               ranging from 280 to 320 meters (Figure 1) with relatively low natural slopes
                               ranging from 1% to 2.5% and today covers an urbanized area of 40,000 hectares
                               (ha). Administratively, Ndjamena city Chad is dividing into ten (10) administra-
                               tive units called Municipal Districts and subdivided into 78 neighborhoods, 1650
                               squares. These represent the smallest administrative units in the city (Table 1).
                                 According to the literature [17] [18], the hydrographic network is essentially
                               composed of the Chari River, the most important river in Chad, which has its
                               source in Mount Yadé (in the Central African Republic). Its main tributary, the
                               Logone, at the town, joins it. The latter originates in the Adamaoua massif in
                               Cameroon. Throughout the N’Djamena city Chad (Figure 1), there are depres-
                               sions that correspond to quarries dug for the construction of houses. During the
                               rainy season, rainwater and runoff accumulate in these depressions; they stagnate

DOI: 10.4236/jep.2021.127030                        474                          Journal of Environmental Protection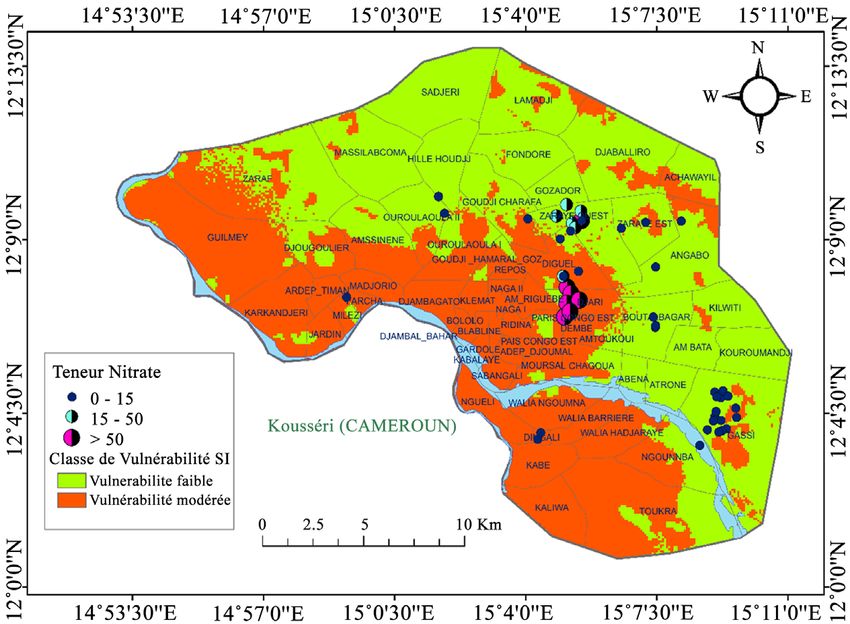
D. Deubalbe et al.

                               Figure 1. Location map of area study.

                               Table 1. Criteria for estimating GOD vulnerability ([25] [30]).

                                          Vulnerability class GOD                         vulnerability index

                                           Very low vulnerability                                0 - 0.1

                                              Low vulnerability                                  0.1 - 0.3

                                           Moderate vulnerability                                0.3 - 0.5

                                             High vulnerability                                  0.5 - 0.7

                                            Extreme vulnerability                                0.7 - 1

                               there throughout the wet season before dissipating either by evaporation or in-
                               filtration, or by the combined effect of the two phenomena, thus giving rise to
                               more or less permanent pools depending on their size. There is also the presence
                               of a large canal that crosses the city from north to south and whose purpose is to
                               drain wastewater.
                                 The subsoil of N’Djamena city Chad contains two superimposed aquifer levels
                               [19] [20] [21] [22]. These are separating by an impermeable to semi-permeable
                               clay level in places; these two aquifers are rather part of the same whole. In addi-
                               tion, the [23] also reports locally, the presence of intermediate aquifers at a depth
                               of 20 to 30 m. These aquifers are fed mainly by the Chari River and sometimes
                               by rainwater [5] [7].

                               2.2. Materials, Data Collection and Processing
                               The data and information collected for this study came from several sources.
                               The Water Chadian Society (STE), the Centre of Geographic Documentation
                               (CDG) of the Ministry in charge of Environment, Water and Fisheries and vari-

DOI: 10.4236/jep.2021.127030                           475                           Journal of Environmental Protection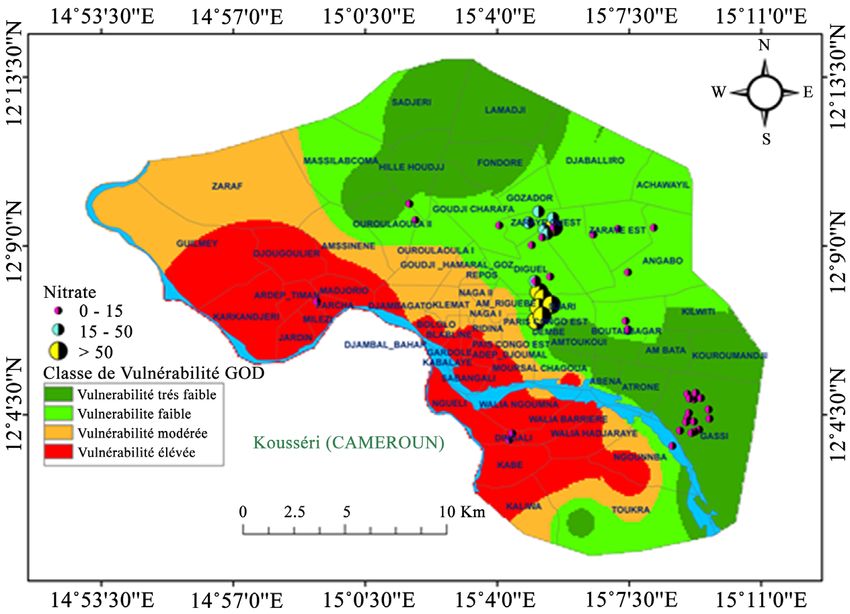
D. Deubalbe et al.

                               ous drilling companies, provided them to us. The different data collected concern
                               the drilling depths, lithological sections and pumping tests. The piezometric data
                               comes from fieldwork conducted in March 2018 as part of this study and sup-
                               plemented by those of the town hall conducted during the same year (N’djamena
                               Town Hall, 2018).
                                  The results of nitrate analyses were obtaining from the database of the Na-
                               tional laboratory of water (LNE). From the Lansat 8 image of N’Djaména city
                               Chad obtained from the National center for the reseach and development (CNRD)
                               in 2017. We were able to generate with ArcGIS version 10.4 software the drai-
                               nage flow map of the hydrographic network, the depth map of the aquifers, the
                               recharge map, the type of aquifer, or the piezometric level as well as the topo-
                               graphic map.
                                  The information on the land use of N’Djamena Chad plain comes from the
                               land use database of the Agriculture Ministry and more precisely from the ser-
                               vice in charge of the Information System for Rural Development and Land Use
                               (SIDRAT) collected in 2016. Various software programs were using to process
                               all these data and Surfer was using for the processing and spatial analysis of the
                               data. The land use map (OS) was obtaining from the processing and classifica-
                               tion of the Lansat 8 image of SIDRAT following the SI weights [16]. These weights
                               are ratings assigned by class for the Land Use (LU) values assigned to each of the
                               parameters according to its relative influence on vulnerability [16]

                               3. Method
                               3.1. GOD Method: Parameters and Ratings
                               The GOD method was developing by [15] to assess the intrinsic vulnerability of
                               aquifer pollution. It presents the vulnerability of the aquifer, to vertical percola-
                               tion of pollutants through the unsaturated zone and does not address the lateral
                               migration of pollutants into the saturated zone. In the GOD method, the role of
                               the soil in protecting the aquifer is neglected [15]. This method is based on the
                               combination of three hydrogeological parameters: Groundwater occurrence,
                               overall aquifer class and Depth to groundwater table. The estimation of these pa-
                               rameters is easy, as it is based on the information collected by the operators)
                               even on a drilling log [24]. This method allows for a quick estimate of vulnera-
                               bility [25]. The GOD index (IGOD) that allows evaluating the vulnerability is
                               obtained by multiplying these three parameters according to Equation (1) [25]
                               below:
                                                               IGOD = Gi ∗ Op ∗ Da                               (1)

                                 Gi, Op, and Da represent the index values of aquifer type (G), water table
                               depth (O), and aquifer unsaturated zone layer lithology or geologic features (D),
                               respectively. The value of the GOD index varies between 0 and 1 (Table 1). Fur-
                               thermore, the closer to the value of 1, the more pollution potential is raised.
                                 The different ranges of GOD index obtained are relating to the vulnerability
                               classes (Table 1). In general, the obtained GOD indices are dividing into five (5)

DOI: 10.4236/jep.2021.127030                        476                          Journal of Environmental Protection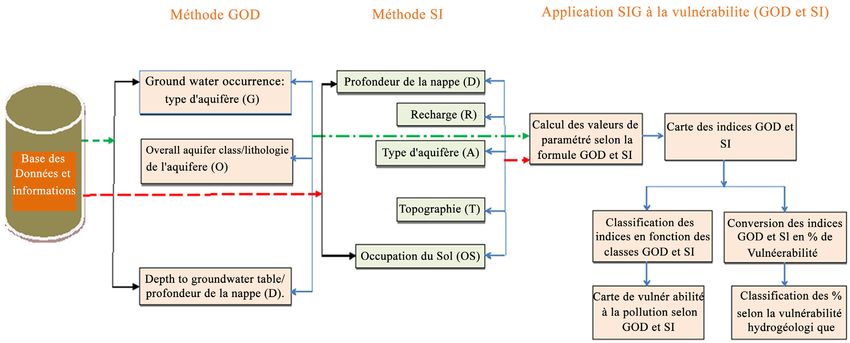
D. Deubalbe et al.

                               ranges of vulnerability classes ranging from “very low” to “extreme” vulnerabili-
                               ty.

                               3.2. SI or Drastos Method, Parameters and Scoring
                               The SI (Susceptibility Index) method was developing in Portugal by [16]. It is a
                               specific vertical vulnerability method, developed to take into account the beha-
                               vior pollutants of agricultural origin (organic), mainly nitrates.
                                 SI is a derived version of the DRASTIC model developed by [26], and is known
                               as DRATOS [27].
                                 In the vulnerability assessment process, the DRATOS model considers five pa-
                               rameters. The first four parameters are similar to the four parameters used in the
                               DRASTIC method (D: depth to water table, R: effective aquifer recharge, A: aqui-
                               fer lithology, and T: topography). Therefore, the ratings corresponding to the
                               different classes of parameters used in the DRASTIC method are the same as
                               those used by the SI method. In addition to the common parameters, the land
                               use (OS) parameter is added, which takes into account the impact of anthropo-
                               genic activities [28].
                                 The land cover (OS) parameter was obtaining by processing the Landsat im-
                               age SIDRAT Database, 2016.
                                 For this parameter, we used the [29] classification as represented in Table 2.
                               To each land cover class corresponds a value called land cover factor noted LU,
                               the latter varies from 0 to 100 thus going from least vulnerable to most vulnera-
                               ble. Thus, the minimum value 0 corresponds to forests and semi.
                                 The maximum value of 100 is assigned to industrial landfills, garbage dumps
                               and mines.
                                 The weights assigned to the SI parameters vary from 0 to 1 depending on the
                               importance of the parameter in the vulnerability (Table 3). The Vulnerability

                               Table 2. Main land covering classes and LU values [16]. Land use classification according
                               to [29].

                                                  Parameter: Land Use and corresponding Land Use (LU) values

                                                                Land use class (OS)                                 LU factor value

                                                     Industrial landfill, garbage dump, mines                             100

                                     Irrigated perimeter, rice fields, irrigated and non-irrigated annual crops           90

                                                                 Quarry, shipyard                                         80

                                          Covered artificial areas, green areas, continuous urban areas                   75

                                                 Permanent crops (vines, yards, olive trees, etc.)                        70

                                                            Discontinuous urban areas                                     70

                                                         Pastures and agro-forestry areas                                 50

                                                   Aquatic environments (tides, salt flats, etc.)                         50

                                                          Forest and semi-natural areas                                    0

DOI: 10.4236/jep.2021.127030                              477                               Journal of Environmental Protection
D. Deubalbe et al.
Index (VI) is calculating by summing the products of the scores by the weights
of the corresponding parameters, as summarized by the formula below:
ISI ou IDRATROS
(2)
= 0.186 ∗ D + 0.212 ∗ R + 0.259 ∗ A + 0.121 ∗ T + 0.222 ∗ OS
This method presents four degrees of vulnerability according to the index
values obtained (Table 4).
Apart from the two models, we used the ArcGIS software developed by ESRI.
This Geographic Information System (GIS) software, equipped with powerful
mathematical functions and tools, allowed us to work both in vector, raster and
raster systems. The most used tools on ArcGIS are the “Interpolate IDW” mod-
ule for the analysis and spatialization of point data, the “Reclassify” module for
the attribution of coasts and the “Map calculator” module for the cross-referencing
operations between the different thematic maps. The comparative flowchart of
the realization of the vulnerability map from the GOD and SI methods is shown
in Figure 2.
Table 3. Weights assigned to SI or DRATOS parameters (ranging from 0 to 1, from least
to most important) [16] [27].
Parameter D R A T OS
Weight 0.186 0.212 0.259 0.121 0.222
Table 4. SI vulnerability assessment class [16] [27].
Degree of vulnerability Vulnerability index
LowD. Deubalbe et al.
4. Results
The GOD vulnerability map (Figure 3) and the SI vulnerability map (Figure 4)
were obtained by raster calculation on the ArcGIS environment, respectively by
weighting and combining the different parametric maps of each method.
Several hydrogeological parameters such as aquifer type, effective recharge,
depth and lithology of the aquifer were mapped by the process of interpolation
(spatial analysis) of the technical data of the boreholes on ArcGIS. As for the
vulnerability maps, they are produced by raster calculation applied to the vulne-
rability index formula GOD [15] and SI [16]. Note that the reliability of the in-
terpolation depends mainly on the quality of the data used for the realization of
the maps and on the homogeneous and representative distribution of the mea-
surement points [28]. On the other hand, the physical parameter such as “slope
and land use (OS)” was obtaining by processing the Landsat 8 image (SIDRAT
database). These Landsat images were using to establish a thematic classification
for land cover and a classification of slope indices according to the SI method.
4.1. Level of Vulnerability of N’Djamena Water Table According to
GOD
Five vulnerability index ranges were identified by the GOD method, with vulne-
rability index values ranging from 0.126 to 0.657. The analysis of these index
ranges gives four classes of vulnerability to pollution (Figure 3):
The class of very low vulnerability, which is located in the northern and east-
ern part of the study area, it occupies the smallest proportion because it
represents only 13% of the area. This class is explaining by the presence of
layers with clay dominance. The static levels in this area are generally be-
tween 15 and 17 m.
Figure 3. GOD model vulnerability map.
DOI: 10.4236/jep.2021.127030 479 Journal of Environmental ProtectionD. Deubalbe et al.
Figure 4. SI or DRATOS model vulnerability map.
The class of low vulnerability is located in the northern and northeastern part
of the study area where it represents 20% of the area of the study area. This is
the intermediate vulnerability between the very low vulnerability class and
the moderate vulnerability class. The static levels in this zone are generally
between 13 and 14 m.
The moderate vulnerability class occurs in the center and west along a strip
and in the southern part of the study area. It represents 27% of the total area.
In this area the static level is approximately between 11 and 12.5 m.
This moderate degree of vulnerability can be explaining by the nature of the
unsaturated zone made up of silty sand that is not very permeable to infiltra-
tion, to which is added the occupation of the land by housing. These condi-
tions, favor the infiltration of contaminants and make these sectors sensitive
to pollution, they must therefore be monitored.
The high vulnerability class occurs in a band along the southern part of the
study area. This class occupies relatively all of the areas along the Chari and
Logone rivers (Sabangali, Farcha, Melezi, Ngueli, Walia, Ndigangali, Ngom-
ba) and represents about 40%, or a little more than a third of the study area.
The high degree of vulnerability can be explaining by the litho-stratigraphic
context of the unsaturated zone dominated by sands. Static levels in this zone
are generally between 8 and 10 m.
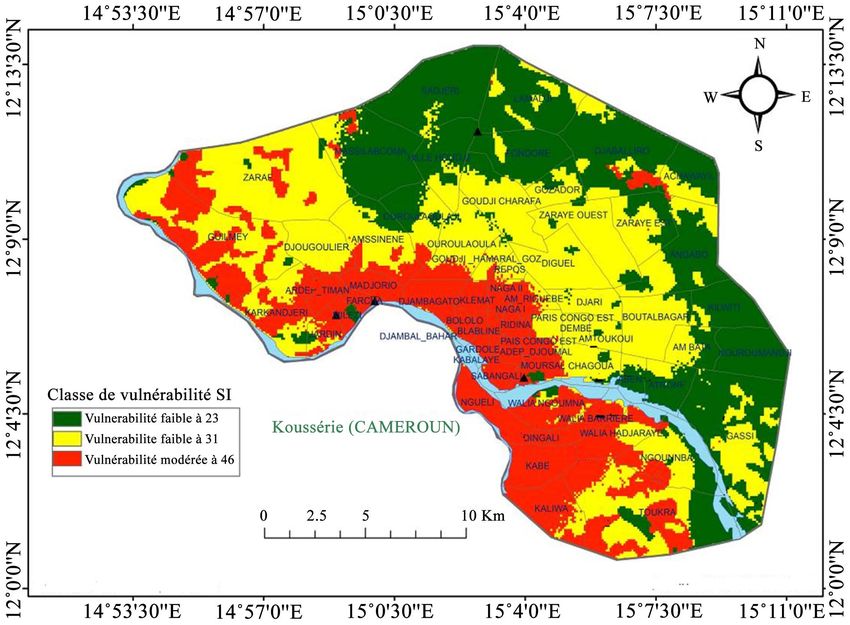
4.2. Level Vulnerability of N’Djamena Water Table According to SI
The SI method allowed us to obtain 5 classes of vulnerability indexes for our area
study varying between 4.01 (minimum value) and 45.72 (maximum value). These
indices were dividing into two classes of vulnerability pollution (Figure 4):
Low vulnerability class represents 54% and occupies for most part the north-
DOI: 10.4236/jep.2021.127030 480 Journal of Environmental ProtectionD. Deubalbe et al.
ern end and center of the plain of area study. This less severe vulnerability
class may be relating to the nature of the unsaturated zone made up of clay,
which is not very permeable and which could probably act as a purifier for
pollutants.
Moderate vulnerability class occurs in a strip along the southern part, is dis-
tributing almost all along the banks of Chari and Logone rivers, and extends
towards the center of total area study; it is also found in blocks in northern
part of area study. This class represents 46% of area. The areas affected by
moderate and specific vulnerability contain mainly crop perimeters, swamp
gardens or forest areas. The moderate degree of vulnerability of these areas
can be explained by the fact that these areas are possibly marked by the use
pollutants (fertilizer, herbicide), and they are constituted of sands and silts
which are very permeable because of their porosity. In these areas of mod-
erate vulnerability, there are also areas where the sewage system is defective,
areas previously filled with garbage before the construction of houses.
4.3. Validation of Vulnerability Map
In order to test and validate pollution vulnerability map, many authors [27] [30]
[31] [32] [33] [34] have relied on groundwater chemical data. This consists in
making a comparison between the distribution of nitrates in the studied ground-
water and the distribution of vulnerability classes. In our case, to verify the va-
lidity of the vulnerability maps obtained by the GOD and SI methods, we used
nitrate levels from a measurement campaign of 34 water points carried out in
2018 across N’djamena city Chad. Nitrate levels in groundwater in N’Djamena
city Chad vary from 0 to 150 mg/L with an average of 8 mg/l and 70% of these
samples have nitrate levels below 50 mg/L [35]. We divided the nitrate concen-
trations into three groups, namely the low (0 - 15 mg/L), medium (15 - 50 mg/L)
and high (≥50 mg/L) nitrate concentration range.
These different levels overlap indifferently with the very low, low, medium
and high vulnerability class (Figure 5 and Figure 6).
4.3.1. For the GOD Map
On the validity map of vulnerability pollution by GOD method (Figure 5) and
Table 5) we see that the thirty-four (34) values between 0 and 15 mg/L of nitrate,
seventeen (17) of these values coincide with the very low vulnerability zone.
Fourteen (14) of these values correspond to the low vulnerability zone and three
(3) correspond to the high vulnerability zone. The six (6) values between 15 and
50 mg/L are in the Low Vulnerability Zone and the six (6) values greater than or
equal to 50 mg/L nitrate are also in the Low Vulnerability Zone.
4.3.2. For the SI Map
Component heads identify the different components of your paper and are not
topically subordinate to each other. On the SI pollution vulnerability validity map
(Figure 6) and Table 5, twenty-six (26) values between 0 and 15 mg/L nitrate
coincide with the low vulnerability zone and eight (8) of these values correspond
DOI: 10.4236/jep.2021.127030 481 Journal of Environmental ProtectionD. Deubalbe et al.
Figure 5. Validity of the nitrate vulnerability map, GOD method.
Figure 6. Validity of the nitrate vulnerability map, SI method.
Table 5. Comparison of the map obtained by GOD and SI model with the nitrate concentrations measured in 2018.
Nitrate content Nitrate content
Degrees of Degrees of
Vulnerability 0 - 15 mg/L 15 - 50 mg/L >50 mg/L Vulnerability 0 - 15 mg/L 15 - 50 mg/L >50 mg/L
According According
Number Total Number Total Number Total Number Total Number Total Number Total
to GOD to GOD
of points % of points % of points % of points % of points % of points %
Very low 17 51% Very low
Low 14 41% 6 100% 6 100% Low 26 76% 6 100%
Moderate Moderate 8 23.52
High 3 8.82% High 6 100%
DOI: 10.4236/jep.2021.127030 482 Journal of Environmental ProtectionD. Deubalbe et al.
to the moderate vulnerability zone. Six (6) values between 15 and 50 mg/L are
also in the Low Vulnerability Zone and the six (6) values greater than or equal to
50 mg/L nitrate are in the Moderate Vulnerability Zone.
5. Discussions
Comparing the percentages of surfaces occupied by the different classes of vul-
nerability according to SI and GOD (Table 6), we note that for the GOD me-
thod, the high vulnerability class occupies the highest surface (38%) followed by
the moderate (29%), low (21%) and very low (12%) vulnerability classes. With
the SI method, we note the absence of very low and high vulnerability, while we
have a fairly balanced distribution between low (54%) and moderate (46%) vul-
nerability.
This observed difference in the number of classes may be relating to the fact
that the class boundaries and dimensions that are assigned to different parame-
ters are not absolute. This implies that the standard class boundaries may not re-
flect the reality on the ground where one class may surround different hydro-
geological units [36].
Based on the results obtained from the two (2) methods (GOD and SI), it ap-
pears that the GOD method overestimated the vulnerability compared to the SI
method (presence of the high vulnerability class). This finding is in agreement
with some work done in some sub-Saharan regions such as Burkina [37] or Ca-
meroon [28].
It should be noting that in the realization of vulnerability maps by both SI and
GOD methods, we are faced with a number of difficulties. Indeed, one of the dif-
ficulties related to the elaboration of parameter maps is the process of interpola-
tion whose reliability depends on the data used for their realization. This inter-
polation can lead to errors in the realization of parameter maps, because it is
only reliable within the intervals delimited by the point data [38]. Another diffi-
culty in applying the GOD and SI method is the class boundaries in terms of in-
dex and ratings that are assigning to the different parameters [28]. However,
despite these difficulties, we obtained interpretable and satisfactory results that
give an overview of the level of pollution in our study area and therefore we were
able to identify the areas that need to be monitored closely.
Table 6. Comparison of percentage of area occupied by vulnerability class.
Percentage of Area by Class and Method (%)
Vulnerability Class
SI or DRATOS (occupied surface) GOD (occupied surface)
Very low 0% 12% i.e. 4740 ha or 47.4 Km2
Low 54% or 21,330 ha or 213.3 Km2 21% or 8295 ha or 82.95 Km2
Moderate 46% or 18,170 ha or 181.7 km2 29% or 11,455 ha or 114.55 km2
High 0% 38% or 15,010 ha or 150.1 Km2
DOI: 10.4236/jep.2021.127030 483 Journal of Environmental ProtectionD. Deubalbe et al.
Comparison of Maps and Methods (GOD and SI)
Knowing that our study area is an urban area located in a semi-arid climate, in
this context we can consider that the classes of moderate and high vulnerability
represent areas threatened by pollution. They cover about 67% and 46% for GOD
and SI respectively.
The moderate and high vulnerability zones in the central part of the study
area correspond to areas where the influence of human activities responsible for
increasing anthropogenic pollution has been noted in numerous studies ([5] [6]
[8]). In these areas, nitrate levels are very high and can exceed 50 mg/L, which is
the acceptable standard for drinking water [35]. These high levels come from la-
trines, illegal garbage dumps, and sewage discharge.
The vulnerable areas are also found all along the Chari River, this finding was
also made by [39] using the DRASTIC method. Their presence may be relating
to the type of soil made up of very permeable alluvial deposits present along the
river, moreover the water table is not very deep and it represents high recharge
zones [7].
It should also be noting that in these vulnerable areas that border the Chari
River on both sides, apart from the influence of the above-mentioned sources of
pollution, the use of pesticides and fertilizers contributes to the deterioration of
groundwater quality. In these areas, the population also cultivates vegetables;
therefore, these are areas to be closely monitored.
The very low and low vulnerability class covers about 33% and 54% of the area
study for GOD and SI respectively. They are generally, found in the northern
and northeastern part of area study and are probably relating to the low permea-
bility of the clay-rich unsaturated zone formations and the almost zero recharge
rate. Moreover, when moving away from the river towards the north, the water
table becomes deeper and deeper and is therefore relatively protected. To vali-
date vulnerability maps, we compared the distribution of nitrates in the ground-
water of N’Djamena city Chad with the distribution of vulnerability class.
The nitrate measurement campaign carried out in our area study shows that
there are relatively high values of nitrate in both low vulnerability and medium
and high vulnerability areas according to the methods (Table 5).
The rate of coincidence between the nitrate levels in the water of the city of
N’Djamena Chad and the different class of vulnerability degrees allows us to ob-
serve the following.
For GOD method, 91% of nitrate concentrations below 15 mg/L are measured
in a very low-to-low vulnerability zone and about 9% in a high vulnerability
zone; 100% of values between 15 and 50 mg/L are measured in a low vulnerabil-
ity zone; 100% of values above 50 mg/L are also measured in a low vulnerability
zone. For SI method, 76% of the concentrations below 15 mg/L are measured in
a low vulnerability area and about 24% in a moderate vulnerability area, 100% of
the values between 15 and 50 mg/L in a low vulnerability area; 100% of the val-
ues above 50 mg/L in a high vulnerability area.
In both cases, we note on the one hand a good correspondence between the
DOI: 10.4236/jep.2021.127030 484 Journal of Environmental ProtectionD. Deubalbe et al.
zones of low concentrations of Nitrates and the zones of low vulnerability con-
sidered as “well protected”. Thus, we can consider that this map of spatial dis-
tribution of nitrate rate allows validating the maps of vulnerability pollution.
However, we note the presence of high nitrate levels in areas of very low and low
vulnerability, which confirms that the water tables of N’Djamena city Chad are
likely to be threatened locally by the infiltration of pollutants. This situation is
quite possible because the notion of vulnerability is not synonymous with cur-
rent pollution, but rather with a predisposition of these areas to possible conta-
mination, if nothing is undertaken to protect them [40] [41].
At the SI level, we have the best coincidence (100%) between Nitrate concen-
trations above 50 mg/L and the high vulnerability zone. Considering that high
nitrate levels are related to anthropogenic pollution not intrinsic pollution (hy-
drogeological context of the area), we can say that this high coincidence rate
shows that the specific SI method better assesses nitrate vulnerability in the case
of our study.
6. Conclusions
In this study, we chose two methods (GOD and SI) to evaluate the vulnerability
to chemical pollution of N’Djamena city Chad. The results show that there is a
difference in the number of class’s degrees of vulnerability. We obtained four
(04) classes of vulnerability for GOD method: the high vulnerability class (38%),
the moderate vulnerability class (29%), the low vulnerability class (21%) and the
very low vulnerability class (12%), against two (02) classes of vulnerability for SI
method, namely the classes of low vulnerability (54%) and moderate (46%).
The vulnerability mapping of our area study shows that the moderate and
high vulnerability areas cover about 67% and 46% respectively for GOD and SI.
These areas include certain neighborhoods in the center (Am Riguebé, Ridina,
Paris-Congo, Moursale), in the east (Gassi) and in the north (Achawayil, Lamad-
ji), as well as all the areas along the Chari and Logone rivers (Sabangali, Farcha,
Melezi, Ngueli, Walia, Ndigangali, Ngomba).
The analysis of vulnerability maps (GOD and SI) to groundwater pollution in
N’Djamena Chad shows that the vulnerability degree is a function of lithology
and permeability of soil; in fact, the risk of pollution of water table of N’Djamena
city Chad is greater in the sandy facies than in the clay facies of the unsaturated
zone.
Comparing the distribution of nitrates in the groundwater of N’Djamena city
Chad and the distribution of vulnerability classes, we note that 91% of samples
with very low nitrate levels (0 to 15 mg/L) coincide with the very low-to-low
vulnerability zones for GOD method. Whereas with the SI method the coinci-
dence rate is 76% with the low vulnerability zones that, we consider being “well
protected” zones. This overlay allows us to say that the maps elaborated reflect
the reality on the ground. Apart from that, we also found that the coincidence
rate between high nitrate concentrations (>50 mg/L) and the high vulnerability
DOI: 10.4236/jep.2021.127030 485 Journal of Environmental ProtectionD. Deubalbe et al.
class (100%). This shows that the specific SI method assesses nitrate vulnerability
better than the GOD method. This finding is quite logical because the SI method
integrates land use in its formula.
In any case, it seems undeniable that the groundwater of Ndjamena Chad is
exposed to the risks of pollution linked to both the hydrogeological context of the
aquifer system and to human activities. The risk of nitrate pollution of the city’s
water is real but variable in places. It is therefore desirable to monitor areas with
high nitrate content (an indicator of anthropogenic pollution). Water quality
and health are inseparable couple. Such a risk of pollution can pose a long-term
problem for public health.
In view of the problem and the real issues related to the risk of vulnerability
groundwater in the Ndjamena city Chad, in terms of operational perspectives, it
is relevant to develop (N’djamena Town Hall) an interministerial strategic plan
for integrated management of pollution risks on natural resources.
This will not only help to raise awareness among the population on behavioral
change in terms of integrated management groundwater resources (IWRM) but
will also help to preserve natural resources. It is important not to lose sight of
the promotion of rational use of phytosanitary products (fertilizers, pesticides,
herbicides, etc.) and of the environment (promotion of hygiene and basic sanita-
tion services) in the areas concerned. Finally, a new research base can be launched
through studies of the sanitary and environmental impact of nitrate and other
pollutants in anomalous or vulnerable areas.
Conflicts of Interest
The authors declare no conflicts of interest regarding the publication of this pa-
per.
References
[1] Ouattara, A., Meite, A., Sally, T., Ouattara, H. and Kati Koulibali, S. (2016) Etude de
la qualité des eaux de consommation dans la localité de N’Zianouan s/p de Tiassalé
et des quartiers précaires de trois communes de district d’Abidjan (Koumassi, Treichille,
Attécoubé). Journal of Applied Biosciences, 102, 9708-9715.
[2] Bosca, C. (2002) Groundwater Law and Administration of Sustainable Development.
Mediterranean Magazine Science, Training and Technology, 13-14.
[3] Baghvand, A., Nasrabadi, T., Nabibidhendi, G., Vosoogh, A., Karbassi, A. and Me-
hradadi, N. (2010) Groundwater Quality Degradation of an Aquifer in Iran Central
Desert. Desalination, 260, 264-275. https://doi.org/10.1016/j.desal.2010.02.038
[4] Chaffai, H., Laouar, R., Djabri, L. and Hani, A. (2006) Etude de la vulnérabilité a la
pollution des eaux de la nappe alluviale de Skikda: Application de la méthode
DRASTIC. Bulletin du Service Géologique National, 17, 63-74.
[5] Djoret, D. (2000) Etude de la recharge de la nappe du Chari Baguirmi par des méthodes
chimiques et isotopiques. Thèse de l’Université d’Avignon des pays de Vaucluse
(France), 161 p.
[6] Kadjangaba, E., Travi, Y. and Puig, J.M. (2006) Influence des rejets d’eaux usées et
des décharges sauvages sur la qualité des eaux souterraines de la ville de N’Djaména
DOI: 10.4236/jep.2021.127030 486 Journal of Environmental ProtectionD. Deubalbe et al.
(TCHAD). Journal Algérien des Région Arides, Numéro Spéciale, 101-104.
[7] Kadjangaba, E., Huneau, F., Travi, Y. and Djoret, D. (2017) Recharge and Ground-
water Quality of an Alluvial Aquifer: Case of the City of N’djamena (Chad). Journal
of Environmental Science and Engineering B, 6, 493-505.
https://doi.org/10.17265/2162-5263/2017.10.001
[8] Kadjangaba, E., Djoret, D., Doumnang, M.J.C., Ndoutamia, G.A. and Mahmout, Y.
(2018) Impact des Processus Hydrochimique sur la Qualité des Eaux souterraines
de la Ville de N’Djaména-Tchad. European Scientific Journal, 18, 162-177.
https://doi.org/10.19044/esj.2018.v14n18p162
[9] Champagne, L. and Chapuis, R.P. (1993) Évaluation de la vulnérabilité à la pollution
des formations aquifères de la MRC de Montcalm selon la méthode Drastic. Revue
des Sciences et Techniques de l’Eau, 26, 76-169.
[10] Elfarrak, H., Hakdaoui, M. and Fikri, A. (2014) Development of Vulnerability through
the DRASTIC Method and Geographic Information System (GIS) (Case Ground-
water of Berrchid), Morocco. Journal of Geographic Information System, 6, 45-58.
https://doi.org/10.4236/jgis.2014.61006
[11] Drias, T. and Toubal, A.C. (2015) Cartographie de la vulnérabilité a la pollution de
la nappe alluviale de Tebessa-Morsott (bassin versant de l’Oued Ksob) extrême est
algérien. Larhyss Journal, 22, 35-48.
[12] Guillaume, M. and Marie, L. (2015) Étude de la vulnérabilité de l’eau souterraine
sur la zone Bécancour (Centre-du-Québec), Géohydro 2011. 7 p.
[13] Vrba, J. and Zaporozec, A. (1994) Guidebook on Mapping Groundwater Vulnerability.
IAH International Contributions to Hydrogeology, Vol. 16, FRG, Heise Publication,
Hannover, 131 p.
[14] Civita, M. (1994) Le carte della vulnerabilit’a degli acquiferi all’inquinamiento: Teo-
ria e pratica [Contamination Vulnerability Mapping of the Aquifer: Theory and
Practice]. Quaderni di Tecniche di Protezione Ambientale, Pitagora.
[15] Foster, S. (1987) Fundamental Concepts in Aquifer Vulnerability, Pollution Risk
and Protection Strategy. In: Van Duijvenbooden, W. and Van Waegeningh, H., Eds.,
Vulnerability of Soil and Groundwater to Pollution, TNO Committee on Hydrological
Research, The Hague, 69-86.
[16] Ribeiro, L. (2000) Evaluation of an Intrinsic and a Specific Vulnerability Assessment
Method.
[17] Gac, J.Y. (1980) Géochimie du bassin du lac-Tchad. Travaux et documents de
l’O.R.S.T.O.M. n° 1243, 251 p.
[18] Olivry, J.C., Chouret, A., Vuillaume, G., Lemoelle, J. and Briquet, J.P. (1996) Hydrologie
du lac Tchad. Monographies hydrologique 12. ORSTOM, Paris.
[19] Schneider, J.L. and Wolff, J.P. (1992) Carte géologique et Hydrogéologique au 1/1
500 000 de la République du Tchad. Mémoire explicatif. Document BRGM n° 209,
Vol. 1, 2, 689 p.
[20] BRGM (1988) Etude de la vulnérabilité des nappes aquifères superficielles de
N’Djaména (Tchad) et recommandations pour les aménagements. 90 p.
[21] Kushnir, I. (1993) Géologie, ressources minérales et ressources en eau au Tchad.
Travaux et documents scientifiques du Tchad. Connaissance du Tchad I. 100 p.
[22] IWAKO (1985) Les ressources en eaux du Tchad. Rapport technique.
[23] BRGM (1967) Etude géochimique des eaux souterraines de l’Afrique de l’Ouest
(Tchad), Comité Inter Africain Hydraulique (bureau technique). DAK 67-A62.
DOI: 10.4236/jep.2021.127030 487 Journal of Environmental ProtectionD. Deubalbe et al.
[24] Latifi, S. and Chaab, S. (2017) Assessment and Mapping of the Vulnerability to Pol-
lution of the Groundwater, Using the Both DRASTIC and GOD Methods, in Al-
luvial Plain of Guelma, Northeast of Algeria. Synthèse: Revue des Sciences et de la
Technologie, 34, 48-62.
[25] Murat, V., Paradis, D., Savard, M.M., Nastev, M., Bourque, E., Hamel, A., Lefebvre,
R. and Martel, R. (2003) Vulnérabilité à la nappe des aquifères fracturés du Sud-Ouest
du Québec: Evaluation par les méthodes DRASTIC et GOD. Ressources naturelles
Canada, Commission Géologique, 16. https://doi.org/10.4095/214216
[26] Aller, L., Bennett, T., Lehr, J.H., Petty, R.J. and Hackett, G. (1987) Drastic: A Stan-
dardized System for Evaluating Groundwater Pollution Potential Using Hydrogeo-
logic Settings. US-EPA Report 600/2-87-035, 622 p.
[27] Hamza, M.H., Added, A., Frances, A. and Rodriguez, R. (2007) Validité de l’appli-
cation des méthodes de vulnérabilité DRASTIC, SINTACS et SI à l’étude de la pollution
par les nitrates dans la nappe phréatique de Metline-Ras Jebel-Raf Raf (Nord-Est
Tunisien). Géoscience, 339, 493-505. https://doi.org/10.1016/j.crte.2007.05.003
[28] Ewodo Mboudou, G., Auguste, O., Bon, A.F., Ntep, F. and Bineli, E. (2016) Apport
des méthodes paramétriques DRASTIC, GOD et SI à l’évaluation de la vulnérabilité
intrinsèque dans les aquifères du bassin versant de l’Abiergué (région de Yaoundé).
Revue CAMES, 4, 67-78.
[29] Corine Land Cover (1993) European Community, Guide Technique. Office des
publications Officielles des Communautés Européennes. Série environnement, sécurité
nucléaire et protection civile, Bruxelles.
[30] Ake, G.E., Kouadio, B.H., Dongo, K., Dibi, B., Kouame, F.K. and Jean Biemi, J.
(2010) Application des méthodes DRASTIC et SI pour l’étude de la vulnérabilité à la
pollution par les nitrates (No3−) de la nappe de Bonoua (Sud-Est de la Côte d’Ivoire).
International Journal of Biological and Chemical Sciences, 4, 1676-1692.
https://doi.org/10.4314/ijbcs.v4i5.65557
[31] Allechy, F.B., Lasm, T., Youan, T.M., Yao, K.A.F., Kouakou, O.S., Oka, K.A.R.,
Baka, D. and De Lasme, O.Z. (2016) Cartographie de la vulnérabilité à la pollution
des aquifères du socle Précambrien: Cas de la région d’Oumé (Centre-ouest de la
Côte d’Ivoire). European Scientific Journal, 12, 1857-7431.
https://doi.org/10.19044/esj.2016.v12n20p374
[32] Boualla, N., Benziane, A. and Ait-Mokhtar, A. (2017) Assessing Vulnerability of
Groundwater with GOD Model: A Case Study in Oran Sebkha Basin Algeria. Jour-
nal of New Technology and Materials, 7, 18-26.
https://doi.org/10.12816/0044031
[33] Achour, M., Hassani, M.I., Mansour, H., Hadj Brahim, A. and Bensaha, H. (2019)
Contribution of the GIS to the Establishment of the Intrinsic Map Vulnerability of
the Water-Table Aquifer of the Wadi M’zab, Algeria. Journal Algérien des Régions
Arides (JARA), 13, 103-113.
[34] Armanuos, A.M., Allam, A. and Negm, A.M. (2020) Assessment of Groundwater
Vulnerability to Pollution in Western Nile Delta Aquifer, Egypt. International Wa-
ter Technology Journal, 10, 18-40.
[35] World Health Organization (2004) Guidelines for Drinking Water Quality, Vol. 1
Recommendations. 3rd Edition, WHO, Geneva.
https://www.who.int/water_sanitationhealth/publications/facts2004/en/index.html
[36] Ewodo, M.G., Ombolo, A., Kouame, K.J., Bon, A.F. and Bineli, E. (2015) Evaluation
of the Intrinsic Vulnerability of the Mingosso Watershed (Yaounde Region) by Pa-
rametric Methods DRASTIC, SI and GOD. International Journal of Innovation and
DOI: 10.4236/jep.2021.127030 488 Journal of Environmental ProtectionD. Deubalbe et al.
Applied Studies, 12, 266-286.
[37] Simboro, A. (2015) Gestion quantitative et qualitative des ressources en eau dans la
plaine alluviale de Karfiguéla à l’aide d’un SIG: Etude de la recharge induite de la
nappe et sa vulnérabilité à la pollution, Institut International d’Ingénierie (2iE)
Burkina Faso. 71 p.
[38] Jourda, J.P., Saley, M.B., Djagoua, E.V., Kouame, K.J., Biemi, J. and Razack, M.
(2006) Utilisation des données ETM+ de Landsat et d’un SIG pour l’évaluation du
potentiel en eau souterraine dans le milieu fissuré précambrien de la région de
Korhogo (nord de la Côte d’Ivoire): Approche par analyse multicritère et test de
validation. Revue de Télédétection, 5, 339-357.
[39] Hamit, A., Lucas, K., Sakamou, I.E. and Adoua, N.K. (2017) Assessment of the Vul-
nerability of Groundwater to Pollution in N’Djamena (Chad) Using the DRASTIC
Index Method. International Journal of Current Research, 9, 58911-58919.
[40] Kouame, K.J. (2007) Contribution à la Gestion Intégrée des Ressources en Eaux
(GIRE) du District d’Abidjan (Sud de la Côte d’Ivoire): Outils d’aide à la décision
pour la prévention et la protection des eaux souterraines contre la pollution. Thèse
de Doctorat, Université de Cocody, Abidjan, 250.
[41] Koudou, A., Assoma, T.V., Adiaffi, B., Youan, T.A.M., Saley, M.B. and Kouame,
K.F. (2017) Assessment of Fracturing Influence in the Touchness to the Aquifers
Pollution of the Contact Zone between Bedrock and Sedimentary Basin in the
Southeast of Côte D’ivoire. Larhyss Journal, 32, 71-91.
DOI: 10.4236/jep.2021.127030 489 Journal of Environmental ProtectionYou can also read