Droplet-based digital antibiotic susceptibility screen reveals singlecell clonal heteroresistance in an isogenic bacterial population - Karol Makuch
←
→
Page content transcription
If your browser does not render page correctly, please read the page content below
www.nature.com/scientificreports

            OPEN           Droplet-based digital antibiotic
                           susceptibility screen reveals single-
                           cell clonal heteroresistance in an
                           isogenic bacterial population
                           Ott Scheler 1,2,3*, Karol Makuch1,4, Pawel R. Debski1, Michal Horka1, Artur Ruszczak1,
                           Natalia Pacocha1, Krzysztof Sozański1, Olli-Pekka Smolander 2, Witold Postek1 &
                           Piotr Garstecki 1*
                           Since antibiotic resistance is a major threat to global health, recent observations that the traditional
                           test of minimum inhibitory concentration (MIC) is not informative enough to guide effective antibiotic
                           treatment are alarming. Bacterial heteroresistance, in which seemingly susceptible isogenic bacterial
                           populations contain resistant sub-populations, underlies much of this challenge. To close this gap, here
                           we developed a droplet-based digital MIC screen that constitutes a practical analytical platform for
                           quantifying the single-cell distribution of phenotypic responses to antibiotics, as well as for measuring
                           inoculum effect with high accuracy. We found that antibiotic efficacy is determined by the amount of
                           antibiotic used per bacterial colony forming unit (CFU), not by the absolute antibiotic concentration,
                           as shown by the treatment of beta-lactamase-carrying Escherichia coli with cefotaxime. We also noted
                           that cells exhibited a pronounced clustering phenotype when exposed to near-inhibitory amounts of
                           cefotaxime. Overall, our method facilitates research into the interplay between heteroresistance and
                           antibiotic efficacy, as well as research into the origin and stimulation of heterogeneity by exposure
                           to antibiotics. Due to the absolute bacteria quantification in this digital assay, our method provides a
                           platform for developing reference MIC assays that are robust against inoculum-density variations.

                           Antibiotic resistance is one of the largest threats to global health1,2. In 2015, >650,000 cases of antibiotic-resistant
                           infections were reported in the EU/EEA area, of which >30,000 resulted in death3. In the same year, the World
                           Health Organization endorsed a global action plan to tackle this challenge, including calling for better under-
                           standing of the mechanisms underlying resistance and for developing better diagnostic tools4.
                               Often resistance arises against beta-lactam antibiotics3, which target cell wall-synthesis mechanisms in bac-
                           teria5,6. In Gram-negative bacteria, beta-lactamase enzymes that degrade beta-lactam antibiotics often cause the
                           resistance. Genes encoding beta-lactamases evolve quickly and spread horizontally, driving the spread of resist-
                           ance5. One of the most widespread beta-lactamase protein families associated with resistance is the TEM family5,7.
                               Resistance often evolves when even only a few bacteria escape antibiotic treatment. While the genetic mecha-
                           nisms of drug resistance (mutations, plasmid transfer, etc.) are quite well known8,9, associated phenotypic drivers
                           (such as phenotypic heterogeneity) remain poorly studied. Various mechanisms underlie phenotypic heteroge-
                           neity10,11; different protein-expression levels can confer ‘resistance’ on some fraction of the bacteria12, and per-
                           sistence can arise when some fraction of bacteria survive by remaining dormant during antibiotic treatment11.
                               Heteroresistance is a form of phenotypic heterogeneity in which seemingly susceptible isogenic bacterial
                           populations contain resistant sub-populations13. It is widely prevalent in pathogenic bacteria14, causing possi-
                           ble false negatives in antibiotic susceptibility testing14,15. Thus, there is an urgent need for efficient methods for
                           characterizing heteroresistance, which currently can only be approximated with methods that are labour- and
                           time-intensive14.

                           1
                            Institute of Physical Chemistry, Polish Academy of Sciences, Kasprzaka 44/52, 01-224, Warsaw, Poland.
                           2
                            Department of Chemistry and Biotechnology, Tallinn University of Technology, Akadeemia tee 15, 12618, Tallinn,
                           Estonia. 3Institute of Molecular and Cell Biology, University of Tartu, Riia 23, 51010, Tartu, Estonia. 4Division of
                           Chemistry and Chemical Engineering, California Institute of Technology, Pasadena, California, 91125, USA. *email:
                           ott.scheler@taltech.ee; garst@ichf.edu.pl

Scientific Reports |   (2020) 10:3282 | https://doi.org/10.1038/s41598-020-60381-z                                                               1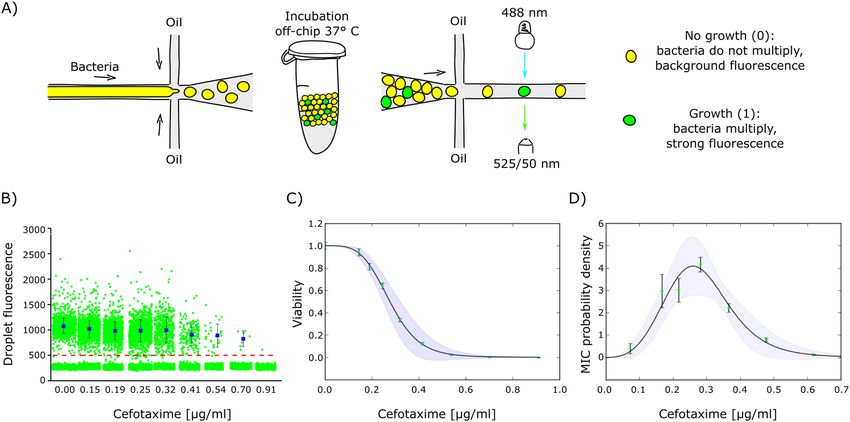
www.nature.com/scientificreports/                                                               www.nature.com/scientificreports

                           Figure 1. Cefotaxime reveals an E. coli heteroresistance pattern at the single-cell level. (A) Microfluidic
                           workflow for the single-cell droplet assay in which an aqueous phase (consisting of bacteria, medium, and
                           antibiotics) are encapsulated in surfactant-stabilized water-in-oil droplets. Each antibiotic concentration is
                           screened in a separate library. During incubation, encapsulated bacteria start proliferating and synthesizing
                           YFP, unless growth is inhibited by the antibiotic. After incubation, the fluorescence readout of each droplet is
                           acquired with confocal microscopy. In principle, the assay is ‘digital’: the bacterium either grows (1-positive) or
                           does not (0-negative). (B) Signal intensities of each droplet in the experiment (~10000 droplets per antibiotic
                           concentration of which ~1500 droplets contained bacteria). Red dashed line at relative fluorescence value 500
                           marks the threshold for positive droplets. Blue rectangles show the average signal of positive droplets, with
                           standard deviation as error bars. (C) Cell viability (fraction of positive droplets normalized by the value for the
                           experiment without antibiotic, f+ c (0)) as a function of antibiotic concentration c. Error bars are discussed in
                                                               f+
                           Fig. S5. Continuous line represents 1/[1 + (c /cs )α + a1(c /cs )2α ], with fitting parameters
                           cs = (0.29 ± 0.029) µg /ml , α = 3.78 ± 0.76, and a1 = 0.26 ± 0.52 determined by the least-square method.
                           Errors and the error propagation formula applied to the fit determine the shaded area. (D) Probability
                           distribution of individual MICs in the population obtained from a numerical derivative of the data points in
                           (C). Continuous line represents the negative derivative of the fit from (C) (the probability distribution of single-
                           cell MICs in the population). The shaded area shows errors obtained from the error propagation formula
                           applied to the negative derivative of fit from (C).

                               Here, we tackled this challenge with a strategy reliant on droplet microfluidics: micro-channels are used to
                           disperse aqueous samples into an oil phase in a controlled fashion, yielding thousands of parallel reaction ves-
                           sels16–18. Droplets enable single-cell encapsulation on a massive scale, opening avenues to high-throughput analy-
                           sis of bacteria and their responses to antibiotics at the single-cell level19. We developed a method for droplet-based
                           digital quantification of the distribution of clonal heteroresistance at the single-cell level, and we integrated a
                           digital susceptibility assay against cell density. We demonstrated that, for the antibiotic-bacteria combination
                           tested here, it is the amount of antibiotic per bacterium and not the antibiotic concentration per se that deter-
                           mines growth inhibition. Our approach also uncovered and quantified the tendency of bacteria to agglomerate
                           at near-inhibitory drug conditions, highlighting that this method could be important for research into the onset
                           of biofilm formation. Taken together, the technology and findings we describe here provide novel, quantitative
                           insights into bacterial heteroresistance, a key step toward understanding antibiotic resistance and developing new
                           tools to prevent further escalation of the antibiotics crisis.

                           Results and Discussion
                           Analysis of heteroresistance using droplet microfluidics. To capture the growth patterns of isolated
                           single bacterial exposed to antibiotics, we encapsulated bacteria into water-in-oil droplets. We used a model
                           weakly beta-lactam-resistant organism, Escherichia coli DH5α, carrying a TEM-20 beta-lactamase gene on a
                           plasmid. This strain also harbours a second plasmid with yellow fluorescent protein (YFP) for detection. To assay
                           resistance, we measured the minimum inhibitory concentration (MIC) of an antibiotic that prevents bacterial
                           proliferation20.
                               We used microfluidic chips with flow-focusing geometry to generate libraries of monodisperse 2-nl droplets
                           that act as separate, miniature test tubes (Fig. 1A). We encapsulated cells with the beta-lactam antibiotic cefotax-
                           ime (formulating a separate droplet library for each antibiotic concentration), incubated the bacteria overnight,
                           and screened droplets for increased fluorescence caused by fully grown (saturated) colonies (see Figs. S1–S4 for

Scientific Reports |   (2020) 10:3282 | https://doi.org/10.1038/s41598-020-60381-z                                                             2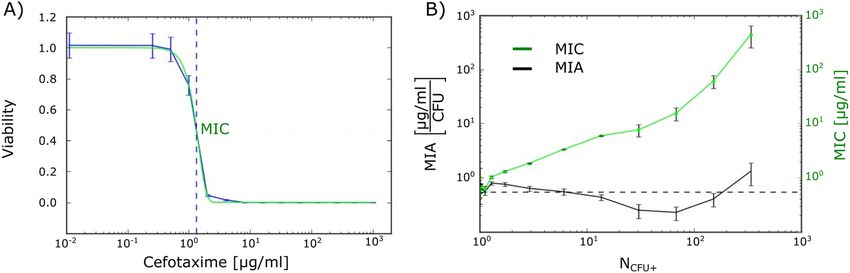
www.nature.com/scientificreports/                                                               www.nature.com/scientificreports

                           more detailed information about droplet generation and analysis). The term ‘colony’ here captures an accumu-
                           lation of microbes in a droplet, usually occurring as a clone of a single original organism16,21. Therefore, a ‘single
                           cell’ is equivalent to a single colony-forming unit (CFU). One bacterium per 2-nl droplet is equivalent to 5 × 10⁵
                           CFU/ml, which is the standard for MIC tests20,22.
                               Antibiotic susceptibility screening in droplets constitutes a digital assay23,24 in which the outcome of each dis-
                           crete experiment in droplet is binary: ‘1-positive’ with detectable bacterial growth, or ‘0-negative’ without growth.
                           We split the starting cell suspension (~1 × 10⁵ CFU/ml) into droplets. Of the total number of droplets, N, some
                           are seeded with bacteria. Similar to a standard plating experiment, while we cannot visualize individual cells, we
                           can count the number of ‘positive droplets’, N+, after incubation. We use the fraction of positive droplets N+/N in
                           experiments without antibiotics to calculate the rate of bacterial encapsulation inside droplets. In digital assays24,
                           this process is described by the Poisson distribution with an average encapsulation rate λ = −ln(1 − N+/N).
                               In order to measure the distribution of antibiotic susceptibility of single cells, we assume that the vast majority
                           of non-empty droplets contain only a single cell. To minimize the probability of encapsulating two or more cells
                           in a single droplet, the starting inoculum suspension must be diluted so that the encapsulation rate λ (average
                           number of bacteria per droplet) is 0.1–0.3 or lower24. In our case, λ was ~0.18, and for each antibiotic concentra-
                           tion we screened libraries containing ~1,500 non-empty droplets.
                               For each library with a given antibiotic concentration, c, we count the total number of droplets, N(c), and
                           measure number of positive droplets, N+(c). The fraction of positive droplets is denoted by f+(c) = N+(c)/N(c);
                           see Fig. S5 for error analysis. Further, in order to analyse the response of bacteria to antibiotic, we normalize the
                           number of positive droplets by their number in the absence of antibiotic, to obtain the fraction of individual cells
                           that proliferate as a function of antibiotic concentration: F(c) = f+(c)/f+(0).
                               We observed that our model isogenic bacterial population exhibited a high degree of phenotypic growth vari-
                           ability between individual cells. Growth inhibition decreased gradually as the antibiotic concentration increased,
                           with no sharp (Heaviside step function) transition between ‘growth’ and ‘no growth’ (Fig. 1B,C). Partial growth
                           inhibition was evident at antibiotic concentrations as low as 0.15 µg/ml, but the lowest concentration yielding
                           maximum inhibition was more than 10-fold higher, at 2 µg/ml (Fig. 1C). At the same time, colony density (indi-
                           cated by fluorescence intensity in positive droplets) remained steady even when the fraction of positive droplets
                           substantially dropped (Fig. 1B). This observation suggests that bacterial proliferation in droplets is a binary sto-
                           chastic variable: individual cells either grow into colonies or they do not. Thus, we can reliably translate the frac-
                           tion of proliferating cells in a droplet into the probability of single cells proliferating in a population.
                               We propose to employ the probability distribution density, p(MIC), of cells exhibiting a given MIC as a
                           well-defined measure of heterogeneity. This probability can be calculated directly from the identity
                                        ∞
                           F(c ) = ∫ p(m)dm; bacteria that proliferate at a given antibiotic concentration c are characterized by MIC level
                                      c
                           m ≥ c. Thus, p(c ) = − d F(c ) (Fig. 1D).
                                                      dc
                               The resistance profile described here is heteroresistance by definition: the lowest antibiotic concentration
                           inhibiting 100% of bacterial proliferation is >8-fold higher than the highest non-inhibitory concentration13,
                           similar to the heteroresistance pattern on Fig. 1C. The term heteroresistance is used very liberally and often
                           confusingly in the literature13, with synonyms like ‘transient resistance’25 and ‘dose-dependent persistence’11. This
                           confusion is why we prefer the term ‘clonal heteroresistance’, introduced recently by Band et al.15, to emphasize
                           our description of resistance profiles in isogenic bacterial populations originating from a single colony.
                               It is highly unlikely that the emergence of spontaneously resistant mutants explains the variety in resistance
                           detected here, because the mutation rate in bacteria is orders of magnitude lower26 than the fraction of growing
                           bacteria in this experiment. Nor can this diverse resistance profile be explained by the presence of time-dependent
                           persister cells, as in our setup the bacteria grow under constant antibiotic exposure11.
                               To the best of our knowledge, this is (1) the first quantitative description of the diversity of clonal heter-
                           oresistance at the single-cell level, and (2) the first portrayal of the resistance probability distribution of single
                           bacterial cells in an isogenic population. Recently, Lyu et al.19 used a similar droplet-based microfluidic setup to
                           describe an increase in resistance at the single-cell level. However, they did not analyse the resistance profile of
                           an isogenic bacterial population; rather, they evaluated the emergence of sub-populations with higher resistance
                           during antibiotic exposure, which can be caused by the acquisition of novel genetic mutations19. Previously, Eun
                           et al. unknowingly captured a heteroresistance pattern with rifampicin in a gel-droplet assay, but they did not
                           draw attention to it27. When we reanalysed data from Fig. 3 of Eun et al.27, we noted that their probability distri-
                           bution was similar to ours (Fig. S7).
                               We speculate that the clonal heteroresistance detected here most likely arises from differences in the expres-
                           sion of TEM-20, an extended-spectrum beta-lactamase, or more globally from differences in the entire transcrip-
                           tome of resistant cells. In our model system, expression of the gene encoding TEM-20 is likely noisy28, as it is
                           modulated by at least two stochastic components: the copy number of the plasmid carrying TEM-20 and the gen-
                           eral variability of gene expression10,29. Recently it was reported that a copy-number increase in resistance genes
                           most often underlies heteroresistance which can lead to non-optimal antibiotic treatment regimens and relapse
                           of infections14. Heterogeneity in the expression of drug-resistance proteins like beta-lactamases30 or multi-drug
                           efflux pumps31 have also been strongly linked to heteroresistance. As we discuss below, our method enables esti-
                           mation of the degradation rate of antibiotics, with results consistent with the above assertions.

                           Modulation of antibiotic susceptibility with increasing inoculum density. In a complementary
                           experiment, we investigated how the susceptibility of E. coli to an antibiotic changes with increasing inoculum
                           density. Beta-lactam antibiotics are often subject to the inoculum effect, in which the efficiency of a drug depends
                           on the starting inoculum density of the bacteria32. The inoculum effect is often overlooked in traditional MIC

Scientific Reports |   (2020) 10:3282 | https://doi.org/10.1038/s41598-020-60381-z                                                              3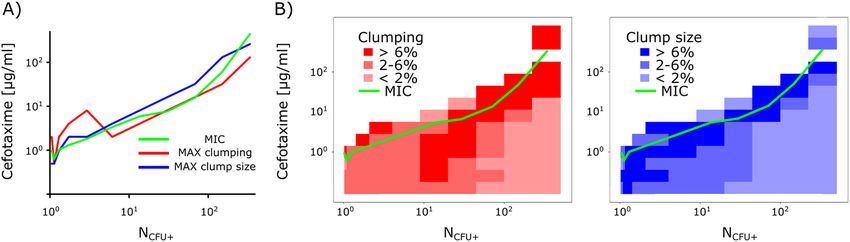
www.nature.com/scientificreports/ www.nature.com/scientificreports
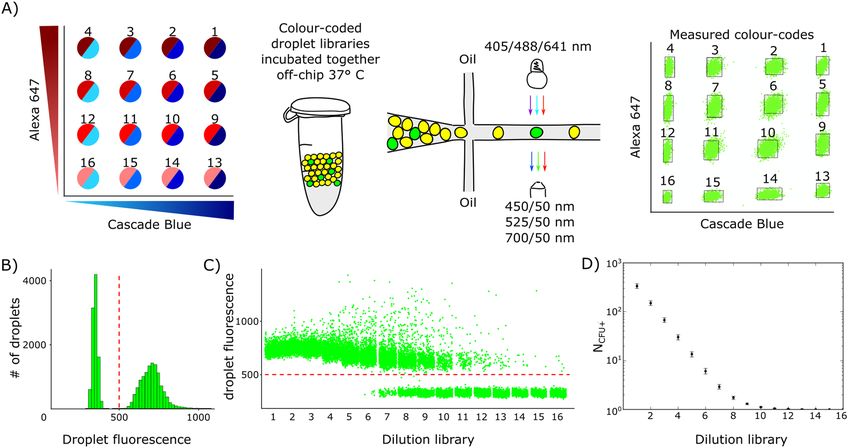
Figure 2. A colour-coded droplet virtual array reveals inoculum density. (A) Schematic for colour-coding
bacterial densities. Cascade Blue and Alexa 647 dyes are represented in the virtual array as a 4 × 4 concentration
matrix of 16 colour-code combinations (darker colour corresponds to higher dye concentration). Two-fold
serial dilutions of bacteria are colour-coded and introduced sequentially into the microfluidic system for droplet
generation. Colour-coded droplet libraries are pooled into a single master library. After incubation, droplet
fluorescence is acquired in three separate channels (three arrows). Droplets are gated to 16 bins in a virtual
array based on their Cascade Blue and Alexa 647 signal intensities (virtual array with ~22000 droplets). (B)
Histogram of the pooled droplet signals, with bacterial growth in the green channel. Red dashed line denotes
the threshold between negative and positive droplets. (C) Plot of bacterial growth (relative fluorescence of
droplet in green channel) measured separately in each droplet. Droplets are sorted according to their colour-
code allocation in the virtual array (the same data as in (A,B). Note the substantial population of droplets with
high fluorescence intensity (near 1000 and above). This phenomenon is explained in “clumping” section. (D)
Average number of bacteria in non-empty droplets (NCFU+) in various virtual array libraries (Fig. S5).
assays due to inaccuracies in setting the inoculum density to recommended levels via conventional measurements
of optical density22. Our digital MIC assay overcame this hurdle.
To precisely estimate bacterial densities and to measure inoculum effect, we harnessed the ‘virtual array’ strat-
egy described by Abate et al.33 to pool droplet libraries for easier downstream handling and analysis. We prepared
series of 16 two-fold dilutions of our YFP-carrying E. coli and labelled each dilution with two fluorescent dyes:
Cascade Blue and Alexa 647 (both from Thermo Fisher Scientific; Fig. 2A). Immediately after generation, the 16
colour-coded libraries were pooled into a single 1.5-ml test tube for overnight incubation at 37 °C.
We calculated the initial inoculum density in the virtual array using a digital counting algorithm and equa-
tions described previously23,34. We set a fluorescence threshold to distinguish between growth-positive and
growth-negative droplets (Fig. 2B). Next, we separately investigated each library in a virtual array to calculate
the corresponding fractions of positive droplets (Fig. 2C). We calculated the average droplet occupation event
for each library as ‘CFU/positive bacteria-containing droplet’ (NCFU+) (Fig. 2D). See Fig. S5 for more detailed
explanation of the calculations. The average NCFU+ spanned over two orders of magnitude, from 1 to ~338 per
droplet (Fig. 2D), which translates to an inoculum range between 5 × 10⁵ and ~1.7 × 10⁸ CFU/ml conventionally.
To investigate the inoculum effect, we produced a series of separate virtual arrays with cefotaxime concentra-
tions ranging from 0.25 to 1024 μg/ml, with a twofold dilution between samples. We used one virtual array with-
out antibiotics as a control. For each bacterial density, we fit the positive droplet fraction data with the Gompertz
function35,36. Then, we calculated the MIC as the antibiotic concentration where the Gompertz fit crosses the
0.5 viability fraction in droplets (Fig. 3A), meaning that the inhibition of bacteria growth occurs in 50% of the
droplets.
We observed a strong inoculum effect22: the MIC rose more than 8-fold as the bacterial density increased by
two orders of magnitude (Fig. 3B). This was expected, as similar findings have been reported previously with the
same bacterial strain32. We also detected a similar inoculum effect in a coinciding experiment with a different
microfluidic setup using smaller droplets and different growth medium37. Interestingly, when we examined
growth inhibition per capita, MIC /NCFU + in our experiment, the amount of cefotaxime needed to suppress growth
remained stable around 0.5 µg/ml/CFU (Fig. 3B).
Together, these data suggest that the amount of antibiotic per bacterium is the crucial parameter that deter-
mines growth inhibition: MIA = MIC /NCFU +, where MIA is the minimum inhibitory amount of antibiotic nor-
Scientific Reports | (2020) 10:3282 | https://doi.org/10.1038/s41598-020-60381-z 4www.nature.com/scientificreports/ www.nature.com/scientificreports
Figure 3. The inhibiting amount of cefotaxime per bacterium remains stable over a wide range of bacterial
densities. (A) Calculation of MIC using a Gompertz function fit (green line) with bacterial density
NCFU + = 1.73. Blue vertical dashed line shows the position of the MIC where the Gompertz fit crosses the 0.5
viability fraction in droplets. (B) Comparison of MIC (green) and minimum inhibitory amount (MIA; black)
for various inoculum densities. MIA is defined as the amount of antibiotic per bacterium inside non-empty
droplets normalized by the droplet volume: MIA = MIC /NCFU +. Dashed line shows the average MIA.
malized by the droplet volume. We suggest including this parameter in future assays of antibiotic susceptibility.
With limited beneficial interactions between bacteria during antibiotic exposure, the MIA remains stable regard-
less of bacterial inoculum density. However, if MIA were to significantly increase during incubation, then a syn-
ergistic effect may be taking place as bacteria fight the antibiotics.
We used the MIA to estimate the maximal rate of degradation of cefotaxime by beta-lactamases in our bacte-
ria. We assumed that MIA corresponds to the highest concentration of antibiotic that can be hydrolysed by
enzymes within a time interval, td ≈ 20 min, which approximates (to an order of magnitude) the division time of
this species under normal conditions. Therefore, the rate of degradation of the antibiotic by a single bacterium
inside a droplet of volume v = 2 nl is Vmax = MIA × V /t = 8.3 × 10⁻¹⁹ kg /s. A cefotaxime molar mass of 455 g/
mol yields 106 cefotaxime molecules degraded per second by a single bacterium. This crude estimate is of similar
order as Vmax obtained for the same strain by Artemova et al.32, who previously used Michaelis-Menten kinetics
to calculate enzyme degradation.
An additional advantage of encapsulating bacteria in droplets is that the assay becomes insensitive to fluctua-
tions in inoculum density, in our case below an encapsulation rate λ of ~0.25 (Fig. 2D). Under these conditions,
the inoculum density used to prepare the droplets does not need to be controlled precisely, as the effective max-
imum density of bacteria in droplets will always be 1 bacterium per droplet. Our 2-nl setup therefore ‘locks’ the
assay into the standard 5 × 10⁵ CFU/ml inoculum density recommended by CLSI and by EUCAST, opening new
ways to design novel assays of ‘inoculum density-resistant’ antibiotic susceptibility.
Clumping of bacteria at sub-inhibitory antibiotic conditions. Unexpectedly, we found that our
droplet-based system is also an excellent tool for high-throughput analysis of bacterial clumping. We first noticed
clumping in the control virtual array, where we observed outlier droplets presenting fluorescence above the usual
intensities for positive droplets (Fig. 2C). Closer study of relevant confocal images (Fig. S8) revealed clusters
of high-intensity pixels inside those droplets, which we interpreted as bacterial clumps. We measured the rel-
ative size of the clumps by dividing the total area of clumps within a droplet by the droplet area in confocal
cross-section image (Fig. S8).
Clumping was intensive in a certain fraction of droplets above the 90th percentile in terms of the
clump-to-droplet area ratio; we used this value (clump covering ~1% of the droplet in the image) as a threshold
for intensive clumping (Fig. S8). In ~ 80% of clumping cases, we observed a single dominant clump inside the
droplet. Although the droplet assay and confocal imaging were not optimized for clumping analysis and some
clumping events may have been overlooked, any potential mis-representation would be systematic and does not
affect our overall findings or their trends (Fig. S2).
Reanalysis of the inoculum density data revealed that bacterial clumping is modulated by cefotaxime and is
highest at sub-inhibitory drug conditions near the MIC (Fig. 4A). Clumping is also modulated by the inoculum
density: at low antibiotic concentration, droplets harbouring a low density of bacteria exhibit more clumping than
droplets with high bacterial density (Fig. 4B, bottom). Full datasets for clumping events and clump sizes appear
in Table S3 and Table S4, respectively. Recently, we observed similar clumping trends in smaller droplets using a
different growth medium37.
An increased tendency for bacteria to clump or agglomerate under sub-MIC conditions was previously
described for beta-lactams and aminoglycosides during early biofilm formation in several species38,39. We hypoth-
esize that our droplet assay captured the early stages of biofilm formation that are modulated by cefotaxime. Since
we used a system in which water droplets were stabilized in oil using surfactant, there were no solid surfaces or
crevices where bacteria/clumps could attach to form a biofilm, leaving them in a pre-biofilm clumping stage.
Future investigations could add extra beads40 or surfaces41 into droplets to encourage bacterial attachment. With
capabilities beyond those of traditional microscopy and well-plate systems, our high-throughput experimental
design could be advantageous for further basic research into clumping, as well as research into the initiation and
Scientific Reports | (2020) 10:3282 | https://doi.org/10.1038/s41598-020-60381-z 5www.nature.com/scientificreports/ www.nature.com/scientificreports
Figure 4. Cefotaxime modulates the clumping of bacteria. (A) At various inoculum densities, both the highest
clumping (red) and the greatest size of clumps (blue) occur near sub-inhibitory cefotaxime conditions (green).
(B) Heat maps of relative clumping rates (red) and relative clump sizes (blue)) in the matrix of different bacteria
densities (X-axis) and cefotaxime concentrations (Y-axis). Green line shows the approximate MIC in these
experiments (same data as on Fig. 3B).
progression of biofilm formation and how it impacts antibiotic resistance42. This concept could be extended to test
various antimicrobial coatings and their properties.
Conclusion
The droplet-based digital MIC screen described here enabled us to carry out the first quantification of clonal
heteroresistance in an isogenic bacterial population and to determine the probability distribution of MICs. Such
robust measurement of heterogeneity is crucial for understanding how sub-populations of bacteria survive when
exposed to antibiotics and potentially accumulate resistance-increasing mutations. Importantly, we observed that
the relative amount of antibiotic needed to stop bacteria growth was quite stable over a wide range of inoculum
densities; near these inhibiting conditions, bacteria increasingly clumped together. Our microfluidic solution is
also promising for high-throughput investigations of early biofilm formation and its prevention, which is crucial
for combating antibiotic resistance. We predict that the droplet-based technology developed here will soon be
relevant and directly usable in clinical contexts, as there have been rapid improvements in applying label-free
detection principles for droplet-based analysis16.
Methods
Bacteria. For these experiments, we used an Escherichia coli DH5α strain harbouring two plasmids32 (a kind
gift from Professor Jeff Gore, MIT, USA). The first plasmid carries a constitutively expressed YFP gene; we used
50 µg/ml of piperacillin sodium salt (Sigma-Aldrich, Germany) for selection. The second plasmid carries the gene
encoding TEM-20, with 50 µg/ml of kanamycin sulfate (Sigma-Aldrich) used for selection. All experiments, both
in bulk and in droplets, were carried out in LB Lennox medium (Roth, Germany). Antibiotic susceptibility exper-
iments were done with cefotaxime sodium salt (Sigma-Aldrich). Overnight cultures were diluted to the required
densities with fresh medium before droplet experiments were begun, and cells were kept at 4 °C until they were
encapsulated in droplets.
Microfludics. Fabrication of the microfluidic chips used in this work has been described elsewhere23,43. We
employed separate chips for droplet generation and for fluorescence analysis (Fig. S1). We used Novec HFE-7500
fluorocarbon oil (3M, USA) with 2% PFPE-PEG-PFPE surfactant (synthesized in accordance with44). To control
the flow of oil and reagents in the microfluidic devices, we used a rotAXYS positioning system and neMESYS
syringe pumps (both from Cetoni, Germany). Droplets were generated at ~800 Hz and were analysed at ~400 Hz.
Conventional 1.5-ml test tubes were used for off-chip incubation at 37 °C. Labelled dextran conjugates were
employed in our virtual array setup to label bacteria densities (Cascade BlueTM and Alexa Fluor 647TM, Thermo
Fisher Scientific, USA).
Fluorescence measurements and data analysis. We measured the fluorescence of droplets in our
droplet-reading chip that was mounted on the stage of an A1R confocal microscope (Nikon, Japan). The excita-
tion and detection settings were as follows: Cascade Blue, 405 nm and 450/50 nm; YFP, 488 nm and 525/50 nm;
Alexa 647, 641 nm and 700/50 nm. Note: because of the hardware setup in the confocal, we used GFP settings
to obtain fluorescence of YFP. Raw images were analysed with Nikon NIS-Elements AR 3.2 software and results
were exported as.txt files. Further analysis was carried out with MS Office Excel (Microsoft, USA) with the Real
Statistics Resource Pack (http://www.real-statistics.com/) or with custom LabVIEW (National Instruments, USA)
scripts. Droplet signals reflect the peak relative fluorescence intensities allocated to each droplet (Figs. S2, S3).
Virtual arrays. Each virtual array corresponds to a series of 16 two-fold dilutions of the E. coli inoculum. The
first dilution was prepared by refreshing the overnight bacterial culture with fresh medium at a 1:10 ratio. Sample
loading and droplet generation were described previously23. In brief, we aspirated 3 ul of each colour-coded bac-
terial dilution into microfluidic tubing, spaced with an equal volume of an oil plug. Next, we compartmentalized
the plugs into ∼2-nL droplets (the size distribution of droplets appears in Table S1) and pooled them as a ‘virtual
array’ in a standard 1.5-ml test tube for incubation at 37 °C. After incubation, we analysed the droplet signals of
the virtual array in three distinct fluorescence-detection channels.
Scientific Reports | (2020) 10:3282 | https://doi.org/10.1038/s41598-020-60381-z 6www.nature.com/scientificreports/ www.nature.com/scientificreports
We positioned the droplets in the virtual-array matrix based on their Cascade Blue and Alexa 647 signal inten-
sities. Then we identified each cluster using custom-made Labview script, determined the bounding box encap-
sulating the points within each cluster, and assigned a colour-code number to each gated droplet cluster. The
colour-coding histogram in Fig. 2A contains data from ~22,000 droplets (~1,400 per colour-coded bacteria dilu-
tion). In our virtual-array experiments we repetitively identified colour codes for >97% of the droplets (Fig. S3).
MIC and MIA calculations. We fit the data for each bacterial density with the Gompertz function35,36, which
is a two-parameter function:
p2
c
φ = exp− ,
p
1
where c is the concentration of antibiotic (argument of the Gompertz function), p1 is concentration at which the
highest drop of φ is observed, and p2 determines the slope of the Gompertz function at c = p1. The parameters and
their errors are determined by the least-square method. We define MIC as the concentration for which φ = 1/2,
that is, cMIC = p1(ln2)1/p2. We estimate the error of cMIC by the minimum error obtained by the error propagation
formula applied for cMIC = p1(ln2)1/p2 or by the difference between concentrations of the antibiotic closest to cMIC.
MIA is determined by MIA ≡ vcMIC /NCFU +, where v is the droplet volume. Error for MIA is determined by the
error propagation formula for the above equation. The probability distribution of individual MICs is related to the
∞
normalized fraction of positive droplets, ∫ p(m)dm = f+ (c )/f+ (0). Taking the derivative of this formula yields
d c
p(c ) = − dc f+ (c )/f+ (0). To calculate the derivative, we use the data points from Fig. 1C for concentrations ci
according to p((ci +1 + ci )/2) = + i +1 − + i /(ci − ci +1). Errors of the above probability distribution are
f (c ) f (c )
f+ (0) f+ (0)
determined with the error propagation formula from the errors of f+ (ci ), f+ (ci +1 ) and f+ (0 ).
Received: 15 September 2019; Accepted: 7 February 2020;
Published: xx xx xxxx
References
1. O’Neill, J. The Review on Antimicrobial Resistance. Wellcome Trust & UK Government (2016).
2. Hofer, U. In the News: The cost of antimicrobial resistance. Nat. Rev. Microbiol. 17, 3 (2018).
3. Cassini, A. et al. Attributable deaths and disability-adjusted life-years caused by infections with antibiotic-resistant bacteria in the
EU and the European Economic Area in 2015: a population-level modelling analysis. Lancet Infect. Dis. 19, 56–66 (2019).
4. World Health Organization. Global action plan on antimicrobial resistance. World Health Organization (2015).
5. Jacoby, G. A. & Munoz-Price, L. S. The New beta-lactamases. N. Engl. J. Med. 352, 380–391 (2005).
6. Kocaoglu, O. & Carlson, E. E. Profiling of beta-lactam selectivity for penicillin-binding proteins in Escherichia coli strain DC2.
Antimicrob. Agents Chemother. 59, 2785–2790 (2015).
7. Weinreich, D. M., Delaney, N. F., Depristo, M. A. & Hartl, D. L. Darwinian Evolution Can Follow Only Very Few Mutational Paths
to Fitter Proteins. Sci. 312, 111–113 (2006).
8. Davies, J. & Davies, D. Origins and evolution of antibiotic resistance. Microbiol. Mol. Biol. Rev. 74, 417–33 (2010).
9. Palmer, A. C. & Kishony, R. Understanding, predicting and manipulating the genotypic evolution of antibiotic resistance. Nat. Rev.
Genet. 14, 243–8 (2013).
10. Ackermann, M. A functional perspective on phenotypic heterogeneity in microorganisms. Nat. Rev. Microbiol. 13, 497–508 (2015).
11. Brauner, A., Fridman, O., Gefen, O. & Balaban, N. Q. Distinguishing between resistance, tolerance and persistence to antibiotic
treatment. Nat. Rev. Microbiol. 14, 320–330 (2016).
12. Sánchez-Romero, M. A. & Casadesús, J. Contribution of phenotypic heterogeneity to adaptive antibiotic resistance. Proc. Natl. Acad.
Sci. USA 111, 355–60 (2014).
13. El-Halfawy, O. M. & Valvano, M. A. Antimicrobial heteroresistance: an emerging field in need of clarity. Clin. Microbiol. Rev. 28,
191–207 (2015).
14. Nicoloff, H., Hjort, K., Levin, B. R. & Andersson, D. I. The high prevalence of antibiotic heteroresistance in pathogenic bacteria is
mainly caused by gene amplification. Nat. Microbiol, https://doi.org/10.1038/s41564-018-0342-0 (2019).
15. Band, V. I. et al. Antibiotic failure mediated by a resistant subpopulation in Enterobacter cloacae. Nat. Microbiol. 1, 16053 (2016).
16. Kaminski, T. S., Scheler, O. & Garstecki, P. Droplet microfluidics for microbiology: techniques, applications and challenges. Lab.
Chip 16, 2168–2187 (2016).
17. Price, K. A. & Paegel, B. M. Discovery in Droplets. Anal. Chem. 88, 339–353 (2016).
18. Tran, T. M., Lan, F., Thompson, C. S. & Abate, A. From tubes to drops: droplet-based microfluidics for ultrahigh-throughput biology.
J. Phys. D. Appl. Phys. 46, 114004 (2013).
19. Lyu, F. et al. Phenotyping antibiotic resistance with single-cell resolution for the detection of heteroresistance. Sens. Actuators, B
Chem. 270, 396–404 (2018).
20. Wiegand, I., Hilpert, K. & Hancock, R. E. W. Agar and broth dilution methods to determine the minimal inhibitory concentration
(MIC) of antimicrobial substances. Nat. Protoc. 3, 163–175 (2008).
21. Liu, X. et al. High-throughput screening of antibiotic-resistant bacteria in picodroplets. Lab. Chip 16, 1632–1643 (2016).
22. Smith, K. P. & Kirby, J. E. The Inoculum Effect in the Era of Multidrug Resistance: Minor Differences in Inoculum Have Dramatic
Effect on Minimal Inhibitory Concentration Determination. Antimicrob. Agents Chemother. 62, e00433–18 (2018).
23. Scheler, O. et al. Optimized droplet digital CFU assay (ddCFU) provides precise quantification of bacteria over dynamic range of 6
logs and beyond. Lab. Chip 17, 1980–87 (2017).
24. Najah, M., Griffiths, A. D. & Ryckelynck, M. Teaching single-cell digital analysis using droplet-based microfluidics. Anal. Chem. 84,
1202–9 (2012).
25. El Meouche, I. & Dunlop, M. J. Heterogeneity in efflux pump expression predisposes antibiotic resistant cells to mutation. Sci. 362,
686–690 (2018).
26. Martinez, J. L. & Baquero, F. Mutation Frequencies and Antibiotic Resistance. Antimicrob. Agents Chemother. 44, 1771–1777 (2000).
27. Eun, Y., Utada, A. S., Copeland, M. F., Takeuchi, S. & Weibel, D. B. Encapsulating Bacteria in Agarose Microparticles Using
Microfluidics for High-Throughput Cell Analysis and Isolation. ACS Chem. Biol. 6, 260–266 (2011).
28. Amir, A. & Balaban, N. Q. Learning from Noise: How Observing Stochasticity May Aid Microbiology. Trends Microbiol. 26, 376–385
(2018).
Scientific Reports | (2020) 10:3282 | https://doi.org/10.1038/s41598-020-60381-z 7www.nature.com/scientificreports/ www.nature.com/scientificreports
29. Elowitz, M. B., Siggia, E. D., Levine, A. J. & Swain, P. S. Stochastic Gene Expression in a Single Cell. Sci. 297, 1183–1187 (2002).
30. Wang, X. et al. Heteroresistance at the Single-Cell Level: Adapting to Antibiotic Stress through a Population-Based Strategy and
Growth-Controlled Interphenotypic Coordination. M. Bio. 5, e00942–13 (2014).
31. Bergmiller, T. et al. Biased partitioning of the multidrug efflux pump AcrAB-TolC underlies long-lived phenotypic heterogeneity.
Sci. 315, 311–315 (2017).
32. Artemova, T., Gerardin, Y., Dudley, C., Vega, N. M. & Gore, J. Isolated cell behavior drives the evolution of antibiotic resistance. Mol.
Syst. Biol. 11, 1–11 (2015).
33. Abate, A. R. et al. DNA sequence analysis with droplet-based microfluidics. Lab. Chip 13, 4864 (2013).
34. Debski, P. R., Gewartowski, K., Sulima, M., Kaminski, T. S. & Garstecki, P. Rational design of digital assays. Anal. Chem. 87,
8203–8209 (2015).
35. Chorianopoulos, N. G. et al. A newly developed assay to study the minimum inhibitory concentration of Satureja spinosa essential
oil. J. Appl. Microbiol. 100, 778–786 (2006).
36. Lambert, R. J. W. & Pearson, J. Susceptibility testing: accurate and reproducible minimum inhibitory concentration (MIC) and non-
inhibitory concentration (NIC) values. J. Appl. Microbiol. 784–790 (2000).
37. Postek, W., Gargulinski, P., Scheler, O., Kaminski, T. S. & Garstecki, P. Microfluidic screening of antibiotic susceptibility at a single-
cell level shows inoculum effect of cefotaxime in E. coli. Lab. Chip 18, 3668–3677 (2018).
38. Hoffman, L. R. et al. Aminoglycoside antibiotics induce bacterial biofilm formation. Nat. 436, 1171–1175 (2005).
39. Kaplan, J. B. et al. Low levels of beta-lactam antibiotics induce extracellular DNA release and biofilm formation in Staphylococcus
aureus. M. Bio. 3, e00198–12 (2012).
40. Konrat, K. et al. The bead assay for biofilms: A quick, easy and robust method for testing disinfectants. PLoS One 11, 1–13 (2016).
41. Pan, M. et al. Fluorinated Pickering Emulsions Impede Interfacial Transport and Form Rigid Interface for the Growth of Anchorage-
Dependent Cells. ACS Appl. Mater. Interfaces 6, 21446–53 (2014).
42. Stewart, P. S. & William Costerton, J. Antibiotic resistance of bacteria in biofilms. Lancet 358, 135–138 (2001).
43. Scheler, O., Kaminski, T. S., Ruszczak, A. & Garstecki, P. Dodecylresorufin (C12R) Outperforms Resorufin in Microdroplet Bacterial
Assays. ACS Appl. Mater. Interfaces 8, 11318–11325 (2016).
44. Holtze, C. et al. Biocompatible surfactants for water-in-fluorocarbon emulsions. Lab. Chip 8, 1632–1639 (2008).
Acknowledgements
We are very grateful to Professor Jeff Gore from MIT for sharing the bacteria strain we used here. This research
received support from the Foundation for Polish Science within the Team-Tech/2016-2/10 program. P.G.
acknowledges support from the Polish National Science Centre based on decision number DEC-2014/12/W/
NZ6/00454 (Symfonia). O.S. was supported by Estonian Research Council grant PUTJD589. O.S. and O-P.S.
were supported by TTÜ development program 2016–2022, project code 2014–2020.4.01.16-0032. W.P. received
funding through a doctoral scholarship from the Polish National Science Centre, scholarship code UMO-
2018/28/T/ST4/00318. This project was partially performed in laboratories funded by NanoFun POIG.02.02.00-
00-025/09. K.M. has received funding from the National Science Center, Poland (2016/21/D/ST3/00988).
Author contributions
O.S. conceived the study, designed the research, analysed data, interpreted the results, and was responsible for
performing the experiments. K.M. was responsible for data analysis and interpreted the results. P.R.D. assisted
in data analysis. M.H. assisted in data analysis and was responsible for writing LabView scripts. A.R. assisted
in microbiology-related work. N.P. assisted in droplet microfluidic experiments. K.S. assisted with confocal
microscopy. O-P.S. assisted data analysis. W.P. participated in research design. P.G. conceived the study, assisted
in designing the research, and interpreted the results. O.S., K.M., and P.G. wrote the paper, with input from all
co-authors.
Competing interests
The authors declare no competing interests.
Additional information
Supplementary information is available for this paper at https://doi.org/10.1038/s41598-020-60381-z.
Correspondence and requests for materials should be addressed to O.S. or P.G.
Reprints and permissions information is available at www.nature.com/reprints.
Publisher’s note Springer Nature remains neutral with regard to jurisdictional claims in published maps and
institutional affiliations.
Open Access This article is licensed under a Creative Commons Attribution 4.0 International
License, which permits use, sharing, adaptation, distribution and reproduction in any medium or
format, as long as you give appropriate credit to the original author(s) and the source, provide a link to the Cre-
ative Commons license, and indicate if changes were made. The images or other third party material in this
article are included in the article’s Creative Commons license, unless indicated otherwise in a credit line to the
material. If material is not included in the article’s Creative Commons license and your intended use is not per-
mitted by statutory regulation or exceeds the permitted use, you will need to obtain permission directly from the
copyright holder. To view a copy of this license, visit http://creativecommons.org/licenses/by/4.0/.
© The Author(s) 2020
Scientific Reports | (2020) 10:3282 | https://doi.org/10.1038/s41598-020-60381-z 8You can also read