Numerical Investigation of Road Salt Impact on an Urban Wellfield
←
→
Page content transcription
If your browser does not render page correctly, please read the page content below
Numerical Investigation of Road Salt Impact on an
Urban Wellfield
by M.L. Bester1,2, E.O. Frind1, J.W. Molson1,3,4, and D.L. Rudolph1

   Abstract
        The impact of road salt on a wellfield in a complex glacial moraine aquifer system is studied by numerical sim-
   ulation. The moraine underlies an extensive urban and industrial landscape, which draws its water supply from >20
   wellfields, several of which are approaching or have exceeded the drinking water limit for chloride. The study inves-
   tigates the mechanisms of road salt infiltration, storage, and transport in the subsurface and assesses the effectiveness
   of mitigation measures designed to reduce the impact. The three-dimensional transport model accounts for increases
   in salt loading, as well as growth of the urbanized area and road network over the past 50 years. The simulations,
   which focus on one impacted wellfield, show chloride plumes originating mainly at arterial roads and migrating
   through aquitard windows into the water supply aquifers. The results suggest that the aquifer system contains a large
   and heterogeneously distributed mass of chloride and that concentrations in the aquifer can be substantially higher
   than the concentrations in the well water. Future impact scenarios indicate that although the system responds rapidly
   to reductions in salt loading, the residual chloride mass may take decades to flush out, even if road salting were dis-
   continued. The implications with respect to urban wellfields in typical snow-belt areas are discussed.

Introduction                                                      million tons of road salt were released to the environment
     As urban populations throughout the world continue           each year, equivalent to 3 million tons of chloride (Envi-
to grow, increasing demands are being placed on trans-            ronment Canada 2001). In the United States, between 10
portation networks. One consequence is that in northern           and 20 million tons/year of road salt are applied nationwide
regions such as eastern Canada, Finland, and the north-           (Envirocast Newsletter 2003). Application practices differ
eastern United States, it has become standard practice            greatly from community to community. Where fear from
over the past 50 years to keep roads and highways free of         legal liability is a motivation, application rates may exceed
snow and ice by applying deicing chemicals. The chemi-            what would be necessary for road safety. Unfortunately, the
cal of choice is, in most cases, road salt, or sodium chlo-       environmental consequences of road salting are not yet
ride (NaCl). Consequently, millions of tons of road salt          well understood by the public and the decision makers.
are being applied annually, often without proper docu-                 The environmental impact of road deicing salt has
mentation of application rates, distribution, or frequency.       become a growing concern over the past decade. Road salt
In Canada during the late 1990s, estimates show that ~4.9         has been linked, for example, to contamination of surface
                                                                  water and ground water, damage to trees and structures,
                                                                  and degradation of local ecosystems (Howard et al. 1993;
       1Department of Earth Sciences, University of Waterloo,
                                                                  Jones et al. 1986). In particular, ground water contamina-
Waterloo, Ontario, Canada N2L 3G1.
       2Currently at the University of Stuttgart, Germany.        tion by road salt can have a serious impact in areas that are
       3Department of Civil, Geological and Mining Engineering,   dependent on ground water for their drinking water supply
École Polytechnique, P.O. Box 6079, Station Centre-ville, Mon-   (Stantec 2001). Thus, cost-effective and defensible man-
tréal, Quebec, Canada H3C 3A7.                                   agement tools are needed to evaluate the impact and risk to
       4Corresponding author: (514) 340-4711 x5189; fax (514)
                                                                  ground water from winter road salting. To develop the nec-
340-4477; john.molson@polymtl.ca
       Received November 2004, accepted May 2005.                 essary scientific basis, a thorough understanding of the
       Copyright ª 2005 National Ground Water Association.        mechanisms that link the application of road salt to the
       doi: 10.1111/j.1745-6584.2005.00126.x                      contamination of ground water must be developed.
                                                     Vol. 44, No. 2—GROUND WATER—March–April 2006 (pages 165–175)          165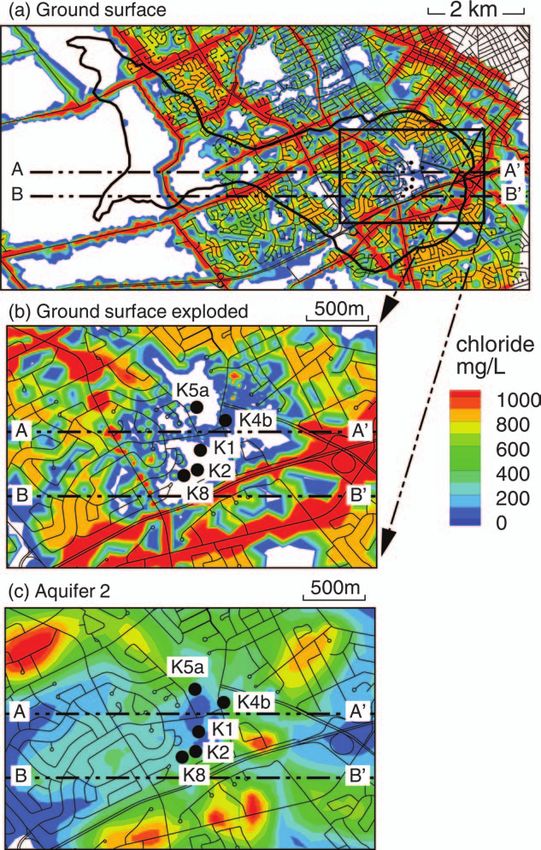
Across North America, there are numerous docu-           Protection Act (1999), the cornerstone of federal legisla-
mented cases of ground water contamination from road          tion for protecting the health of Canadians and their envi-
salt including those by Huling and Hollocher (1972),          ronment.
Pilon and Howard (1987), Locat and Gélinas (1989),                While considerable work has been done to address
Pollock (1992), Howard et al. (1993), Howard and              road salt concerns, the focus up to now has been on field
Haynes (1993), Gutiw and Jin (1998), and Novotny et al.       monitoring, small-scale modeling test cases, and statisti-
(1999). One of the earliest studies in Canada was by          cal assessment of prevention measures. In the light of
Paine (1979), who performed a chloride mass balance on        recent concerns about legacy sources of road salt derived
the Don River watershed in Toronto, Ontario, and found        from >50 years of application, there is a need for a com-
that as little as 50% of the NaCl being applied to the        prehensive and quantitative assessment of surface load-
watershed was being removed by surface water flow, with       ings and subsequent comparative impacts on municipal
the rest infiltrating to ground water. The fraction of road   water supplies. In addition, the significance of complex
salt that infiltrates to shallow ground water has also been   hydrostratigraphy that is common in the snow-belt re-
estimated by McConnell and Lewis (1972) as 25% to             gions, such as Canada, the northeastern United States,
50%, and by Environment Canada (2001) as 10% to 60%.          and Nordic countries such as Finland, should be investi-
Also within the Greater Toronto Area, Pilon and Howard        gated in connection with salt impact on ground water.
(1987) reported chloride concentrations as high as 14,000          Our objective here is to investigate the mechanisms
mg/L in shallow subsurface water adjacent to a salted         of road salt infiltration, storage, and transport in a com-
urban Toronto highway, with evidence of road salt con-        plex glacial moraine aquifer-aquitard system, to evaluate
tamination at distances of up to 100 m from major urban       the impact on a typical wellfield, and to assess the effec-
roads. In the cities of Kitchener-Waterloo in southern        tiveness of mitigation measures designed to reduce the
Ontario, Sarwar et al. (2002) found average chloride con-     impact. The Greenbrook wellfield, which supplies ~10%
centrations of 2700 mg/L in shallow ground water below        (~13,000 m3/d) of the drinking water for the Regional
primary and secondary roadways. In their Road Salt            Municipality of Waterloo (RMOW), is used as a demon-
Assessment Report, Environment Canada (2001) found            stration case.
chloride concentrations up to 18,000 mg/L in road runoff,
4000 mg/L in wetlands and watercourses, and 2800 mg/L
in shallow ground water adjacent to salt storage yards.       Background
     Road salt contamination is also a concern in several         The RMOW, with a population of >400,000, is
European countries. In Finland, for example, where road       located in southwestern Ontario and includes the cities of
salt contamination is a particular risk, 43% of the 2200      Kitchener, Waterloo, and Cambridge, as well as several
ground water areas mapped as important for water supply       municipal townships (Figure 1). Local ground water
are traversed by roads that receive heavy applications of
deicing chemicals (Nystén 1998). In a detailed hydro-
geological investigation to assess impacts of road salt
applications on a large aquifer system in Finland, Coster
et al. (1994) used field data collected over a period of 2
years, as well as historical data, to calibrate a flow and
transport model and to correlate changes in chloride
migration with changes in pumping rates and recharge.
Most recently, Finnish research has focused on assessing
risk and evaluating alternative deicers (Gustafsson and
Nystén 2000; Nystén and Gustafsson 2000; Hellstén and
Nystén 2003). Hellstén et al. (2004), for example, show
that the use of potassium formate (at 5400 kg/km) instead
of sodium chloride reduced sodium and chloride concen-
trations in nearby ground water by >40% within 2 years.
In the shallow subsurface, potassium formate was shown
to rapidly degrade to carbon dioxide and water (plus
potassium), none of which are environmentally harmful
(the significance of the resulting CO2 as a greenhouse gas
remains to be investigated).
     The Government of Canada now recognizes road salt
as a toxic environmental contaminant (Canada Gazette
2001) and has recently released a Code of Practice recom-
mending road authorities implement road salt manage-
ment plans (Canada Gazette 2004). The code contains
directives for monitoring road salt usage and storage, and
for identifying environmentally sensitive receptors in-       Figure 1. Location of the Greenbrook wellfield within the
                                                              RMOW. The local outline around the Greenbrook wellfield is
cluding ground water and surface water. The Code of Prac-     the 280-year ground surface capture zone (Frind et al. 2002).
tice was developed under the Canadian Environmental
166    M.L. Bester et al. GROUND WATER 44, no. 2: 165–175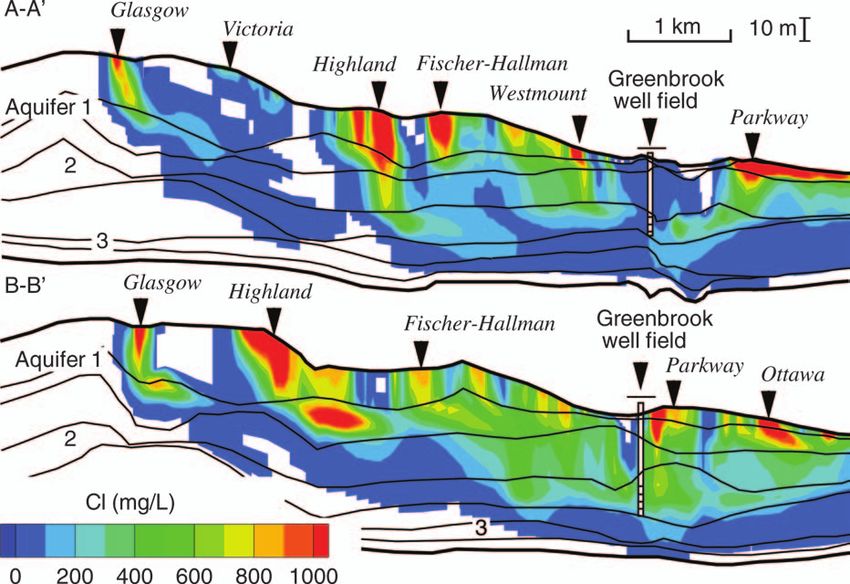
resources provide ~80% of the drinking water from 10                              Earlier studies by Farvolden and Weitzman (1980),
major wellfields, the first of which (Greenbrook) was                        Woeller and Farvolden (1989), and Fritz et al. (1991) have
installed more than a century ago. All were originally sit-                  suggested that the high chloride concentrations found in
uated outside the city limits, but as the urban area rapidly                 the Greenbrook wells most likely originates from a nearby
expanded over the past 50 years, most of the wellfields                      salt dump and/or local road salting, although a nearby
are now surrounded by residential suburbs, light industry,                   landfill and mineralized water from a deeper aquifer have
and dense road networks. Lying within a snow belt, the                       also been identified as potential sources. The suspicion of
municipality began applying salt to highways and city                        road salt as the likely source is reinforced by the tremen-
streets in the late 1940s in order to provide safe driving                   dous growth in the urbanized area surrounding Greenbrook
conditions during the winter months.                                         over the past 50 years, with the addition of local and arte-
     The local topography of the Waterloo region is domi-                    rial roads, as well as an expressway to the south of the
nated by the Waterloo Moraine, which was formed                              wellfield in 1970 (Figure 3), all adding to the salt loading.
through a dynamic period of glacial activity that left                       Recent transport modeling by Muhammad (2000) con-
behind a complex interlaying of till sheets and coarse gla-                  firmed that road salt is the most likely source.
ciofluvial material (Karrow 1993). The sediments range                            Because of the importance of the ground water
in texture from fine clay to coarse cobbled gravels and                      resource to the community, the RMOW initiated a com-
form a complex stratigraphy with a heterogeneous distri-                     prehensive source water protection strategy in 1994, and
bution of hydraulic conductivity ranging from 1024 to                        wellhead protection areas have now been delineated for
10210 m/s (Béland 1977). As a result of the irregular gla-                  all wellfields (RMOW 2000) based on the methodology
cial deposition processes and subsequent reworking of the                    described by Frind et al. (2002). The three-dimensional
surficial sediments through fluvial action, many of the                      (3D) capture zones were characterized by their maximum
individual stratigraphic units are highly nonuniform in                      lateral extent (with respect to depth) and by their intersec-
thickness and locally discontinuous in lateral extent                        tion with the ground surface. The surface capture zone for
(Karrow 1993). Hydrogeologically, a number of aquifers                       the Greenbrook wellfield is shown in Figures 3b and 4,
separated by aquitards can be identified, with each of                       and again for scale in Figures 6 and 9a.
these units being of variable thickness and composed of                           With road salt identified as a major threat to the
a mix of materials. Some of these aquifers may be                            water supply, the RMOW is now facing the challenge of
hydraulically connected through what are often referred                      balancing the quality of the water supply with winter
to as hydrogeologic windows in the aquitards, which rep-                     road safety. In response, the RMOW initiated a Road Salt
resent potential conduits for contaminants entering the                      Management and Chloride Reduction Study to determine
aquifer system at ground surface (Martin and Frind 1998;                     the preferred option for stabilizing or reducing the con-
Muhammad 2000; Frind et al. 2002).                                           centrations of chloride in drinking water at all of the
     The Greenbrook wellfield (Figure 1), on the eastern                     municipal wellfields (Stantec 2001, 2003). As part of this
flanks of the Waterloo Moraine, was the primary source
of water for the City of Kitchener prior to the addition of
other wellfields in the 1950s. The wellfield now consists
of five wells (K1, K2, K4b, K5a, and K8; Figures 2 and 9)
that are all screened within an intermediate aquifer and
currently provide ~10% of the drinking water for the
municipality. Over the past few decades, water pumped
from the Greenbrook wells has been showing steadily
increasing chloride concentrations, with wells K1, K4b,
and K5a already exceeding the drinking water limit of
250 mg/L(Cl) (Figure 2). Sodium, which is a health con-
cern above 20 mg/L, has shown similar increasing trends,
with wells K1, K4b, and K5a all above 120 mg/L(Na).

                   300
                                                                K5a
                           drinking water limit
 Chloride (mg/L)

                            K1
                   200      K3
                            K4b
                                                                K2
                   100

                    0
                    1970                 1980            1990         2000
                                                  Year

Figure 2. Observed chloride concentrations in the Green-                     Figure 3. Road network in the area of the Greenbrook well-
brook production wells. See Figure 9 for well locations.                     field showing growth from (a) 1950 to (b) 2000.

                                                                             M.L. Bester et al. GROUND WATER 44, no. 2: 165–175       167
case because the effect of seasonal variations in ground
water recharge and mass loadings dampens out below the
water table, as shown by Bester (2002).
The regional flow model encompasses an area of
>700 km2 and is bounded by the Nith River to the west
and by the Grand River to the east (Figure 1). The 3D
system is resolved using 30 continuous layers of deform-
able triangular prisms (Figure 6), which follow the stra-
tigraphy. The top layer at ground surface is designated as
a thin (numerical solution approach. To save memory and com- Muhammad (2000), who assumed an average annual
putation time, the transport model was run on a 115-km2 application rate of 30 tons NaCl per 2–lane km road
subgrid with a length about twice that of the steady-state length for all road types and estimated that 20% of this
capture zone for Greenbrook (Figure 6). The final 3D reaches the water table. This salt is ~60% by mass chlo-
transport mesh includes a total of 560,310 nodes and ride; therefore, the average application rate is 3.6 tons of
1,068,969 elements in 30 mesh layers. chloride per 2–lane km per year. The average salt concen-
The transport simulations were run with dispersiv- tration at the ground surface can then be estimated based
ities of 20, 5, and 0.02 m in the longitudinal, transverse on recharge and road source area. For example, assuming
horizontal, and transverse vertical directions, respectively, an average recharge of 250 mm/year and an effective road
a diffusion coefficient of 10210 m2/s, and a time step of width (including shoulders) of 10 m, the chloride concen-
10 d. The dispersivities are consistent with the spatial tration at ground surface would be ~1400 mg/L.
transport scale of ~10 to 15 km (Gelhar et al. 1992; These estimates were then adjusted via calibration to
Engesgaard et al. 1996) and satisfy the constraints for the the observed chloride concentration in the Greenbrook
control of numerical dispersion and stability. The initial well water in 2002. Using the previous loading estimate
(background) chloride concentration within the study area as the initial condition, the spatial distribution of the
was set at 10 mg/L, based on observed data from monitor- salt loading was systematically adjusted until a reason-
ing wells in the Greenbrook area (Johnston 1994; Stantec able match with the observed chloride concentrations at
2001) and from other sites in southern Ontario (Jones the wells was achieved. As a calibration target, the flux-
et al. 1986; Howard and Beck 1992), which showed natu- averaged concentrations were calculated at each time
ral ground water chloride concentrations varying from ~5 period from the sum of the products of well concentration
to 20 mg/L. The simulation approach assumes a uniform and pumping rate, normalized by the total pumping rate.
temperature and fluid density since natural thermal gra- Although this approach raises the question of nonunique-
dients are low, and maximum chloride source concen- ness, it makes sense from the practical point of view
trations are on the order of 2000 mg/L (200
Observed Data
Figure 9c shows the plumes in plan view within the
pumped aquifer. At this level, the chloride plumes no lon-
Weighted [CI] (mg/L) Calibrated Model
150 ger reflect ground surface source concentrations, as they
have moved laterally under the influence of the flow sys-
100 tem, which is controlled by aquitard windows and other
primary pathways. Plume tips are seen approaching the
50
wells from all directions, with concentrations in the range
of 300 to 500 mg/L in the immediate vicinity of the wells,
0
but also with higher concentrations up to 1000 mg/L far-
1975 1980 1985 1990 1995 2000 ther from the wells. There is a small area of near-back-
Year ground concentration in the middle of the wellfield,
Figure 8. Model calibration showing observed and simu- which is connected to the salt-free zone at ground surface
lated breakthrough curves of flux-weighted average concen- around the wellfield.
trations at the Greenbrook wells. In cross sections A-A9 and B-B9 (Figure 10), the salt
plumes originating at arterial roads are seen to migrate
mainly vertically downward through the unsaturated zone
concentrations for 2000 (Figure 7). (The contours them- and through aquitard 1 (the surficial layer), and then more
selves are somewhat irregular due to the spatial dis- or less horizontally within aquifer 1. Thereafter, the
cretization of the numerical model.) The white areas in plumes cross aquitard 2 mainly through windows or areas
the figures represent areas where the chloride concentra- with higher conductivity to reach aquifer 2, the pumped
tion does not exceed the background value of 10 mg/L. aquifer, where they follow the hydraulic gradient toward
As the wellfield itself is situated in an urban park, the the wells. Since the two sections do not necessarily follow
shallow ground water is relatively free of chloride within the flow direction, some plumes enter the section trans-
this area (Figures 9b and 10). versely (see, for example, cross section B-B9). The area
of near-background concentrations in the middle of the
wellfield is also evident in cross section A-A9. Chloride
concentration gradients generally decrease with depth as
the plumes become dispersed and as plumes from differ-
ent roads merge. These trends are consistent with those
simulated under similar conditions in Finland (Niemi
1998). It is evident that the present concentrations
observed in the wells represent only the leading edge of
the plumes; the highest concentrations have yet to appear
at the wells.
Although all wells at Greenbrook are situated within
a 1-km2 area, the contamination in each well differs sig-
nificantly. In cross section A-A9 (Figure 10), for example,
one group of chloride plumes can be seen approaching the
wellfield from the west, while another plume approaches
from the east. Other plumes, such as those located in
the shallow zone near the Conestoga Parkway in section
B-B9, reveal small local-scale flow systems with easterly
flow directions induced by another wellfield further
downgradient. The controlling influence of the windows
in the confining layers is reflected by the patterns of
plume migration as they reach the lower aquifers. For
instance, chloride reaching wells K2 and K8 from the
south (Figure 9c) has arrived at these wells not because it
is located in a highly salted area but because of the prox-
imity of a high-conductivity window in the overlying
aquitard. Evidence of additional conductive windows in
aquitard 2 can be seen in Figure 10, section B-B9, where
the salt plumes from Fischer-Hallman and Highland roads
are migrating vertically downward through this aquitard
before being diverted horizontally toward the wells
screened in aquifer 2. The locations for these windows
were inferred from the 3D kriging of the observed
Figure 9. Simulated chloride concentrations at (a, b) ground hydraulic conductivity data.
surface and (c) in pumped aquifer 2, year 2002, base case cali- The cumulative chloride mass input to the aquifer
bration. The 280-year ground surface capture zone is super-
imposed in (a) for reference. Contour flood cut-off is 10 mg/L. system in the Greenbrook submesh area (Figure 6) up to
the end of the calibration period (2002) is ~1.5 3 108 kg,
170 M.L. Bester et al. GROUND WATER 44, no. 2: 165–175Figure 10. Simulated chloride concentrations along cross sections A-A9 and B-B9, year 2002, base case calibration. Section
locations are shown in Figure 9 (note wells do not fall directly on sections); road names identified in italics. Vertical exaggera-
tion is 203; contour flood cut-off is 10 mg/L.
or, on average, 1.3 kg/m2 (~30 g/m2/year) over the within the Greenbrook capture zone was neglected. This
115-km2 submesh area. Local values in the more heavi- assumption is reasonable because the road network is
ly salted areas will be much higher. Most of this already at a mature stage over most of the capture zone
chloride mass input is still stored in the aquifers and (except for the western part), with limited potential for
aquitards of the system at the end of 2002, as significant future growth. Breakthrough curves of the weighted aver-
mass discharge has not yet occurred by this time. This age chloride concentrations for scenarios 1 to 6 are pre-
high salt loading should be a cause for environmental sented in Figure 11.
concern.
As is evident from Figures 9 and 10, chloride con- Scenario 1: Base Case
centrations in both shallow and deep aquifers are highly The base case projection represents the ‘‘do-nothing’’
heterogeneous, ranging from background (10 mg/L) to approach where salt input is assumed to continue at 2002
~1000 mg/L. While source heterogeneity is a factor, the levels. The concentrations within cross section A-A9 for
main reason for the strong heterogeneity of concentration 2041 (Figure 12a) again show chloride plumes reaching
at depth is the heterogeneity of the glacial hydrogeology, the well screens in aquifer 2 through windows in the low-
with aquitard windows that control flow and transport. conductivity layers. High chloride concentrations are also
This inherent heterogeneity has important implications encroaching from the underlying aquifer 3 toward the
for designing monitoring systems or placing new water wellfield, possibly entering this aquifer from a direction
supply wells in aquifers subjected to similar road salt perpendicular to the cross section. The breakthrough curve
contamination.
A further important point is that concentrations in
the aquifer system can be substantially higher than con- 250
centrations observed in the well water, which is diluted calibrated predicted 1
by cleaner water being drawn in along with the contami-
Weighted Conc. (mg/L)
200
nated water. Thus, the quality of the well water, while of
2a
primary interest from the user’s point of view, is not nec- 2b
150 3
essarily a good indicator of water quality in the aquifer.
5
This inherent characteristic should be kept in mind when
100 4
assessing aquifer vulnerability.
50
6
Assessment of Salt Reduction Scenarios
0
The calibrated model was used to predict the impact 1960 1980 2000 2020 2040
of six different salt reduction scenarios over the next 40 Year
years (2003 to 2041). This forecasting was carried out
Figure 11. Breakthrough curves of flux-weighted chloride
using the existing road network and road salt loadings concentrations for simulation scenarios 1 to 6.
from 2002. Any post-2002 growth of the road network
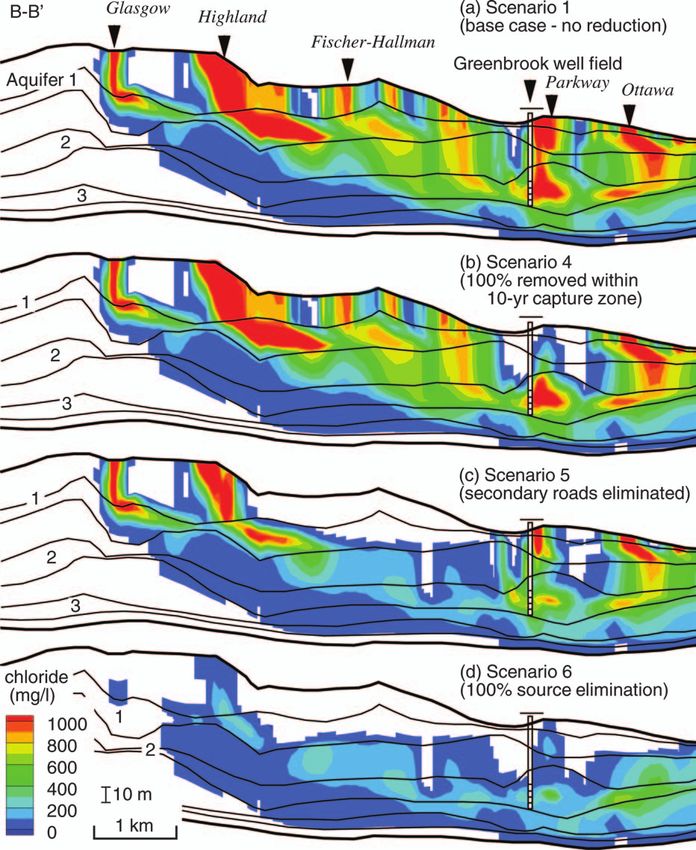
M.L. Bester et al. GROUND WATER 44, no. 2: 165–175 171Figure 12. Predictive scenarios 1, 4, 5, and 6 showing simulated chloride concentrations along cross section B-B9, year 2041.
Source changes occur in 2002; road names identified in italics. Vertical exaggeration is 203; contour flood cut-off is 10 mg/L.
for scenario 1 (Figure 11) shows a steadily increasing Both scenarios show a somewhat similar integrated
concentration of chloride, with the flux-weighted concen- response pattern at the wells, comprising a relatively small
tration approaching the drinking water limit by 2041. The drop, followed by a more gradual rise to concentrations ~20%
simulation suggests that, even assuming no change in cur- to 25% less than in the base case by 2041 (Figure 11). In the
rent road salt application rates, the system will still not gradual reduction case, a temporary minimum concentra-
reach steady state with respect to well impacts by 2041 tion is reached after ~7 years, whereas with an immediate
and concentrations will continue to rise. reduction, the minimum occurs after ~4 to 5 years. The
gradual increase after the minima are reached indicates that
with a 25% reduction of mass input, the system approaches
Scenario 2: 25% Reduction within Study Area but does not reach steady state by 2041.
In this scenario, the chloride mass loading is reduced
by 25% within the entire study area. The reduction begins Scenarios 3 and 4: 100% Reduction within
in 2002, which corresponds to the commencement of salt 5- and 10-Year Capture Zones
reduction measures by the municipality. These measures Scenarios 3 and 4 present the option of eliminating NaCl
include better recordkeeping (thus avoiding dual applica- within the 5- and 10-year ground surface zones, respectively
tions), conservation, and prewetting, which aids in keep- (capture zones are shown in Figure 4). This option could be
ing salt crystals from refracting off the pavement and achieved, for example, by replacing the salt with a deicing
onto pervious areas. Two subscenarios were considered, agent that is less harmful to the environment, such as potas-
the first representing a gradual linear decrease beginning sium formate (Hellstén and Nystén 2003).
in 2002 and ending in 2007, and the second an immediate The breakthrough curves for these scenarios show an
25% reduction in 2002. initially rapid decline followed by a more moderate rise.
172 M.L. Bester et al. GROUND WATER 44, no. 2: 165–175In scenario 3, for example, fresh water infiltrating within the Conclusions
first 5 years after reduction dilutes the chloride, and a mini- This study provides insight into the impact of road
mum concentration of ~120 mg/L is reached after ~8 years salt on a complex ground water system in an urban set-
(Figure 11). Well K4b responds the strongest due to a ting. The simulations show that a very large chloride
higher pumping rate than its neighboring production wells. mass can be stored in the subsurface before a well is
At 5 years, however, chloride from outside the 5-year cap- impacted, thus delaying the emergence of the inevitable
ture zone begins to arrive at the wells, and mixing with source contamination problems. When the impact finally
fresh water from recharge within the capture zone is not becomes apparent, it may foretell a serious long-term
sufficient to keep the chloride levels from rising again. quality issue since even with complete elimination of salt
The response in scenario 4 is similar (Figure 11), but input, flushing the residual chloride can take many years
shows a greater initial drop to ~100 mg/L because chlo- or decades. The simulation results suggest that some
ride has been removed from a larger area. A minimum wells in the Greenbrook wellfield may not yet have
concentration is reached after ~18 years (2020); however, reached their maximum chloride concentrations even
concentrations begin to rise again as the plumes from out- after 57 years (1945 to 2002) of road salt application.
side the 10-year capture zone reach the wellfield. At Under conditions of continuous salt input, attainment of
2041, the vertical profile (Figure 12b) shows a salt-free equilibrium concentrations in the system may require on
zone in aquifer 1, but not in aquifer 2, where higher con- the order of 100 years.
centrations have arrived from outside the capture zone. Although a water supply aquifer can be somewhat
The initial response of the wells to the salt reduction protected from road salt by overlying aquitards, the simu-
in scenarios 3 and 4 is fairly rapid because of the proxim- lations show that aquitard windows, common in glacial
ity of the contaminant source and relatively short travel moraine settings, can serve as short-circuit pathways for
times to the wells. This response should not be general- downward salt migration. On the other hand, when the
ized for other wellfields, where response times will likely source loading is reduced or removed, these same path-
differ depending on the degree of confinement and pro- ways can serve as conduits for cleaner recharge into the
tection. An indication of these factors is given by the deeper aquifers.
ground water age (Molson and Frind 2005), which gener- Aquifer heterogeneity, for example in the form of
ally increases in the moraine with depth and degree of windows that control flow and transport, can lead to
protection. Thus, for deeper and less vulnerable wells, the a very heterogeneous chloride distribution in the aquifer
impact of road salt contamination may be delayed (but system, even at depth. This inherent heterogeneity is an
not prevented), while for shallower wells, the response important fact to consider when designing monitoring
may be even more rapid. systems or locating new water supply wells in this or any
similarly stressed aquifer system.
Scenario 5: Elimination of Salt from Secondary Roads Concentrations in the aquifer can be substantially
When road salt is eliminated from secondary roads higher than concentrations observed in the well water,
and applied only to arterial roads throughout the area, which benefits by dilution with clean water. Thus, the
concentrations dramatically decrease in the wells and quality of the well water is not necessarily a good indica-
continue to decrease until 2041 (Figure 11). With the sec- tor of water quality in the aquifer. This characteristic
ondary road input removed, more fresh water enters the could be a factor in assessing aquifer vulnerability.
system, and the chloride reaching the wells from the other The most important result of the study is that the
road types is therefore more diluted. Although relatively impact of road salting on ground water can be severe and
less salt is applied per 2–lane kilometer of secondary therefore every effort should be made to reduce or elimi-
roads, these roads constitute a significant fraction of the nate salting where possible. The first step is to carefully
total road length; hence, their contribution is important. control and monitor any salting to avoid overapplication.
The impact is best seen in the vertical profile at 2041, The elimination of salting on secondary roads can also be
which shows an extensive chloride-free zone between a very effective mitigation measure. Another good option
Highland Road and Greenbrook (Figure 12c). In particu- would be to completely eliminate road salt from desig-
lar, the two windows within aquitard 2 just upgradient nated sensitive areas and to use an alternative deicer
from the wellfield are now relatively chloride-free and instead. A further option would be to reduce dependence
serve to bring in clean water from aquifer 1. Still, a signif- on salting by introducing lower speed limits during the
icant amount of salt remains in the deeper units and con- snow season. A combination of these options might offer
tinues to impact the wellfield. the best hope for averting the progressive and practically
irreversible contamination of our precious ground water
Scenario 6: 100% Reduction within Study Area resources by road salt chloride.
In this scenario, the entire chloride source loading
is eliminated in 2002. The results show that most high
levels of chloride are flushed out of the system by 2041, Acknowledgments
except for some that remains trapped in low-conductivity The authors wish to thank Eric Hodgins, Tammy
material, primarily within the aquitards (Figure 12d). Middleton, and Jim Robinson of the RMOW for their
Within ~15 years after source removal, chloride concen- cooperation and for supplying important data for the
trations at the wells have dropped by one-half, and by 2041, model. We also thank Craig Johnston of Stantec Consul-
chloride contamination is no longer a threat (Figure 11). ting Ltd., Kitchener, and Paul Martin of AquaResource
M.L. Bester et al. GROUND WATER 44, no. 2: 165–175 173Inc., Waterloo, for their helpful advice. The manuscript ed. T. Nystén and T. Suokko, 23–30. Helsinki, Finland:
was improved through helpful comments by reviewers Finnish Environment Institute.
Hellstén, P., and T. Nystén. 2003. Migration of alternative de-
K. Howard (University of Toronto), T. Nystén (Finnish
icers in the unsaturated zone of aquifers—In vitro study.
Environment Institute), and E. Mehnert and S. Panno Water Science and Technology 48, no. 9: 45–50.
(Illinois State Geological Survey), and through critical Hellstén, P., T. Nystén, J. Salminen, K. Granlund, T. Huotari,
reading by Michael Frind. Financial support was pro- and V.-M. Vallinkoski. 2004. Biodegradation of potassium
vided by an Industrial Scholarship to the first author from formate in soil and groundwater: Final report of studies
on alternative de-icing chemicals: MIDAS Project (in
the Natural Sciences and Engineering Research Council
Finnish). Helsinki, Finland: Finnish Environment Institute
of Canada, in partnership with the RMOW, and an (SYKE).
NSERC Research Grant held by the second author. Howard, K.W.F., and P.J. Beck. 1992. Hydrogeochemical im-
plications of groundwater contamination by road de-icing
chemicals. Journal of Contaminant Hydrology 12, no. 3:
245–268.
References Howard, K.W.F., J.I. Boyce, S.J. Livingston, and S.L. Salvatori.
Beckers, J., and E.O. Frind. 2001. Simulating groundwater flow 1993. Road salt impacts on ground water quality—The
and runoff for the Oro Moraine aquifer system: 2. Auto- worst is still to come! GSA Today 3, no. 301: 319–321.
mated calibration and mass balance calculations. Journal of Howard, K.W.F., and J. Haynes. 1993. Urban geology 3. Ground-
Hydrology 243 no. 1–2: 73–90. water contamination due to road de-icing chemicals—
Béland, A. 1977. Management of the Greenbrook well field. Salt balance implications. Geoscience Canada 20, no. 1:
M.Sc. thesis, Department of Earth Sciences, University of 1–8.
Waterloo. Huling, E., and T. Hollocher. 1972. Groundwater contamination
Bester, M.L. 2002. Numerical simulation of road salt impact at by road salt: Steady-state concentrations in East Central
the Greenbrook well field, Kitchener, Ontario. M.Sc. thesis, Massachusetts. Science 176, 288–290.
Department of Earth Sciences, University of Waterloo. Johnston, C. 1994. Geochemistry, isotopic composition and age
Canada Gazette. 2004. Part 1. Ottawa. April 3, 2004. 138, no. 14. of groundwater from the Waterloo Moraine: Implication for
Canada Gazette. 2001. Part 1. Ottawa. December 1, 2001. 135, groundwater protection and management. M.Sc. thesis,
no. 48. Department of Earth Sciences, University of Waterloo.
Canadian Environmental Protection Act. 1999. Environment Jones, P.H., B.A. Jeffrey, P.K. Watler, and H. Hutchon. 1986.
Canada (CEPA 1999). http://www.ec.gc.ca/CEPARegistry/ Environmental impact of road salting—State of the art.
the_act/. Access date: Aug 21, 2005. Downsview, Ontario, Canada: Ministry of Transportation
Coster, A.D., K. Grandlund, and J. Soveri. 1994. The effect of and Communications.
road salting on a glaciofluvial aquifer in Finland—A model Karrow, P.F. 1993. Quaternary geology, Stratford-Conestoga
approach. Proceedings of the Helsinki Conference on area, Ontario Geological Survey. Report 283. Toronto,
Future Groundwater Resources at Risk. Ed by J. Soveri and Ontario.
T. Suokko. International Association of Hydrological Sci- Locat, J., and P. Gélinas. 1989. Infiltration of de-icing road salts
ences Publication no. 222. in aquifers: The Trois-Rivières-Ouest Case, Quebec, Canada.
Engesgaard, P., K.H. Jensen, J.W. Molson, and E.O. Frind. 1996. Canadian Journal of Earth Science 26, no. 11: 2186–2193.
Large scale dispersion in a sandy aquifer: Simulation Martin, P.J., and E.O. Frind. 1998. Modeling a complex multi-
of subsurface transport of environmental tritium. Water aquifer system: The Waterloo Moraine. Ground Water 36,
Resources Research 32, no. 11: 3253–3266. no. 4: 679–690.
Envirocast Newsletter. 2003. Snow, Road Salt and the Ches- McConnell, H., and J. Lewis. 1972. Add salt to taste. Environ-
apeake Bay. Vol. 1, no. 3, January. Published by the National ment 14, no. 9: 38.
Environmental Education and Training Foundation (NEETF) Molson, J.W., J. Beckers, P.J. Martin, and E.O. Frind. 2002.
and the Center for Watershed Protection (CWP). WATFLOW/3D version 2.0. A three-dimensional ground-
Environment Canada. 2001. Priority Substances List Assess- water flow model with modules for automated calibration
ment Report: Road salts. Technical Report by Environment and parameter sensitivity analysis. Department of Earth
Canada and Health Canada. http://www.ec.gc.ca/nopp/ Sciences, University of Waterloo. Waterloo, Ontario.
roadsalt/reports/en/socio.cfm. Access date: Aug 21, 2005. Molson, J.W., and E.O. Frind. 2005. How old is the water? Sim-
Farvolden, R., and M. Weitzman. 1980. Technical Report: ulating groundwater age at the watershed scale. In Proceed-
Greenbrook well field study. Department of Earth Sciences, ings: 2004 IAH Conference on Groundwater Quality,
University of Waterloo. Waterloo, Ontario. International Association of Hydrogeologists, Waterloo,
Frind, E.O., D.S. Muhammad, and J.W. Molson. 2002. Delinea- Canada. IAHS Publ. 297 p. 482–488.
tion of three-dimensional capture zones in complex multi- Molson, J.W., and E.O. Frind. 2003. WTC Transport Model User
aquifer systems. Ground Water 40, no. 6: 586–589. Guide. Department of Earth Sciences, University of Water-
Fritz, S.J., R.J. Drimmie, and P. Fritz. 1991. Characterizing shal- loo. Waterloo, Ontario.
low aquifers using tritium and 14C: Periodic sampling Muhammad, D. S 2000. Methodologies for capture zone delin-
based on tritium half-life. Applied Geochemistry 6, no. 1: eation for the Waterloo Moraine well fields. M.Sc. thesis,
17–33. Department of Earth Sciences, University of Waterloo.
Gelhar, L.W., C. Welty, and K.R. Rechfeld. 1992. A critical Niemi, A. 1998. Modeling of chloride transport in aquifers due
review of data on field-scale dispersion in aquifers. Water to salt from highway de-icing—Representative example
Resources Research 28, no. 7: 1955–1974. condition in Finnish aquifers. In Proceedings: International
Gustafsson, J., and T. Nystén. 2000. Trends of chloride concen- Symposium on Deicing and Dustbinding—Risk to Aquifers,
tration in groundwater and results of risk assessment of Helsinki, Finland, October 14–16. Nystén, T. and Suokko,
road salting in Finland. In Ground Water 2000: Proceed- T. Eds. Nordic Hydrological Programme, NHP Report No.
ings of the International Conference on Ground Water 43, Helsinki, Finland, p 31–40.
Research, Copenhagen, Denmark, ed. P. Bjerg, P. Enges- Novotny, V., D.W. Smith, D.A. Kuemmel, J. Mastriano, and
gaard, and T. Krom, 249–251. Rotterdam, Netherlands: A. Bartošová. 1999. Urban and highways snowmelt: Mini-
A.A. Balkema. mizing the impact of receiving water. Technical Report Pro-
Gutiw, P., and Y.C. Jin. 1998. Roadside salinity changes gener- ject 94-IRM-2. Water Environment Research Foundation.
ated by pavement deicing practices on a Saskatchewan Nystén, T. 1998. Transport processes of road salt in quaternary
highway. In Deicing and Dustbinding—Risk to Aquifers, formations. Proceedings: International Symposium on De-
174 M.L. Bester et al. GROUND WATER 44, no. 2: 165–175icing and Dustbinding—Risk to Aquifers, Helsinki, Finland. source and background documentation. Kitchener, Ontario,
October 14–16, 31–40. Nystén, T. and Suokko, T. Eds. Canada: RMOW.
Nordic Hydrological Programme, NHP Report No. 43, Sarwar, G., D.L. Rudolph, J.D. Campbell, and C. Johnston.
Helsinki, Finland, p 31–40. 2002. Field characterization of road salt impacts on ground
Nystén, T., and J. Gustafsson. 2000. Migration of road salt in water resources in an urban setting: Kitchener, Ontario. In
ground water. Finncontact 8, no. 4: 7–8. Quarterly News- Proceedings, 55th Canadian Geotechnical and 3rd Joint
letter of the Finnish Highway Transportation Technology IAH-CNC CGS Groundwater Speciality Conferences. D. Stolle,
Transfer Center, Finnish National Road Administration. A.R. Piggott and J.J. Crowder, Eds. Canadian Geotechnical
Paine, L. 1979. Chlorides in the Don River watershed resulting Society, Niagara Falls, Ontario, Canada, p. 457–463.
from road de-icing salt. Technical Report Working Paper Stantec. 2003. Road salt management and chloride reduction
Publication no. SIC-3. University of Toronto, Institute study. Phase 2: Evaluation of chloride reduction options.
of Environmental Studies Snow and Ice Working Group. Technical Report. Kitchener, Ontario, Canada: Stantec
Toronto, Ontario. Consulting Ltd.
Pilon, P., and K. Howard. 1987. Contamination of subsurface Stantec. 2001. Road salt management and chloride reduction
waters by road de-icing chemicals. Water Pollution 22, study. Phase 1: Road salt management study. Technical
157–171. Report. Kitchener, Ontario, Canada: Stantec Consulting Ltd.
Pollock, S. 1992. Remediating highway de-icing salt contamina- Woeller, R.M., and R.N. Farvolden. 1989. The past, present and
tion of public and private water supplies in Massachusetts. future of ground water development in the tri-cities of
Resources, Conservation and Recycling 7, no. 1–3: 7–24. Kitchener, Waterloo and Cambridge, Ontario, Canada. In
RMOW. 2000. Regional Official Policies Plan, Amendment #12, Proceedings of the NWWA FOCUS Conference on the
Water Resources Protection Strategy. Future urban point Regional Ground Water Issues, Kitchener, Ontario.
M.L. Bester et al. GROUND WATER 44, no. 2: 165–175 175You can also read


