TAPER TANTRUM IN 2021-22: BEWARE OF THE TUCKANS - Euler Hermes
←
→
Page content transcription
If your browser does not render page correctly, please read the page content below

Photo on Shutterstock
ALLIANZ RESEARCH

TAPER TANTRUM IN 2021-22:
BEWARE OF THE TUCKANS
12 April 2021
04 Could the Fed start to normalize monetary policy earlier than expected
   and unsettle financial markets?
06 Emerging Market initial conditions are more favorable than in 2013,
   with exceptions
11 Which countries are most at risk?
12 What could this mean for markets?

Allianz Research
Could the Fed start to normalize its monetary policy earlier than expected? With
the USD1.9trn fiscal stimulus package and a new USD2.3trn infrastructure pro-
EXECUTIVE gram, we have raised our US GDP growth forecasts to +5.3% in 2021 and +3.8%
in 2022. As a consequence, tightening labor market conditions along with higher
commodity prices should also lift consumer price inflation to 2.5% in 2021 and 2%
SUMMARY in 2022. But we continue to believe that the US Fed will only consider tapering its
bond purchases starting in H2 2022 and increasing the Fed Funds Target rate
only from H2 2023 onward. And because monetary tightening in the US will cer-
tainly generate financial pressures worldwide, we think that the Fed will com-
municate on its future moves better than it did in 2013, when its announcements
surprised markets and caused the taper tantrum. Yet, there is a risk that the Fed
may be tempted to normalize its monetary policy earlier, and perhaps again sur-
prise markets due to miscommunication, so Emerging Markets (EMs) may be
faced with another potential taper tantrum. Our pattern recognition model con-
firms that this risk cannot be entirely ruled out.
Emerging Market initial conditions are more favorable than in 2013, with excep-
Alexis Garatti, Head of Economic Research tions. Current account deficits are lower today, credit growth is at more sustaina-
alexis.garatti@eulerhermes.com ble levels and we expect inflation to remain under control, by and large. EM cur-
rencies are likely to remain volatile but we do not forecast a broad-based repeat
of the substantial depreciations experienced in 2013-2014, also because real
effective exchange rates are currently less strained as currencies already took
large hits in 2020. Moreover, monetary policy is currently ultra-loose in many EMs
and it should remain accommodative overall in the near future even though a
moderate tightening is likely in those countries where inflation exceeds the cen-
tral banks’ target ranges. Increases in inflation expectations could put pressure
on central banks as the need of adapting the monetary policy clashes with the
Pablo Espinosa Uriel, Capital Markets need to support the Covid-19 recovery.
Research Analyst
pablo.espinosa-uriel@allianz.com However, external financing requirements and the steady rise in sovereign debt
reveal some weak spots. In six countries, the external debt payments falling due
in the next 12 months significantly exceed the level of official foreign exchange
reserves (Turkey, Argentina, Ukraine, South Africa, Romania, Chile). Moreover, the
steady rise in sovereign debt over the past decade poses a significant risk, in par-
ticular for those EMs where the share of non-residents’ holdings of public debt
has increased over the last seven years.
Overall we identify seven EMs particularly vulnerable to the eventual Fed taper-
ing, especially if it is not well communicated, the TUCKANS: Turkey, Ukraine,
Manfred Stamer, Senior Economist for
Emerging Europe and the Middle East
Chile, Kenya, Argentina, Nigeria, South Africa. A stabilization of the money flows
manfred.stamer@eulerhermes.com
after a complicated 2020 would be crucial, but a pattern of relatively steady in-
flows into EMs is not yet visible, at least not in a generalized way.
EMs, in particular some of the TUCKANS, are already experiencing generalized
rises in the interest rates of their local currency bonds. In the short term, this is a
sign of upcoming volatility. If sustained, it could pose severe threats to debt sus-
tainability, which was already an issue for some of the countries before. However,
this spike could be at least partially a consequence of high growth expectations,
which would make it less risky than one solely based on US tapering.
2
12 April 2021

                                                                   Photo on Unsplash
                                                 7
          Emerging Markets particularly vulnerable to
an eventual tapering of monetary policy by the US Fed.

                                                                                       3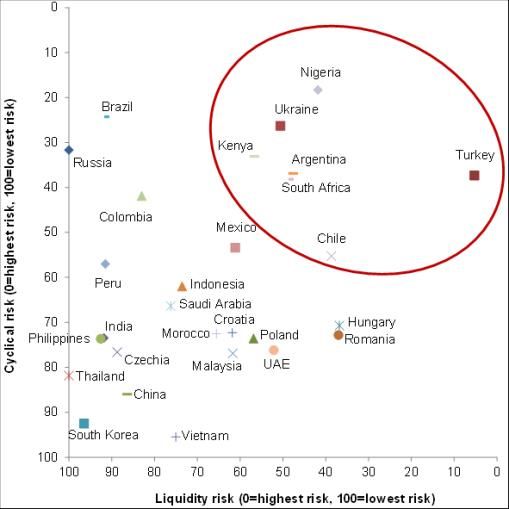
Allianz Research

     COULD THE FED START TO NORMALIZE
     MONETARY POLICY EARLIER THAN EXPECTED
     AND UNSETTLE FINANCIAL MARKETS?

 The interdependence of financial mar-                                 end of 2022 compared with 6.2% in                                 confirms that the US central bank could
 kets, and the predominant position of                                 February 2021. Fiscal incentives to in-                           be tempted to normalize monetary
 the US and the USD, make the rest of                                  crease the minimum wage (we inte-                                 policy much earlier. However, we conti-
 the world – especially Emerging Mar-                                  grate a scenario leading us to USD11                              nue to think that the Fed will only consi-
 kets (EMs) – sensitive to any financial                               per hour by end-2022 compared with                                der tapering starting in H2 2022 and
 event that takes place in the US, not to                              USD7.25 today) will add further infla-                            increasing the Fed Funds Target rate
 mention any changes in the Federal                                    tionary pressures alongside the rapid                             only from H2 2023 onward. The proxi-
 Reserve’s monetary policy. This was last                              diminution of the US job market’s de-                             mity between the Funds target rate
 seen in 2013, when just the announce-                                 gree of slack. As a result of these upco-                         and the natural rate of interest rate
 ment of future tapering by the Fed go-                                ming tightening job market conditions                             tells us that the current stance of the US
 vernor unchained a generalized spike                                  and the positive pass-through of recent                           monetary policy can be deemed as
 in US sovereign yields, the appreciation                              energy and commodity prices (the im-                              being only moderately accommodative
 of the USD and capital outflows from                                  pacts of which are already visible at the                         in the current circumstances. In this
 fragile EMs.                                                          level of input prices), we have revised                           case, the Fed will have the luxury to
 Taking into account President Joe                                     on the upside our US CPI inflation sce-                           wait and see before really envisaging a
 Biden’s USD1.9trn fiscal package and                                  nario, with 2.5% y/y expected in 2021,                            normalization in its monetary policy.
 the USD2.3trn infrastructure investment                               2% in 2022 and 2.1% y/y in 2023. The                              But despite this forecast, and due to the
 plan, we now expect US GDP to grow                                    two-year average CPI yearly increase                              message conveyed by the mechanical
 by +5.3% y/y in 2021 and +3.8% y/y in                                 will reach 2% y/y in early H2 2022 ins-                           approach of the Fed’s reaction func-
 2022, with risks tilted on the upside1. As                            tead of late H2 2022 in our previous                              tion, episodes of stress and volatility will
 a result, the level of slack of the US job                            scenario.                                                         be visible if the market considers at one
 market in particular will diminish more                               Our Fed reaction function, estimated in                           point that the Fed is behind the curve.
 rapidly than expected before (full em-                                function of the spread of inflation bet-                          In such circumstances, we need to anti-
 ployment end-2022). We expect the US                                  ween observed data and the target of                              cipate the consequences of another
 unemployment rate to hit 4.3% at the                                  2%, and in function of the NAIRU gap,                             potential taper tantrum.

     Figures 1 and 2: Job market conditions in the US
16                                 NAIRU                                                            10
                                                                                                                             Average Hourly Earnings (%, y/y)
                                   US unemployment rate
14                                                                                                                           15$ end of 2022
                                                                                                     8                       Average 15$ end 2022
12                                                                                                                           11$ end of 2022
                                                                                                                             Average 11$ end 2022
10                                                                                                   6

 8
                                                                                                     4
 6
                                                                                                     2
 4

 2                                                                                                   0
      10        11     12     13     14    15     16      17    18     19     20     21    22            10    11     12     13     14     15     16     17      18   19   20   21   22

     Sources: National statistics, IMF, Allianz Research forecasts
           1
               For more details on our outlook for the US economy, refer to our recent report Race to the post Covid-19 recovery: Seven obstacles to overcome.
4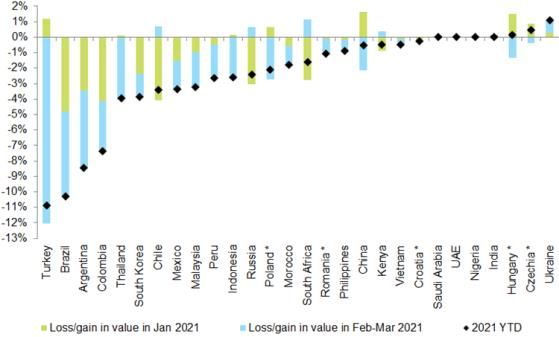
12 April 2021
 Figure 3: Fed’s theoretical reaction function                                                          Figure 4: Fed Funds target rate (%)
8                                                                                                         7

6
                                                                                                          6
4
                                                                                                          5
2
                                                                                                          4
0
                                                                                                          3
-2
                                                                                                          2
-4
                                                                                                          1
-6

-8                                                                                                        0
                                                                                                               95   98       01       04          07    10       13       16        19     22
      00     02    04    06     08    10      12     14   16     18    20       22     24
                         FFR           Expected new            Expected old                                              Effective Fed Funds Rate            US natural rate of interest

Sources: : National statistics, IMF, Allianz Research forecasts                                       Sources: National statistics, IMF, Allianz Research

 What do the markets tell us about the                                 larities between the current situation                          These results show that the current situ-
 proximity to a taper tantrum-like                                     and our pattern of interest (early 2013).                       ation is more similar to relatively calm
 situation?                                                                                                                            moments than to severe crisis-like situa-
                                                                       In our case, we use a very large sample
                                                                                                                                       tions. However, as experienced sailors
                                                                       of ETFs – cross asset classes and cross
 One year after Covid-19 shook up the                                                                                                  know, it is important to distinguish real
                                                                       geographies – and measure their rela-
 financial markets, the waters are calm-                                                                                               calm from apparent calm. Compared
                                                                       tive strength against the MSCI World,
 er but volatility and risks remain, trans-                                                                                            to 2013, the framework of today’s situa-
                                                                       our benchmark. By doing that, we do
 lating into some market movements,                                                                                                    tion is not very different (nor the clos-
                                                                       not limit ourselves to a particular mar-
 including in the US yield curve2 and                                                                                                  est) so some kind of taper tantrum is
                                                                       ket or asset but aim to capture the gen-
 commodities markets3, both of which                                                                                                   not something that can be excluded.
                                                                       eral trend. After comparing today’s
 EMs are very sensitive to. In order to
                                                                       strength with the weekly positioning
 analyze the global situation of financial
                                                                       since late 2008 by ETFs, we aggregate
 markets, and how close we are to the
                                                                       the square of the differences and the
 taper tantrum situation seen in 2013,
                                                                       results are shown in Figure 5.
 we use a pattern recognition frame-
 work to identify whether there are simi-

                                  Figure 5: Pattern recognition – relative strength of financial indicators against the MSCI World
                                       40 000                                                                                                          400
                                       35 000                                                                                                          350
                                       30 000                                                                                                          300
                                       25 000                                                                                                          250
                                       20 000                                                                                                          200
                                       15 000                                                                                                          150
                                       10 000                                                                                                          100
                                           5 000                                                                                                       50
                                              0                                                                                                        0
                                        -5 000                                                                                                         -50
                                                   2008         2010            2012         2014          2016          2018              2020
                                                                              Distance to current markets performance (LHS)
                                                                              US Curve Steepness (bps) (RHS)
                                  Sources: : Bloomberg, Refinitiv, BofA, Allianz Research.

 2
     To understand the tensions at the short-end of the curve, refer to U.S. Yield curve: Let’s twist again?
 3
     Find our latest analysis on commodities Higher demand, supply bottlenecks, but no speculation (yet).                                                                                          5
Allianz Research
EMERGING MARKET INITIAL CONDITIONS ARE
MORE FAVORABLE THAN IN 2013,
WITH EXCEPTIONS
Higher yields in the US and Europe section, we compare the current situa- eight years ago, including the large
create competition for capital and can tion to that of 2013 for 16 selected economies of India, Brazil, Mexico,
make financing EM imbalances more comparatively fragile EMs, the Fragile Turkey and South Africa. Only two
difficult. Previous EM crises have 164 , with a focus on these key risk indi- countries, Kenya and Romania, are
showed that a slow policy response to cators. projected to post shortfalls of more
rising imbalances can indeed lead to a than -4% of GDP in 2021, a value often
sharp deterioration in market confi- Current account deficits have signifi- used as the threshold between critical
dence. The key indicators that identify cantly declined and adequate deficits (see Figure 6). In
EM vulnerabilities and also differen- 2013, five out of the Fragile 16 ex-
tiate between economies are the cur- The external balances of major EMs ceeded this threshold. This suggests
rent account balance, credit growth, are currently more favorable than back that these EMs are currently overall less
inflation, currencies, policy interest in 2013. Most of the 16 EMs in our dependent on foreign capital inflows
rates, foreign exchange reserves, sove- sample are forecast to record a smaller than in 2013 – at least for now – bo-
reign debt and bonds. In the following current account deficit in 2021 than ding well for the eventual Fed tapering.
Figure 6: Current account balances (% of GDP) of selected EMs
Kenya
Romania
Nigeria
Colombia
South Africa
Chile
Turkey
Indonesia
Mexico
Argentina
India
Philippines
Hungary
Brazil
Ukraine
Russia High risk
-10% -8% -6% -4% -2% 0% 2% 4%
2013 2021f
Sources: National statistics, IMF, Allianz Research forecasts
4
The 16 selected “comparatively fragile EMs” – the Fragile 16 – comprise the 10 EMs we identified as fragile in 2013 and the 13 most fragile EMs we have identified in early 2021, both
6 out of a larger group of 28 economies. There is an overlap of seven countries between these samples from 2013 and 2021.12 April 2021
Credit growth is more sustainable monetary policy style, including lower- tion below the 5% mark and within the
ing interest rates to levels that will in- individual target ranges of their nation-
Also positive from a risk point of view, crease rather than decrease economic al central banks in 2021, which is an
credit growth to the private sector was imbalances. improvement compared to 2013 (see
more moderate in our sample of EMs in Figure 8).
2020 than it was in 2013, despite the Inflation to remain in check in most EMs
massive monetary easing that was im- Another traditional indicator for infla-
plemented to mitigate the impact of A view on consumer price inflation rates tion expectations are inflation-linked
the Covid-19 pandemic on economies. provides a more differentiated picture. bonds, both in terms of the amount
This may reflect less demand for credit In 2013, Argentina was the only country issued and in terms of breakeven infla-
amid the crisis and will reduce growth with double-digit inflation (10.6%) in our tion. Although these bonds are not
prospects in the near term but it also sample of 16 EMs. In 2021, we forecast available for all the countries in our
indicates lower liquidity risk than during Argentina, Nigeria and Turkey to post sample, for the countries that do have
the taper tantrum period in 2013-2014. average annual inflation rates well them, the picture is very similar to our
This is particularly the case for Brazil, above 10% (45% in the case of Argenti- forecasts in terms of countries at risk of
Colombia, Russia, India, the Philippines na), which will also be clearly higher higher inflation (see Figure 9). Among
and Indonesia, countries where credit than the rates recorded eight years the countries in the selection, Turkey
growth was at or above our 15% thresh- ago. Ukraine (6.6% forecast in 2021 vs. has been one of the most volatile, with
old in 2013, indicating elevated risk5. -0.3% in 2013) and Kenya (5.1% vs. break-even inflation above 15%. It was
However, rapid credit growth still flash- 1.1%) should also post significantly accentuated because of the financial
es warning signals in Turkey, Argentina higher inflation this year than eight turmoil that has taken place after the
and Nigeria, where it rose by well years ago, with Ukraine’s projected rate latest events around the central bank.
above 20% y/y on average in 2020, as to exceed the central bank’s 5% ± 1pp Apart from Turkey, other countries such
well as in Hungary (17% y/y, see Figure inflation target range. South Africa, as Brazil, Russia and Ukraine have re-
7). At the time of writing, a clear down- Hungary, Chile, the Philippines and Co- cently increased their respective inter-
ward trend in credit expansion was only lombia are also expected to record est rates. These moves confirm that
visible in Argentina. Meanwhile, the higher inflation in 2021 compared to some Emerging Economies are already
expected transmission of sharp interest 2013, but the price changes should be fighting these expectations.
rate hikes in Q4 in Turkey into slower kept in check, i.e. remain below 5%, and To summarize, we expect inflation to
credit growth has yet to materialize. In within the central banks’ respective tar- remain under control across major EMs
fact, this may not happen at all after get ranges. In Russia, average annual in 2021, excluding a few vulnerable
the dismissal in mid-March 2021 of inflation is forecast to increase from economies that already experienced
Central Bank governor Agbal who had 3.4% in 2020 to 5.1% in 2021, thus ex- crises prior to the Covid-19 pandemic.
been in office for just four months and ceeding the 4% inflation target, but it This offers room for central banks to
was responsible for the appropriate will be lower than the 6.8% posted in provide support to their domestic econ-
rate hikes. Markets now fear that Tur- 2013. India, Brazil and Indonesia are omies, and perhaps governments, in
key will revert to its known unorthodox expected to experience moderate infla- the event that foreign credit dries up.
Figure 7: Private sector credit growth (%) of selected EMs Figure 8: Average annual inflation (%) in selected EMs
Turkey Argentina 45%
Argentina Turkey
Nigeria Nigeria
Hungary Ukraine
Brazil Kenya
Chile Russia
Colombia India
Russia Brazil
Kenya South Africa
India Romania
Mexico Hungary
Philippines Chile
Romania Mexico
South Africa Philippines
Indonesia Colombia
Ukraine Rising risk Indonesia
0% 2% 4% 6% 8% 10% 12% 14%
-10% 0% 10% 20% 30% 40%
2013 2020 2013 2021f
Sources: National statistics, IMF, Allianz Research Sources: National statistics, IMF, Allianz Research forecasts
5
The threshold is given as 150% of the long-term average of the monthly medians (of private sector credit growth) of approximately 160 EMs.
6
Here it is calculated as the difference between the nominal bonds yield and the inflation-linked bond yield. It is the level of inflation that would provide equal real yield in both type of 7
bonds.Allianz Research
Figure 9: Inflation-linked bonds across selected EMs Figure 10: Exchange rates of selected EMs
Growth IXL bonds outs. 2018 (LHS) Growth IXL bonds outs. 2019 (LHS)
Growth IXL bonds outs. 2020 (LHS) Growth IXL bonds outs. 2021 (LHS)
B/Even Inflation 2018 (RHS) B/Even Inflation 2019 (RHS)
B/Even Inflation 2020 (RHS) B/Even Inflation 2021 (RHS)
45% 18%
30% 12%
15% 6%
0% 0%
-15% -6%
BRA CHL MEX COL RUS POL THA TUR ZAR
Sources: Refinitiv, BofA, Allianz Research Sources: IHS Markit, Allianz Research
Currencies to remain volatile but no gure 10 shows the largest movements Russia, Brazil), interest rates should re-
broad-based repeat of the deep slides in the FX Market since the end of 2020. main low in the EM world, by and large,
in 2020 Looking ahead, our internal calcula- and continue to support the recovery in
tions show that some currencies may 2021-2022. And even if rates are hiked
When looking at the evolution of cur- have depreciated too much, and there moderately in a few other countries
rencies, 2020 was a year of generalized could be room for some reversal, al- over the next 12 months, as will likely be
depreciations of EM currencies, if we though still not enough to reach 2019 the case, we expect the overall moneta-
exclude some strong Asian economies levels. On the other hand, there are ry policy stance in EMs to remain loose.
(China, South Korea and Malaysia), currencies that could still depreciate This will continue to provide space for
Chile and the Eastern European curren- further, such as the Mexican peso, alleviating any impact of the eventual
cies highly correlated with the euro. South African rand or the Thai baht. The Fed tapering on EMs without putting
There were different intensities, ranging Argentinian peso and the Turkish lira the recovery path at risk.
from the small movements of the rest of seem to position themselves as the
the APAC currencies such as the Thai most volatile currencies among the se- External financing requirement reveals
baht (almost flat) or the Indonesian lection. weak spots
rupiah (-1.2%) to the strong deprecia- However, the pace of the Covid-19
tions in Brazil (-29%) or Argentina (- shock recovery, the high risk of policy With regard to the foreign exchange
40%). mistakes – as idiosyncratic features – (FX) reserves coverage of maturing
The common denominator of 2021 has and the evolution of the US economy short-term external debt, the situation
been volatility – much of it also im- and global financial markets – as syste- has worsened since 2013. In six coun-
ported from the US – but the first quar- mic risks – could dramatically change tries, the external debt payments falling
ter indicates further strengthening of the outlook. due in the next 12 months significantly
the USD, mainly against the euro- exceed the level of official FX reserves
centric Eastern Europe and APAC cur- Monetary policy to remain accommo- held at the respective central banks,
rencies. In Latin America, the deprecia- dative overall despite an expected mo- notably in Turkey where the debt is
tions have deepened – now including derate tightening more than four times higher than re-
the Colombian peso. Meanwhile, the serves (see Figure 12). Four of the six
Monetary policy interest rates are cur- countries (Turkey, Argentina, South Afri-
Turkish lira slumped at the end of rently lower for most EMs than in 2013,
March after the firing of the central ca, Chile) have been through one or
except for countries that have suffered several crises over the past few years.
bank governor Agbal who had calmed from the aftermath of a recent crisis,
financial markets prior through appro- As a result, the economies experienced
such as Argentina, Mexico, Turkey and net capital outflows and currency pres-
priate monetary tightening during his Nigeria (see Figure 11). In most cases,
short term in office. Markets now fear sures. Mostly unsuccessful FX interven-
policy rates were already on a down- tions by the respective central banks to
that Turkey may reverse that policy ward path prior to 2020 as a result of
course too quickly which could maneu- mitigate the financial turbulence have
easing inflationary pressures and were led to a drawdown of FX reserves. On
ver the economy once again close to cut further during the pandemic in or-
the next currency crisis. Meanwhile, as the other hand, a majority of EMs inclu-
der to mitigate the impact of the crisis. ding India, Brazil, Russia and Mexico
other main currencies such as the euro Even if some central banks raised policy
or the Japanese yen are losing ground have ample reserves, which strengthen
rates in March 2021 in response to their central banks’ policy options in the
against the USD as well, the impact on above-target inflation (Ukraine, Turkey,
those exchange rates is lessened. Fi- event of external shocks.
812 April 2021
Figure 11: Key monetary policy interest rates in selected EMs
16% 90% 8% 30%
14% 80% 7%
25%
70%
12% 6%
60% 20%
10% 5%
50%
8% 4% 15%
40%
6% 3%
30% 10%
4% 20% 2%
5%
2% 10% 1%
0% 0% 0% 0%
12 13 14 15 16 17 18 19 20 21 12 13 14 15 16 17 18 19 20 21
Brazil Chile Colombia Mexico Argentina (rhs) Hungary Romania Ukraine (rhs) Russia (rhs) Turkey (rhs)
9% 20%
8% 18%
7% 16%
14%
6%
12%
5%
10%
4%
8%
3%
6%
2% 4%
1% 2%
0% 0%
12 13 14 15 16 17 18 19 20 21 12 13 14 15 16 17 18 19 20 21
India Indonesia Philippines South Africa Nigeria Kenya
Sources: National statistics, IHS Markit, Allianz Research
Figure 12: Maturing external debt over the next year in relation to FX reserves (%) in selected EMs
Turkey 454%
Argentina
Ukraine
South Africa
Romania
Chile
Hungary
Indonesia
Mexico
Colombia
Kenya
Philippines
Russia
Brazil
India
High risk
Nigeria
0% 50% 100% 150% 200% 250%
2013 2021f
Sources: National statistics, IMF, Allianz Research forecasts
9Allianz Research
Risks with regard to sovereign debt On the other hand, this risk has decli- We conclude from this analysis of cru-
ned since 2013 in Hungary, Mexico, the cial vulnerability indicators that, by and
On a negative note, the share of non- Philippines and Brazil because the large, major EMs are in a better posi-
residents’ holdings of public debt has share of nonresident holdings of public tion to withstand the impact of even-
increased in many EMs over the last debt has markedly fallen in these mar- tual US Fed tapering than they were in
seven years. In Indonesia, Ukraine, Ke- kets. 2013. Yet, the risk of widespread finan-
nya, Romania, Argentina, Turkey, Chile cial market turmoil is not negligible,
and South Africa, it currently exceeds Meanwhile, the spreads of hard curren- especially if the Fed tapering is badly
35% of total public debt (see Figure 13). cy sovereign bonds present two diffe- communicated. Moreover, a few mar-
This increases the risk of a sudden capi- rent trends. The main EMs in Asia and kets are currently more vulnerable than
tal reallocation from EMs to the US and Central and Eastern Europe now have others, mostly due to macroeconomic
financial market turbulence in EMs in narrower spreads than they did in April imbalances or a lack of economic poli-
the event that the Fed tapers and hikes 2013, so in case of a future spike the cy leeway to counter cyclical weak-
rates earlier than currently announced starting point is lower. The opposite nesses. In the next section we will iden-
and without appropriate advance com- situation is visible in Turkey and the tify the weak spots by combining the
munication. This will make financing main Latin American and African advanced indicators for financial ten-
more expensive for EMs, also for the economies in our sample (see Figure sions in EMs in a scoring model.
private sector (notably corporates), so 14).
that payment behavior could deterio-
rate and insolvencies may increase.
Figure 13: Non-resident holding of total public debt (%) Figure 14: EM hard currency sovereign bond spreads (bps)
Argentina
Indonesia
Ukraine*
Ukraine
Turkey
Kenya Nigeria
Romania Egypt
Argentina Kenya
Turkey
South Africa
Brazil
Chile
Colombia
South Africa Mexico
Hungary Russia
Colombia Romania*
Mexico Indonesia
Philippines
Russia
Chile
Philippines Croatia*
Brazil Malaysia
Higher risk
India Poland*
0% 10% 20% 30% 40% 50% 60% 0 200 400 600 800 1000
2013 2020 Current Apr 2013
Sources: IIF, IHS Markit, Allianz Research estimates Note: * indicates that the hard currency is EUR, otherwise USD.
Sources: Refinitiv, BofA, Allianz Research
1012 April 2021
WHICH COUNTRIES ARE
MOST AT RISK?
Even if we expect this time to be differ- We have undertaken a reality check Seven EMs are particularly fragile to a
ent from 2013 with regard to the US and identified the most fragile EMs with potential repeat of the 2013 taper tan-
Fed policy announcements, financial regard to : trum over the next two years or so ac-
market reactions and the pre- Liquidity risk (current account bal- cording to our analysis, the TUCKANS:
conditions in many major EMs, there ance, short-term external debt due, Turkey, Ukraine, Chile, Kenya, Argenti-
will be some among the latter that are import cover, private sector credit na, Nigeria and South Africa. Less vul-
more vulnerable than others to a taper growth) and nerable but not fail-safe are Brazil,
tantrum, especially if the Fed’s actions Cyclical risk (currency risk, inflation, Mexico, Colombia, Hungary, Russia and
are not well communicated. commodity dependence, equities, Romania, which should thus also be
bonds). monitored closely.
The result is summarized in Figure 15.
Figure 15: Advanced indicators for financial tensions in major EMs
Source: Allianz Research
11Allianz Research
WHAT COULD THIS MEAN
FOR MARKETS?
The Fed has committed to keep rates As we have seen lately, the movements tries in Figure 16, Argentina and
low and the consensus is that the first in the US bond markets have had cor- Ukraine deserve a special mention, with
rate hikes would take place in 2023, responding aftershocks in local curren- interest rates in the local currency
with the tapering starting in 2022. cy bond yields in developing countries. bonds above 40% and 10%, respective-
However, stress in the US bond markets In terms of hard currency bonds, the ly. Their curves have flattened in the last
or rising inflation expectations bring the movements in the US bond market couple of months, with decreases in the
question of what could happen if some have not yet caused generalized long end (from 50.8% to 46.6% in the
measures need to be anticipated. As it spread widening in EMs (with the ex- Argentinian 7Y), and increases in the
was the case in 2013, and has been at ception of Turkey), which could have short end. In those two countries, the
other occasions, a (mis)calculated made things harder. idiosyncratic pressures of both countries
speech by a central banker could be and the situation that they had already
enough to unchain the reaction, even if Figure 16 shows the latest volatility in at the beginning of the year play an
the words materialize into actions only sovereign bonds issued in local curren- important role. The fact that
months or years afterwards. Although cy. In broad terms, the figure also corro- movements in their bond markets may
tightening in the US will certainly gene- borates the findings of the taper tan- go in the opposite direction as the rest
rate pressures worldwide, the Fed trum risk indicator: the largest moves so of EM countries is not necessarily a
claims to have learnt its lesson. Whe- far took place in the TUCKANS. As men- good signal.
ther the announcements, the tapering tioned in previous sections, the events
and the hikes are somehow predictable at the Central Bank of Turkey have
and relatively structured will determine created turmoil in Turkish financial mar-
the impact and will prove whether the kets, which exacerbates the trend seen
lesson was really understood. in other regions. In addition to the coun-
Figure 16: Changes in the LC sovereign yields since 01.02.2021 (in bps) – 1Y and 10Y
Turkey
Brazil
Nigeria
Mexico
Colombia
Philippines
Russia
South Africa
Chile
Czechia
Thailand
Kenya
Malaysia
Romania
Poland
-200 0 200 400 600 800
10Y 1Y
Note: The graph shows only a sample of the countries analyzed, that corresponds with the countries with the highest increases in the 10Y bonds.
Sources: Refinitiv, BofA, Allianz Research
1212 April 2021
Figure 17: Differential between past economic growth and current cost of Figure 18: Volatility in the FX market – selected currencies against the
debt (measured as the average coupon of the sovereign debt) USD
14% 24
TRY +2
12% +1 x=y
10%
8% 18
BRL
As of 31.03.2021
6%
4%
12
2% MXN
0%
-2%
6
-4%
ARS
-6%
BRA
UKR
RUS
TUR
THA
CZE
ZAF
MEX
IDN
IND
POL
NGA
KEN
COL
MYS
PHL
CHN
PER
HUN
ROU
0
0 6 12 18 24
Differential Avg Coupon Avg YoY Nom. Growth 2015-2019
As of Feb19
Note: Argentina’s not shown as the picture would not contain the defaulted bonds Note: The volatility of the Turkish lira was already one of the highest before 15
in 2020. March.
Sources: Refinitiv, national statistics, Allianz Research Sources: Refinitiv, Allianz Research
Although the concept of a taper tan- Most of the TUCKANS are again at risk rise as well, including the potential ta-
trum is linked to volatility in the short when looking at the interest rate- per tantrum.
term, should the increase in the interest growth differential: Nigeria, Ukraine,
rates remain; it could have harming Turkey, Kenya and South Africa Even if a proper taper tantrum does not
effects on debt sustainability. Low inter- (Argentina as well, refer to the note on finally materialize in generalized out-
est rates are key for sustaining current Figure 17). In addition, some of the flows from EMs and generalized spikes
levels of indebtedness, especially when countries that appeared in the second in sovereign yields and spreads, the
the programs to fight Covid-19 and its group regarding their taper tantrum struggle to overcome the Covid-19 cri-
lasting effects may require more financ- risk (Brazil, Russia, Colombia) could sis (both from sanitary and economic
ing. face severe debt sustainability issues, perspectives), rising inflation expecta-
given the already high differential be- tions and the eventual Fed tightening
To analyze that, in addition to the tween payable coupons and economic are elements that will increase volatility
changes shown in Figure 16, we have growth. In terms of maturity, among the across EMs, at least to higher levels
performed an analysis of the differen- countries more at risk, Turkey and Brazil than seen in the period preceding the
tial between the interest rates and are the ones with the shortest term, Covid-19 shock. In fact, since the trough
growth rates. This is a common meas- which adds more uncertainty as they of the oil crisis in 2015, and with the
ure of debt sustainability, as the cost of would have more redemptions in 2021. exception of local instabilities, EMs had
debt is compared with the returns it On the opposite side, we find the Asian performed relatively well.
provides. For the calculation, we use the economies and Central and Eastern
average coupon that EM countries are Europe (with the exception of Russia Will higher volatility become the norm
paying for their sovereign debt and the and Ukraine). Their reasons, however, in the coming years? We cannot answer
average nominal yearly growth be- are different: while the Eastern Europe- the question yet, but we have already
tween 2015-2019. The countries that in an countries are characterized by low seen how the volatility that came after
Figure 17 show a positive difference interest rates and moderate economic Covid-19 has not fully disappeared.
between average coupon and past growth, some of the Asian economies One example is the FX market.
economic growth could have problems like India, Indonesia and Philippines are
in the coming years if they do not man- characterized by strong economic To observe this, we compare moving
age to change one or both variables. As growth that makes up for interest rates standard deviations on exchange rate
the starting point of GDP in 2020 is low, above 5%. changes at different points in time. In-
the potential growth is higher. But will it stead of taking the values around the
be enough to offset the cost of debt? As In any case, the figure uses pre-crisis volatility peak in March 2020 – which
of today, we have been observing some economic growth, so the perspectives could be considered one-offs - we take
increases in the interest rates that could could change for some countries, either the situation one year before and one
make it harder, a situation that could because they are not able to go back to year after (current). We observe in Fig-
worsen in the event of a taper tantrum. pre-crisis growth rates, or because they ure 18 how the volatility is generally
Figure 17, read from left to right, shows manage to recover quickly and strong- higher, with currencies such the Turkish
the countries with the largest imbalanc- ly. In terms of how the interest rates lira, Brazilian real and Mexican peso
es. could change in the future, there are being the most affected.
some risks that indicate that they could
13Allianz Research
Yet another proof of volatility, both in At this point, it is important to note the mark an important distinction from the
the US and in the EMs, is the flow of interdependency of financial markets. situation in May 2013, when Bernanke’s
capital from/to these markets. After a One should not forget that central arguments for tapering were more on
2020 of net outflows in most of the local banks, by tampering the risk perception the line of exhausted effectiveness of
bond markets, the flows in Q1 2021 in their intent to contain idiosyncratic some monetary tools. It is not only the
depict an erratic trajectory. In principle, risks, have increased interdependence fact that interest rates rise, but also the
we expect the cumulative balance to be between different asset classes7. For the reason why they rise.
positive, with net inflows to EMs in 2021, case of this paper, this means that in
but at the same time with high volatility the case of negative developments, the All in all, we expected a bumpy 2021,
in both size and direction of the net improvements of a country’s situation which by definition includes some vola-
flows. would not be enough to avoid the con- tility in expectations through the year.
tagion, although it is always preferable As of today, with the mentioned excep-
The situation differs considerably across to have low idiosyncratic pressures. tions of particular countries, the current
countries. Figure 19 shows the standar- Taking into account that the departure developments fit into the turbulence
dized cumulative flows to local bond points are the Covid-19 levels, the narrative. Whether the turbulence re-
markets since 2018 in a selection of growth expectations look better now mains manageable will depend on ma-
countries. While Q4 2020 was positive than they did in 2013-2015. Further- ny factors, one of them being the indi-
in terms of inflows for most of the coun- more, there are signs of rising inflation rect effects of US tapering, but it is defi-
tries, Q1 2021 is much more hetero- expectations that in general will remain nitely not the only one.
geneous. under control. These two elements
Figure 19: Cumulative flows since 31.12.2018 in the local bond markets, standardized
1.8
1.6
1.4
1.2
1
0.8
0.6
Dec-18 Jun-19 Dec-19 Jun-20 Dec-20 Jun-21
Brazil Poland South Korea Mexico Thailand India Turkey
Sources: Refinitiv, Allianz Research
7
To deepen into the topic of QE and diversification, refer to one of our latest papers QE and the bull market in everything but diversification.
14OUR TEAM
15RECENT PUBLICATIONS
07/04/2021 Unleashing excess foreign exchange reserves to boost growth in Latin America
06/04/2021 Joe Biden's infrastructure plan: defying gravity
01/04/2021 Race to the post Covid-19 recovery: 7 obstacles to overcome
26/03/2021 The Suez Canal ship isn't the only thing clogging global trade
23/03/2021 The Hotel California effect: How the European hospitality sector is looking for people
who stay
22/03/2021 China's policy mix: "proactive" and "prudent" in name, tightening in practice
17/03/2021 Show me the money: debunking a couple of myths about excess liquidity
15/03/2021 The irony of Biden's super stimulus: USD360bn for exporters around the world
11/03/2021 Commodities: higher demand, supply bottlenecks, but no speculation (yet)
08/03/2021 US yield: Let's twist again?
05/03/2021 Tourism: Europe will be at the frontline of the recovery, but only in 2024
03/03/2021 The not so merry adventures of the Robin Hood generation in financial markets
25/02/2021 Covid-19 one year on: 1.8 million additional long-term unemployed in Europe
24/02/2021 European corportaes: (active) cash is king
23/02/2021 QE and the bull market in everything but diversification
18/02/2021 Risk literacy and choices - Stubbing toes in the dark
17/02/2021 Digital-enabling countries proved more resilient to the Covid-19 economic shock
15/02/2021 Italy: Draghinomics FAQ
11/02/2021 Is the Chinese ox reflating the world, one container at a time?
09/02/2021 China: Riding the silicon ox?
08/02/2021 Big Oil: At risk of becoming fossil firms?
04/02/2021 Covid-19 vaccines: a USD40bn revenue windfall for pharmaceuticals
03/02/2021 Vaccination delay to cost Europe EUR90bn in 2021
27/01/2021 Allianz Regional Pension Report 2021: Asia
26/01/2021 EU vs. U.S. vs. China: The hot race for green tech dominance to cool the global cli-
mate
20/01/2021 President Biden's inauguration: 100 days to save America?
19/01/2021 Allianz Risk Barometer 2021
18/01/2021 The world is moving East, fast
Discover all our publications on our websites: Allianz Research and Euler Hermes Economic Research
16Director of Publications: Ludovic Subran, Chief Economist
Allianz and Euler Hermes
Phone +33 1 84 11 35 64
Allianz Research Euler Hermes Economic Research
https://www.allianz.com/en/ http://www.eulerhermes.com/economic-
economic_research research
Königinstraße 28 | 80802 Munich | 1 Place des Saisons | 92048 Paris-La-Défense
Germany Cedex | France
allianz.research@allianz.com research@eulerhermes.com
allianz euler-hermes
@allianz @eulerhermes
FORWARD-LOOKING STATEMENTS
The statements contained herein may include prospects, statements of future expectations and other forward -looking
statements that are based on management's current views and assumptions and involve known and unknown risks and
uncertainties. Actual results, performance or events may differ materially from those expressed or implied in such forward -
looking statements.
Such deviations may arise due to, without limitation, (i) changes of the general economic conditions and competitive situa-
tion, particularly in the Allianz Group's core business and core markets, (ii) performance of financial markets (particularly
market volatility, liquidity and credit events), (iii) frequency and severity of insured loss events, including from natural ca-
tastrophes, and the development of loss expenses, (iv) mortality and morbidity levels and trends, (v) persistency levels, (vi )
particularly in the banking business, the extent of credit defaults, (vii) interest rate levels, (viii) currency exchange rat es
including the EUR/USD exchange rate, (ix) changes in laws and regulations, including tax regulations, (x) the impact of
acquisitions, including related integration issues, and reorganization measures, and (xi) general competitive factors, in
each case on a local, regional, national and/or global basis. Many of these factors may be more likely to occur, or more
pronounced, as a result of terrorist activities and their consequences.
NO DUTY TO UPDATE
The company assumes no obligation to update any information or forward -looking statement contained herein, save for
any information required to be disclosed by law.
17You can also read