Environmental and Economic Assessment of Castor Oil Supply Chain: A Case Study
←
→
Page content transcription
If your browser does not render page correctly, please read the page content below
sustainability

Article
Environmental and Economic Assessment of Castor
Oil Supply Chain: A Case Study
Luigi Pari , Alessandro Suardi * , Walter Stefanoni , Francesco Latterini                and
Nadia Palmieri
 Consiglio per la Ricerca in Agricoltura e l’analisi dell’Economia Agraria (CREA)—Centro di Ricerca Ingegneria e
 Trasformazioni Agroalimentari, Via della Pascolare 16, Monterotondo, 00015 Rome, Italy;
 luigi.pari@crea.gov.it (L.P.); walter.stefanoni@crea.gov.it (W.S.); francesco.latterini@crea.gov.it (F.L.);
 nadia.palmieri@crea.gov.it (N.P.)
 * Correspondence: alessandro.suardi@crea.gov.it; Tel.: +39-06-9067-5248

 Received: 30 June 2020; Accepted: 5 August 2020; Published: 6 August 2020

 Abstract: Among the species currently cultivated for industrial vegetable oil production, castor could
 be a good candidate for future investments due to the good resistance to pests, tolerance to drought,
 and suitability for marginal lands cultivation. In addition, the production of castor oil from Ricinus
 generates a large quantity of press cake, husks, and crop residues that, in a framework of bioeconomy,
 could be used as by-products for different purposes. Using a case study approach, the work presents
 results of the environmental impact assessment and economic feasibility of the production of castor
 oil from two different castor hybrids comparing four by-products management scenarios and two
 harvesting systems (manual vs. mechanical). Castor hybrid C-856 harvested manually and that
 involved only the soil incorporation of press cake obtained by the oil extraction resulted as the most
 sustainable. The hybrid C-1030 resulted as more profitable than C-856 when harvested with the
 combine harvester. The ratio between gross margin and GWP emissions was applied to calculate
 the economic performance (gross margin) per unit of environmental burden. Findings showed that
 Sc1B scenario in case of C-856 cultivar hybrid had a better ratio between economic performance and
 greenhouse gas (GHG) emitted into the atmosphere (€3.75 per kg CO2 eq).

 Keywords: bioeconomy; life cycle assessment; life cycle costing; Ricinus communis, L.; castor oil;
 harvesting; by-product; residue management

1. Introduction
     The world’s population is estimated to exceed 9 billion people by 2050 according to FAO (2009).
Thus, increasing in food and energy demand worldwide cannot be avoided: projections show that the
overall food production is expected to rise by 70% [1] while the global demand for energy will increase
by more than a quarter to 2040 [2]. Bioenergy production primarily aims at the greenhouse gas (GHG)
reduction and achieving such a goal may lead to indirect land use change. Competition for land use
among food and non-food crops is a serious issue that European Commission has been addressing for
decades, and more stringent policy measures regarding sustainable production of food and energy are
on the Agenda. On 1 January 2021 the proposed new directive RED II will enter into force, setting the
new thresholds for minimum renewable energy share [3]. Investments on biofuel production from
non-food feedstock are largely promoted by UE. New policy measures aim to achieve a 27% renewable
energy share consumed by the electricity, heating and cooling, and transportation sectors by 2030 [3].
The adoption of energy crops could generate benefits from the reduction of fossil energy dependence,
improvement of rural economies, and the achievement of environmental goals [4]. Biodiesel production
from vegetable oils is feasible and widely accepted as an alternative strategy to meet these goals: It has

Sustainability 2020, 12, 6339; doi:10.3390/su12166339                        www.mdpi.com/journal/sustainability
Sustainability 2020, 12, 6339                                                                          2 of 17

similar properties to oil-derived diesel and, furthermore, it produces lower sulfur emission. Among the
species currently cultivated for industrial vegetable oil production, castor could be a good candidate
for future investments due to the good resistance to pests, tolerance to drought, and suitability for
marginal lands cultivation [5]. According to FAO, in 2017, almost 1.8 million tons of castor seed had
been produced worldwide, and Europe is the main user [6]. Furthermore, according to industry
executives, the worldwide castor oil market is growing: The global castor oil market was $1180 million
in 2018 and is expected to reach $1470 million by the end of 2025, growing at a compound annual
growth rate (CAGR) of 2.8 percent between 2019 and 2025, according to international reports [7].
The price of castor oil in the beginning of 2019 in the international market reached 1600 dollars per ton
compared with 1300 dollars per ton of 2018 [8].
      In addition, the production of castor oil from Ricinus generates a large quantity of press cakes, husks,
and crop residues [9] that, in a framework of bioeconomy, could be used as by-products for different
purposes. In this framework, the European Project MAGIC (Marginal lands for Growing Industrial
Crops—Grant Agreement number: 727698-MAGIC-H2020-RUR-2016-2017/H2020-RUR-2016-2) aims
towards the development of resource-efficient and economically profitable industrial crops to be
grown on marginal land. Among industrial crops considered in the Project, there is Ricinus communis,
L. (castor) that is cultivated for its seed oil, which is employed extensively in medicine, pharmaceuticals,
and biorefineries [10]. Castor is a vigorous fast-growing herbaceous plant native to tropical Africa [11,12]
which is tolerant to salinity and drought stresses, with additional benefits of providing a multi-purpose
oilseed production [13]. In the world, the most productive country is India (more than 80% of
the worldwide production) along with Mozambique, China, Brazil, Myanmar, Ethiopia, Paraguay,
and Vietnam. These are all developing countries that benefit from low labor costs, and the economic
impact of the harvesting phase is thus sustainable. The lack of possibility to harvest the seeds
mechanically is dictated by a high amount of aboveground biomass produced by wild cultivars that
cannot be processed by common combine harvesters. In fact, clogging may occur in the case of a high
quantity of aerial biomass production, and high seed losses. In order to solve this problem, breeders
around the world are struggling to produce hybrids of castor exhibiting high productivity but shorter
in height and with homogeneous ripening of the capsules.
      To our knowledge, limited studies have been dedicated to the environmental and economic
sustainability of castor [14,15]. Some studies are focused on the sustainability assessment of the residue
biomass utilization [16] or biodiesel production [17] without investigating in detail the impact of the
various castor agricultural stages and different residue management. In particular, a comparison the of
the environmental sustainability between different castor hybrids, harvesting methods, and by-products
management have not been presented in the literature. Using a case study approach [18,19], the
work aimed to present results concerning the estimation of the environmental impacts caused by two
different castor hybrids harvested both manually and mechanically (manual vs. mechanical harvestings).
Both hybrids had similar seed yields, even though hybrid C-856 is shorter than hybrid C-1030. The latter
reported a higher amount of epigeal biomass. Various scenarios of on-farm by-products managements
were analyzed. Starting by the same approach, the study carried out an economic assessment to identify
the most advantageous scenario for each castor variety and residue management.

2. Materials and Methods

2.1. Study Sites
     The study area is located in Geaca Municipality, Cluj District (Romania). Cluj District lies in the
northwestern half of the country, between parallels 47◦ 28’ in North and 46◦ 24’ in South, meridians
23◦ 39’ in west and 24◦ 13’ in east, respectively. It is located in the contact zone of three representative
natural units: Apuseni Mountains, Somes, Plateau, and Transylvanian Plain. Cluj District is the 12th
largest in the country and accounts for almost 3% of Romania’s area. It is bordered to the northeast by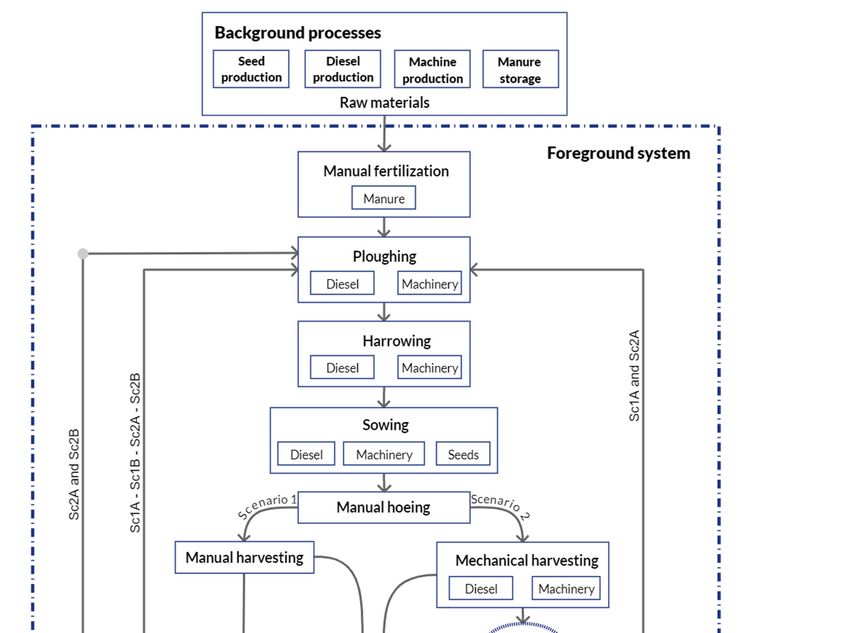
Sustainability 2020, 12, 6339                                                                                               3 of 17

Maramures, and Bistrit, a-Năsăud counties, to the east by Mures, District, to the south by Alba District,
and to the west2020,
     Sustainability  by 12,
                          Bihor   and
                              x FOR    Sălaj
                                    PEER     counties.
                                         REVIEW                                                              3 of 16
     The   trials were
     Sustainability        carried
                    2020, 12,        outREVIEW
                              x FOR PEER  on the 8th and 9th of October 2019 in two different experimental   3 of 16fields
where castorThe was
                 trialsharvested
                        were carried    out on 1).
                                      (Figure  the 8th and 9th of October 2019 in two different experimental fields
      where castor
          The trialswas harvested
                     were          (Figure
                          carried out      1).8th and 9th of October 2019 in two different experimental fields
                                      on the
      where castor was harvested (Figure 1).

            Figure
        Figure      1. Study
               1. Study      area
                          area andand experimentalfield
                                    experimental   field location
                                                          location (Geaca
                                                                    (GeacaMunicipality,
                                                                           Municipality,Cluj District,
                                                                                          Cluj         Romania).
                                                                                                District, Romania).
              Figure 1. Study area and experimental field location (Geaca Municipality, Cluj District, Romania).
       MainMain     features
              features         of the
                          of the        experimentalfields
                                    experimental           fields are
                                                                  are given
                                                                      given in  inTable
                                                                                   Table1.1.Data
                                                                                             Datawere
                                                                                                    weretaken  bothboth
                                                                                                            taken    fromfrom
                                                                                                                            GIS GIS
       analysis
            Mainand    from
                    features  field
                                of   relieves
                                   the          with
                                        experimental
analysis and from field relieves with clinometer.      clinometer.
                                                           fields are  given   in Table 1.  Data were   taken  both  from   GIS
            As
       analysis highlighted
                and    from      in
                              field Table
                                     relieves1, all
                                                withfields  have
                                                       clinometer.southern    exposition  and  the
       As highlighted in Table 1, all fields have southern exposition and the prevalent altitude ofprevalent   altitude  of 313
                                                                                                                              313 m
       m a.s.l.
            As was    recordedininTable
                highlighted            Field1,2all
                                                 while   thehave
                                                    fields    maximum
                                                                   southernslope   was recorded
                                                                              exposition  and theinprevalent
                                                                                                     Field 1. However,
                                                                                                               altitude ofboth
                                                                                                                            313
a.s.l. was recorded in Field 2 while the maximum slope was recorded in Field 1. However, both fields
       fields can
       m a.s.l. wasbe recorded
                      considered   inflat  terrains.
                                       Field  2 while Thethesurface
                                                              maximumof theslope
                                                                            field 2was
                                                                                    wasrecorded
                                                                                         0.27 ha higher
                                                                                                  in Fieldthan Field 1. A view
                                                                                                            1. However,   both
can be of
          considered
          experimental
                         flat  terrains. The on
                           fields positioning
                                                    surface    of the fielddated
                                                       Sentinel-2
                                                                              2 was September
                                                                                      0.27 ha higher     than  Field  1. A 2.
                                                                                                                            view of
       fields can be considered       flat terrains. The    surfaceimage
                                                                     of the field 23was           2019 isthan
                                                                                         0.27 ha higher    given in Figure
                                                                                                               Field 1. A view
experimental
       of experimental fields positioning on Sentinel-2 image dated 3 September 2019 is given in Figure 2.2.
                  fields  positioning        on  Sentinel-2     image    dated    3 September    2019  is  given  in Figure

            Figure 2. Experimental fields positioning. Base map Google Satellite Images dated 3 September 2019.
      Figure 2. Experimental
           Figure             fields
                  2. Experimental     positioning.
                                  fields positioning.Base
                                                      Base map GoogleSatellite
                                                           map Google Satellite  Images
                                                                               Images   dated
                                                                                      dated     3 September
                                                                                            3 September 2019.2019.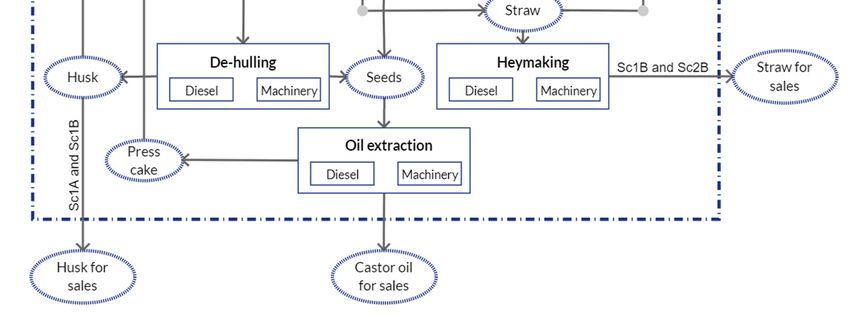
Sustainability 2020, 12, 6339                                                                                                4 of 17

                        Table 1. Main features of the experimental fields for castor harvesting.

                       Prevalent        Minimum            Maximum                              Prevalent
 Experimental                                                                 Prevalent                             Surface
                         Slope           Slope              Slope                               Altitude
    Field                                                                     Exposition                             [ha]
                          [%]             [%]                [%]                                [m a.s.l.]
         1                 8.5              7.9                8.7              South                294              0.25
         2                 5.7              4.1                7.2              South                313              0.47

2.2. Crop Characteristics and Management of the by-Products
      The main data of two dwarf hybrids of Ricinus communis (C-856 and C-1030) collected during the
trials are reported in Table 2. Plants were cultivated in Romania, and seeds were provided to local
farmer (Ecoricinus—National association of Ricinus growers) by the Israelian company KAIIMA.

      Table 2. Primary data: Two castor hybrids. Pre-harvest data collection: Height of the plants, aerial
      biomass produced, and Harvest Index.

    Hybrid            Height of Plants         Husks              Seed              Straw Fresh Weight         Harvest Index
    Cultivar               [cm]               [Mg ha−1 ]        [Mg ha−1 ]              [Mg ha−1 ]                 [%]
                                                    d.w.             ssf.w.          f.w.           d.w.
     C-856                   74.4 c                 1.40             2.80 a         4.13 b          0.87 b          52.5 a
     C-1030                 112.8 a                 1.60             2.90 a         8.35 a          1.61 a          43.4 b
                 Note: Common letters within columns denote the absence of significant difference (p < 0.05).

     The dwarf hybrids tested were two of the various chosen by the association Ecoricinus to evaluate
their behavior and productivity in Romania. Although hybrid C-856 has already been analyzed in
productive and morphological terms by Alexopoulou et al. [6] in Greece and Italy, hybrid C-1030 has
never been described in the literature and in the present study, it has been analyzed only to assess its
productivity and the amount of epigeal biomass available for the LCA study.
     Despite the significant difference found in height, straw production, and the harvest index (HI)
between the two hybrids, in both cases, the aboveground biomass produced was lower than the
quantity produced by wild varieties commonly cultivated in Romania (data not shown). Therefore,
more suitable for mechanical harvesting. The farmer reported that fertilization and plowing took place
in 2018 between week 47 and 48, while harrowing and sowing occurred in week 23 and 24 2019 at the
depth of 8–10 cm with the sowing density of 3.6 seeds m−2 . Mature cow manure was applied at the
quantity of 6 Mg ha−1 and no irrigation was provided. No chemicals were used for both weed control
and desiccation of leaves.
     On the basis of farmer’s survey, two scenarios for each castor variety with a different mix of
by-products management were considered (Table 3).

       Table 3. Scenarios analyzed in the study for each castor variety (Sc1 = scenario 1; Sc2 = scenario 2).

 Harvesting Systems                                  Manual Harvesting                         Mechanical Harvesting
       Scenarios                               Sc1A                   Sc1B                   Sc2A                  Sc2B
                                Straw    Soil incorporation            Sale          Soil incorporation            Sale
     Products and               Husk              Sale                 Sale          Soil incorporation      Soil incorporation
      co-products          Press cake    Soil incorporation    Soil incorporation    Soil incorporation      Soil incorporation
                           Castor oil             Sale                 Sale                  Sale                  Sale

     In the case of manual harvesting (Sc1A and Sc1B), the castor fruit is harvested as whole, and the
separation of the spiny capsules from the seeds takes place on the farm. According to Parascanu (2017),
castor husk might be deemed as the best candidate for the combustion process due to its high heat
release [20]. Therefore, in the Sc1A and Sc1B scenarios, the sale of spiny capsules has been assumed at a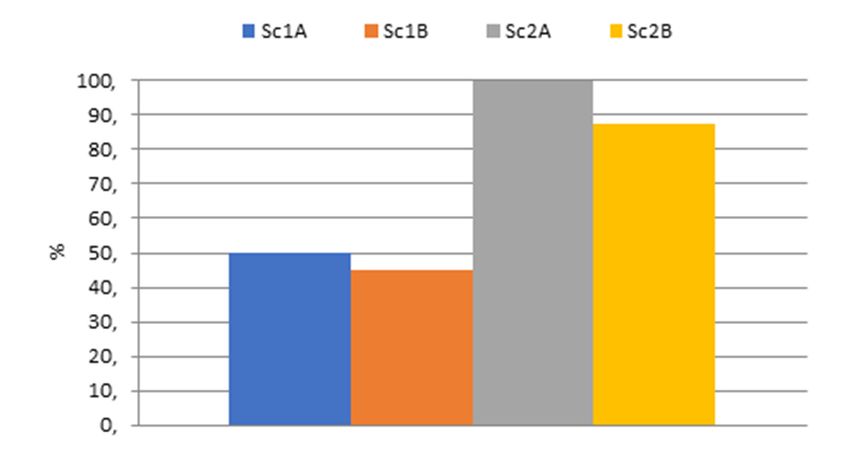
Sustainability 2020, 12, 6339                                                                        5 of 17

market price of crushed olive stones due to similar lower heating value (LHV) that results in 16.48 [20]
and16.50 MJ/kg [21], respectively.
     In the scenarios Sc2A and Sc2B involving castor mechanical harvesting, castor husk has always
been considered incorporated into the soil because it was discharged on the ground by the combine
harvester as residue and not collected. Castor straw is a residue with an LHV of 17.68 MJ/kg and an ash
content of 1.70 wt% [20]. For this reason, both manual and mechanical harvesting scenarios have been
considered, both sold as solid biofuel (Sc1B and Sc2B) and incorporated into the soil (Sc1A and Sc2A).
According to the farmer, press cake that resulted during the oil extraction phase is used as fertilizer
and for this reason was always considered incorporated into the soil. Castor oil is the main product in
the supply chain, and it has always been considered as sold.

2.3. Data Sampling and Measurements
     Pre-harvest tests were conducted directly in the field. Four plots of 1.5m x 2m each were randomly
selected within the two experimental fields in order to measure the growth of the plants and estimate
the aboveground biomass produced. In each plot, plants were counted and cut at the collect level,
then brought outside the field for height measurements as well as straw and capsules fresh weight
determination. The height of the plant was taken by measuring the distance between the collect and
the tip of the longest raceme. Samples of straw and the total capsules collected in each plot were
put in sealed bags and brought to the laboratory for dry weight determination. In the laboratory,
capsules were separated manually from the seeds. Thus, seeds were weighed for seed yield estimation.
Simultaneously, samples of straw and empty capsules (husks) were dried at constant temperature of
105 ◦ C in a ventilated oven until constant weight was reached (EN ISO 18134-2:2015). Then, the dry
matter and humidity content were calculated. All data were subjected to the analysis of variance
(ANOVA) to separate statistically different means (P < 0.05).

2.4. Life Cycle Assessment of Castor Oil Supply Chain
     An environmental impact analysis of castor oil production was carried out using the life cycle
assessment methodology (LCA) according to UNI EN ISO 14040: 2006 [22] and UNI EN ISO 14044:
2006 [23], by means an attributional approach [24–27], including the following statements: (a) Goal
definition and scoping: Defining the goals of the study, the functional units, the boundaries of the
system, and the required data; (b) life cycle inventory: data collection; (c) life cycle impact assessment:
Estimation of the potential environmental impacts; (d) life cycle interpretation and improvement:
Final step where the risks are evaluated and checked to draw conclusions.

2.4.1. Goal Definition and Scoping
     The considered system is defined by all the agricultural processes that occurred during the Ricinus
communis growing phase and subsequent oil extraction phase carried out at farm level.
     The boundary of the system (Figure 3) is given by the life cycle stages of castor to be included in
the LCA. Cultivation phases and extraction phase of oil were studied from cradle-to-farm gate.
     The functional unit represents the reference unit used to quantify all inputs and outputs from the
boundaries of the system. It is defined as 1 Mg of castor oil produced by the farm.
     Firstly, the environmental impact of each single hybrid cultivar was separately analyzed for each
scenario; then, each scenario was assessed to identify the best hybrid cultivar.
     Allocation describes how environmental impacts are shared between the main product and
co-products along the supply chain [28]. Castor oil is the main product, while crop residues (castor
husks and straw) and press cakes are considered co-products [9]. In an LCA study, the co-product
handling is a crucial issue because it could impact on the final results [29]. Agricultural products are
particularly sensitive to allocation methods because of the different share that their co-products can
have. In our case, an economic allocation method that takes into account market prices and mass of
product and by-products per each scenario was used [30] (Table 4). Castor market prices are not easy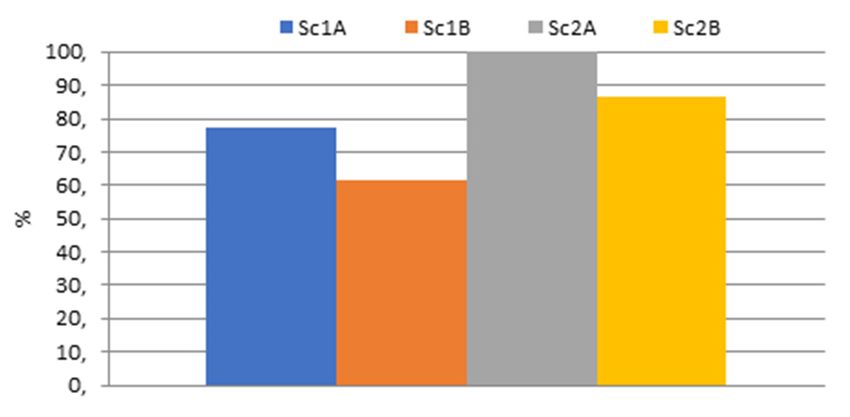
Sustainability 2020, 12, 6339                                                                        6 of 17

to be find, especially for castor co-products that do not have a market. For this reason, the selling
price of castor seed was considered to be 600 euros per Mg, while the price of castor oil for cosmetic
purposes was 30 euros per liter according to informal local market. As described above, in the absence
of a market, husk and straw prices for energy purposes have been assimilated to solid biomass with
Sustainability 2020, 12, x FOR
similar characteristics        PEERstones
                             (olive REVIEW                                                          6 of 16
                                          and wheat straw) used for energy purposes and with known market
prices. In fact, following information from the informal local market as happen in other studies [31],
market prices. In fact, following information from the informal local market as happen in other
the price of husks for energy purposes was 180 euros per Mg, while the price of straw was considered
studies [31], the price of husks for energy purposes was 180 euros per Mg, while the price of straw
55 euros per Mg. The prices used are those indicated by the Ricinum producers National Association of
was considered 55 euros per Mg. The prices used are those indicated by the Ricinum producers
Romania (Ecoricinus Productie Comert Srl, Cluj-Napoca, 10, Fanatelor st. jud, Cluj, Romania). Even if
National Association of Romania (Ecoricinus Productie Comert Srl, Cluj-Napoca, 10, Fanatelor st. jud,
the press cake corresponds to an important amount of biomass, due to its returns to the soil as fertilizer
Cluj, Romania). Even if the press cake corresponds to an important amount of biomass, due to its
internally at the farm, according to the economic allocation type used and due to an absence of a
returns to the soil as fertilizer internally at the farm, according to the economic allocation type used
market and a market price, the impact generated by the press cake was assumed to be very low (0.07%)
and due to an absence of a market and a market price, the impact generated by the press cake was
with a minimum price of 0.1 € per Mg of by-product.
assumed to be very low (0.07%) with a minimum price of 0.1 € per Mg of by-product.

                                                Figure 3.
                                                Figure    System boundary.
                                                       3. System boundary.

                                Table 4. Economic allocation factors for each castor variety.

                                    Phases          Product and by-Products    Cultivar Hybrids
                                                                                C-856    C-1030
                                                           Husks with seed     97.50%    95.84%
                            Agricultural phases
                                                               Straw            2.50%     4.16%
                                                   Total                      100.00% 100.00%
                                                             Castor seed      86.96%     85.80%
                                  Dehulling
                                                               Husks          13.04%     14.20%
                                                   Total                      100.00% 100.00%
                            Oil extraction phase              Castor oil      99.93%     99.93%
Sustainability 2020, 12, 6339 7 of 17
Table 4. Economic allocation factors for each castor variety.
Phases Product and by-Products Cultivar Hybrids
C-856 C-1030
Husks with seed 97.50% 95.84%
Agricultural phases
Straw 2.50% 4.16%
Total 100.00% 100.00%
Castor seed 86.96% 85.80%
Dehulling
Husks 13.04% 14.20%
Total 100.00% 100.00%
Oil extraction phase Castor oil 99.93% 99.93%
Press cake 0.07% 0.07%
Total 100.00% 100.00%
Source: CREA elaboration.
2.4.2. Life Cycle Inventory Analysis
Data resulting from a survey carried out by field technicians were utilized for the life cycle
inventory analysis. The Simapro code database 8.0.2 (Prè Consultants, Amersfoort, The Netherlands)
was used for data not identifiable by survey.
The primary data were relative to the technical characteristics of the tractors and agricultural
equipment utilized and diesel consumption (Table 5). Regarding the hypothesis of mechanical
harvesting, all data for the costs, performance, and specifications of a conventional combine harvester
were derived from personal communication and literature. Moreover, the primary data were relative
to different castor varieties.
Table 5. Technical characteristics of the machineries, diesel consumption, and agricultural phases.
Manual Manual Manual Mech Oil
Agricultural Operation Plough. Harr. Sow. Dehull.
Fert. Hoeing Harv.* Harv.** Extrac.
Machinery
Machinery
- 78 78 78 - - 146 7.7 3
power (kW)
Machinery weight (kg) - 3750 3750 3750 - - 10700 250 1900
Fuel consumption
- 45 15 5 - - 25 5.1 -
(l ha−1 )
Lubrificant consumption
0.10 0.07 0.03 - - 0.05 0.18 -
(l ha−1 )
Lifetime
- 12,000 12,000 12,000 - - 3000 2000 -
(h ha−1 )
Moldboard Row
Instrument used (type) Shovel Rolmako - - - - -
plow planter
Instrument power (kW) 66 63 44 - - - - -
Weight instruments (kg) 1.5 795 2860 830 - - - - -
Lifetime
4000 2000 2000 1500 - - - - -
(h)
Product utilized (type) Manure - - Seeds - - - - -
Quantity
6000 - - 15 - - - - -
(kg ha−1 )
Source: CREA elaboration on survey data. *Scenario 1. ** Scenario 2.Sustainability 2020, 12, 6339 8 of 17
The secondary data referred to the emission generated by the machines during different agricultural
phases and from fertilizers.
Emissions in air, soil, and underground water (leaching) due to manure storage, as well as
by-products and manure incorporation into the soil per each scenario, were calculated using the model
proposed by [32] and values of the references reported in Table 6.
Table 6. Secondary data: Source of the emissions considered in the study for storage and soil
incorporation of the manure, and by-products (press cake, straw, and husk according to the
scenario—Table 2).
Emissions Source
Manure storage emissions
Emissions of methane (CH4 ) and nitrous oxide (N2 O) [33–35]
Ammonia (NH3 ) emissions due to manure storage [35,36]
Nitrogen oxides (NOx) emissions [37], using the factor by [34]
Emissions related to soil incorporation different combinations of by-products
CO2 emissions [6,38]
N2 O emissions [32]
Emissions due to soil incorporation of manure
N2 O, NH3 , NOx and nitrate leaching [32]
Emission factor of Potassium, Copper and Zinc [36]
The exhaust gases emissions from agricultural tractors and combine harvester were calculated
using the standard emission factors for diesel engines reported by Directive 2004/26/EC for carbon-
nitrogen oxides (g NOx ha−1 ), hydrocarbons (g HC ha−1 ), monoxide (g CO ha−1 ), and particulate
matter (g PM ha−1 ), according to the method reported by [39]. The amount of released carbon dioxide
(kg CO2 ha−1 ) was calculated by multiplying the fuel consumption (kg ha−1 ) by an air emission factor
of 2.6 (kg CO2 emitted per kg of diesel fuel consumed), according to [40,41].
2.4.3. Land Use Change (LUC)
The direct and indirect land use change (LUC) associated with crop production can produce
changes in the carbon from soil and vegetation [42]. Castor oil can be in the form of herbaceous or
arborescent plant, annual or perennial, depending on the climatic conditions of the region. In the
present study, castor oil is cultivated as annual oil crop in cropland that had not undergone any land-use
conversion for a period of more than 20 years [34]. Following the indications of the Intergovernmental
Panel on Climate [34] there is no net accumulation of biomass carbon stocks for annual crops. On the
other hand, emission from soil carbon mineralization per each scenario has been taken into consideration
because there are changes in the management activities on croplands, and in particular, in the amount
of biomass that has been considered incorporated into the soil according to the different scenario
considered (Table 2). Even if the soil’s organic carbon was considered in the steady state, and the farm
analyzed employed crop rotations, different crop residue management considered in the study and
the amount of GHG emitted during the different scenario were calculated according to the following
formula:
3
X
GHGres = Resi × Cresi × Cmini × awCO2 (1)
i=1
where
GHGres = Greenhouse gases emissions from soil incorporation of residue “i” per scenario (Mg CO2 ha−1 )
Resi = Amount of residue “i” incorporated into the soil (Mg ha−1 )
Cresi = Organic carbon content in the residues “i” (%) [6]Sustainability 2020, 12, 6339 9 of 17
Cmini = Organic carsbon in the residues “i” mineralized in soil (%) [38]
awCO2 = atomic weight of carbon dioxide equal to 44/12
2.4.4. Life Cycle Impact Assessment
The environmental impact of 1 Mg of castor oil was based on GHG emissions. The carbon
footprint was defined as the sum of all GHGs emitted within the system boundary and expressed in
CO2 equivalent applying the IPCC 2007 method (100-year life span).
A parallel economic assessment is integrated with LCA also using a life cycle perspective that
covers all activities in the supply chain up to the farm gate. The economic sustainability is critical
because when it comes to assessing the different products and by-products management, the attention
of farmers does not fall solely on environmental impacts, but also (and mainly) on economic aspects.
For this reason, an economic assessment was carried out.
2.5. Economic Assessment
The study followed the steps in LCA identified in the relevant international standard [22,23] with
the corresponding steps in life cycle costing (LCC) introduced in parallel. Life cycle costing (LCC)
is a methodology that. aimed to assess the costs across the entire life cycle of a product, process,
or service [43] concentrating on the economic cost at each stage [44]. A conventional cradle-to-gate
LCC was applied here and includes the assessment of all costs associated with the life cycle of the
castor-oil cultivation specific to each scenario. In particular, the LCC assessment is focused on internal
costs (value of goods and services consumed, including raw materials, services, other operating
expenses, and labor costs). It is important to underline that the contractors provide all phases of
the preparation of the field up to sowing (bottom fertilization, ploughing, harrowing, and sowing).
Everything afterwards (weed control and harvesting) is performed by the owners of the field for Sc1A
and Sc1B. In Sc2A and Sc2B, all agricultural phases are in subcontractor account. Later, to evaluate
the gross margin of farm, the revenues for each product (multiplying between prices and quantity of
products) are calculated. Gross margin refers to the difference between revenue from crop sales and
the variable costs related to the agricultural activities [44] and it is a profitability indicator of a farm.
All data (Table 7) come from the budget (year 2018) of the farm studied.
Table 7. Economic data expressed in €/ha per year.
Cultivar Hybrids
Costs (€/Year) C-856 C-1030
Manual fertilization 200.00 200.00
Ploughing 120.00 120.00
Harrowing 60.00 60.00
Sowing 60.00 60.00
Manual hoeing 375.00 375.00
Manual harvesting 625.00 625.00
Mechanical harvesting 180.00 180.00
Dehulling 150.00 150.00
Oil extraction 390.00 390.00
Revenues (€/year)
Straw for sales 49.5 88.00
Husks for sales 255.00 288.00
Castor oil for sales 26,206.32 27,142.26
Source: CREA elaboration.Sustainability 2020, 12, 6339 10 of 17
3. Results and Discussions
According to the literature, castor yield can change appreciably with genotype [45]. Arnaud
(1990) observed a seed yield from 2000 to 2620 kg ha−1 in France [46], while Anastasi (2015) reported
a yield between 1790 to 4750 kg ha−1 in Italy [47]. In the present research, the genotypes of castor
grown showed similar productions of 2800 and 2900 kg ha−1 for C-856 and C-1030, respectively.
However, the C-1030 hybrid, which is higher than C-856 and has a significantly higher HI (Table 2),
produced 85% more straw than C-856, with the same inputs used.
Alexopoulou et al. [6], from the comparison of various castor hybrids planted in Greece and Italy,
found an average amount of stems and leaves of 1.08 Mgdm ha−1 , and the hybrid C-856, that resulted as
133 cm tall (79% taller than in our study) in Greece (Aliartos area, Greece in 2014), allowed for obtaining
1.13 Mgdm ha−1 of stems and leaves against 0.87 Mg ha−1 obtained in the present study. In the same
study, the C-856 hybrid produced a straw quantity of 0.585 Mg ha−1 , much more similar to that obtained
in this study in 2012 in Greece (Aliartos area, Greece in 2014) [6]. In general, Alexopoulou et al. [6]
highlighted that C-856 resulted as the best-performing hybrid in Italy while in Greece, its yields were
quite low, probably related to the high percentage of immature racemes (60%) at harvest. This suggests
the influence of the climate and crop management on the phenotype expression of this hybrid. To the
best of our knowledge, there is no information in the literature about the C-1030 hybrid.
The type of harvesting represents a critical phase that can also have a significant influence on the
amount of product that can be collected per unit area. Mechanized harvesting allows for collecting
about 3 t/h of castor oil seeds (considering a harvesting rate between 0.75 and 1.5 hectares per hour)
ready to be pressed. On the other hand, according to farmers, manual harvesting shows extremely low
lossesN2O emissions [58]. The different by-product management also influenced the indirect emissions of
GHG due to their degradations during soil incorporation.
In the case of castor oil produced by both C-856 and C-1030 cultivar hybrids, as expected, the
manual harvesting resulted as more sustainable (Sc1A and Sc1B), and Sc1B scenario was always the
least impactful,
Sustainability followed
2020, 12, 6339 by scenarios 1A and 2B (Figures 4 and 5). 11 of 17
Sustainability 2020, 12, x FOR PEER REVIEW 11 of 16
Figure 4. Carbon footprint of 1 Mg of castor oil hybrid C-856 for each scenario ((Sc1 = scenario 1; Sc2 = scenario 2).
Figure 4. Carbon footprint of 1 Mg of castor oil hybrid C-856 for each scenario ((Sc1 = scenario 1; Sc2
= scenario 2).
Figure 5. Carbon footprint of 1 Mg of castor oil hybrid C-1030 for each scenario (Sc1 = scenario 1; Sc2 = scenario 2).
Figure 5. Carbon footprint of 1 Mg of castor oil hybrid C-1030 for each scenario (Sc1 = scenario 1; Sc2
= scenario 2).among cultivar hybrids and all scenarios, Sc2A_C-1030 is more impactful than the
Moreover,
other treatments analyzed, while the Sc1B_C-856 is less burdensome than others. These results were
due toMoreover, among
both different cultivar hybrids
combinations and allby-products
of on-farm scenarios, Sc2A_C-1030
(castor press cake is more impactful than
incorporation the
into the
other treatments analyzed, while the Sc1B_C-856 is less burdensome than others.
soil in case of 1B_C-856, and castor press cake, straw and husks incorporation into the soil in case of These results were
due to both and
2A_C-1030) different
yieldscombinations
(2.8 Mg per ha ofin
on-farm
case of by-products
C-856 vs. 2.9(castor
Mg perpress ha incake
case incorporation into the
of C-1030). In general,
soil in case of 1B_C-856, and castor press cake, straw and husks incorporation
the incorporation of by-products in the soil at farm level has resulted in higher GHG emissions into the soil in case
than of
2A_C-1030) and yields (2.8 Mg per ha in case of C-856 vs. 2.9 Mg per ha in case
their sale. For this reason, the highest impact observed in the mechanized harvesting treatments (Sc2A of C-1030). In general,
the incorporation
and Sc2B) is largelyofdueby-products in the soil at
to the non-collection offarm
huskslevel
thathas
are resulted
left in theinfield
higher GHG
by the emissions
combine than
and then
their sale. For this reason, the highest impact observed in the mechanized
buried (unlike manual harvesting where husks are separated from the seeds on the farm and then sold harvesting treatments
(Sc2A
as solidand Sc2B)
fuel). is largely
Obviously, thedue to the
study non-collection
focused of husks
on the impacts thattoare
related theleft in the field
production by theoil
of castor combine
on the
and then
farm, buried (unlike
not considering the manual harvesting
whole process where husks
downstream of theare separated
supply fromthe
chain and therelated
seeds impacts
on the farm
that
and then
could sold as solid
completely reversefuel).
theObviously, the study focused on the impacts related to the production of
results obtained.
castor oillife
The on cycle
the farm, not considering
of scenario 1B, in which themanual
whole process
harvestingdownstream
was assumed of the supply
(less chain and
burdensome the
in the
related impacts that could completely reverse the results obtained.
case of hybrid C-856, slightly less productive, and with less press cake), and with the incorporation of
The lifecake
the pressed cycle of scenario
alone and the 1B,
saleinofwhich manual
the other harvesting
by-products, was assumed
resulted (less burdensome
in the emission of 8.14 Mg CO in the
2 eq
caseMg
per of hybrid
of castor C-856, slightly
oil (8.14 kg CO less productive, and with less press cake), and with the incorporation
2 eq per kg of castor oil extracted). On the other hand, the life cycle of
of the pressed
scenario cake alone
2A_C-1030, in whichandmechanized
the sale of the other by-products,
harvesting with combine resulted in theand
harvesters emission of 8.14 Mg
the incorporation
CO 2eq per Mg of castor oil (8.14 kg CO2eq per kg of castor oil extracted). On the other hand, the life
of straw, husks, and press cakes was assumed, resulted in the emission of 18.9 Mg CO2 eq per Mg of
cycle of
castor oil scenario
produced2A_C-1030,
(18.9 kg COin which mechanized harvesting with combine harvesters and the
2 eq per kg of castor oil extracted).
incorporation of straw, husks, and press cakes was assumed, resulted in the emission of 18.9 Mg
CO2eq per Mg of castor oil produced (18.9 kg CO2eq per kg of castor oil extracted).
Although, in Sc1A and Sc1B scenarios, there is the de-hulling phase that there is not in Sc2A and
Sc2B, this has a very small impact alwaysSustainability 2020, 12, 6339 12 of 17
Although, in Sc1A and Sc1B scenarios, there is the de-hulling phase that there is not in Sc2A
and Sc2B, this has a very small impact alwaysSustainability 2020, 12, 6339 13 of 17
Table 9 shows that the 2B_C-1030 scenario had higher gross margin than other scenarios; while the
1A_C-856 scenario had the lowest gross margin.
Table 9. Gross margin and carbon footprint for each scenario, expressed in €/FU (1 Mg of castor
oil)—(Sc1 = scenario 1; Sc2 = scenario 2).
Cultivar Hybrid: C-856 Cultivar Hybrid: C-1030
Scenarios Scenarios
Unit Manual Mechanical Manual Mechanical
Sc1A Sc1B Sc2A Sc2B Sc1A Sc1B Sc2A Sc2B
Gross Margin (€/FU) 30,533 30,537 30,671 30,675 30,564 30,572 30,688 30,695
GWP (kg CO2 eq/FU) 9070 8140 18,100 15,800 14,600 11,600 18,900 16,300
Gross Margin/GWP ratio (%) 3.37 3.75 1.69 1.94 2.09 2.63 1.62 1.88
Source: CREA elaboration on both budget data (year 2018) and environmental findings.
In addition, the ratio between gross margin and GWP emissions was applied to calculate the
economic performance (gross margin) per unit of environmental burden (Table 9). The ratio is based on
data from both environmental and economic accounting systems. The higher the ratio value, the higher
the economic performance per unit of GWP emitted.
Findings showed that scenario 1B in the case of C-856 cultivar hybrid had a better ratio between
economic performance and GHG emitted into the atmosphere (€3.75 per kg CO2 eq); while the
2A_C-1030 scenario showed the worst ratio between economic and environmental performances
(€1.62 per kg CO2 -eq) confirming the environmental results. These results were due to different
combinations of on-farm by-products (see Table 3), different revenues (see Table 8), and yields
(see Table 2).
4. Conclusions
There has been a critical increment in interest for sustainable and biodegradable items so as to
diminish reliance on petrochemicals. This is one of the essential elements which is driving the growth
of the worldwide castor oil market. The research focused on the evaluation of the environmental and
economic sustainability of two different castor hybrids (C-856 and C-1030) comparing manual and
mechanical harvesting methods, and by-product management.
Comparing all the proposed scenarios, the cultivation of the manually harvested castor hybrid
C-856 and the by-product management that involved only the soil incorporation of press cake obtained
by the oil extraction resulted as the most sustainable. On the other hand, the mechanized harvesting of
hybrid C-1030, which involved the incorporation of all the by-products of the cultivation of castor
and production of castor oil (husk, straw, and press cake) showed the highest CO2 emissions per Mg
of castor oil (+132%). It is therefore clear how, with the same inputs used, the castor-oil cultivation
method affects the management of by-products and how, while residues are a source of organic matter
for the soil, they cause greenhouse gas emissions during the degradation process in the soil.
From an economic point of view, a difference in Gross Margin (€/Mg) between the hybrids used
was only evident when comparing the scenarios in which mechanized harvesting was used, i.e.,
C-856_Sc2A vs. C-1030_Sc2A and C-856_Sc2B vs. C-1030_Sc2B, resulting in an increase in Gross
Margin of 6 and 7%, respectively, using the hybrid C-1030. The two hybrids when harvested manually
did not show appreciable increases in Gross Margin (0.1%). In general, the scenario that produced
most Gross Margin was the C-1030_Sc2B where mechanized harvesting of the plants, the incorporation
of husk and press cake, and the sale of castor oil and straw were carried out.
In the end, to determine the most economically and environmentally convenient scenario, the ratio
between gross margin and GWP emissions was applied to calculate the economic performance (gross
margin) per unit of environmental burden. Findings showed that scenario Sc1B in the case of C-856
cultivar hybrid had a better ratio between economic performance and GHG emitted into the atmosphereSustainability 2020, 12, 6339 14 of 17
(€3.75 per kg CO2 eq); while the Sc2A_C-1030 scenario showed the worst ratio between economic and
environmental performances (€1.62 per kg CO2 eq) confirming the environmental results.
Although Sc1B represents a good economic–environmental compromise, including manual
harvesting, it clashes both with the need to innovate the castor production chain, and with the costs
and availability of labor that may vary over time, affecting the sustainability of the chain, costs,
and market prices.
Furthermore, an important aspect that was not considered in the study is the loss of product during
harvesting. This is particularly relevant in the case of very high losses that are reflected in the impacts
per unit of product. With the implementation of well-functioning mechanized castor harvesting
systems, the resulting seed losses will also necessarily have to be considered in future studies.
Moreover, it is important to highlight that the study did not consider the whole process downstream
of the castor oil extraction and the related impacts that could completely reverse the results obtained,
which should be investigated in future researches.
Ultimately, the lack of official economic data on the market prices of products and by-products,
and the difficulty of finding the costs resulting from the various cultivation practices, within the castor
production chain, as old as it is, currently undergoing improvement and remodernization, represents a
limit to obtaining exhaustive answers on its economic sustainability. For this reason, this research does
not have the presumption to provide a definitive answer to the questions related to the environmental
and economic sustainability of the castor-oil production chain, which will need further study and
analysis as the production methods are refined.
Author Contributions: Conceptualization and methodology, A.S., N.P., L.P.; investigation and data curation
N.P., A.S., W.S., F.L.; writing—original draft preparation N.P., W.S., F.L., A.S.; writing—review and editing, A.S.;
supervision, L.P. and A.S.; funding acquisition, L.P. All authors have read and agreed to the published version of
the manuscript.
Funding: This research was funded by European Union’s Horizon 2020 Magic—Marginal lands for Growing
Industrial Crops: Turning a burden into an opportunity project grant number 727698 (http://https://magic-h2020.eu).
The funders had no role in the design of the study; in the collection, analyses, or interpretation of data; in the
writing of the manuscript, or in the decision to publish the results.
Acknowledgments: Authors thank the ricinum producers National Association of Romania (Ecoricinus Productie
Comert Srl, Cluj-Napoca, 10, Fanatelor st. jud, Cluj, Romania) and his team for their valid support and assistance
provided during the activities, the field data and data for the economic analysis, as well as Sandu Lazar for his
valuable contribution in the field activities.
Conflicts of Interest: The authors declare no conflict of interest.
References
1. FAO (Food and Agriculture Organization). Global agriculture towards 2050. In Proceedings of the High
Level Expert Forum—How to Feed the World, Rome, Italy, 12–13 October 2009; Volume 2050, pp. 1–4.
2. IEA (International Energy Agency). World Energy Outlook—Executive Summary; IEA: Paris, France, 2018;
Volume 11.
3. ICCT (Internationa Council on Clean Transportation). The European Commission’s Renewable Energy Proposal
for 2030; ICCT: Berlin, Germany, 2017; Volume 8.
4. Zafeiriou, E.; Karelakis, C. Income volatility of energy crops: The case of rapeseed. J. Clean. Prod. 2016, 122,
113–120. [CrossRef]
5. Makanju, A.; Bello, E.I. Production, characterization and evaluation of castor oil biodiesel as alternative fuel
for diesel engines. J. Emerg. Trends Eng. Appl. Sci. 2011, 2, 525–530.
6. Alexopoulou, E.; Papatheohari, Y.; Zanetti, F.; Tsiotas, K.; Papamichael, I.; Christou, M.; Namatov, I.; Monti, A.
Comparative studies on several castor (Ricinus communis L.) hybrids: Growth, yields, seed oil and biomass
characterization. Ind. Crops Prod. 2015, 75, 8–13. [CrossRef]
7. Murphy, C.B. Compound Annual Growth Rate—CAGR. Available online: https://www.investopedia.com/
terms/c/cagr.asp (accessed on 22 June 2020).Sustainability 2020, 12, 6339 15 of 17
8. Ghosal, S. Castor Oil Prices Spike 23% in Global Market. Available online: https://economictimes.indiatimes.
com/markets/commodities/news/castor-oil-prices-spike-23-in-global-market/articleshow/69089709.cms
(accessed on 22 June 2020).
9. Bateni, H.; Karimi, K.; Zamani, A.; Benakashani, F. Castor plant for biodiesel, biogas, and ethanol production
with a biorefinery processing perspective. Appl. Energy 2014, 136, 14–22. [CrossRef]
10. Mensah, M.B.; Awudza, J.A.M.; O’Brien, P. Castor oil: A suitable green source of capping agent for
nanoparticle syntheses and facile surface functionalization. R. Soc. Open Sci. 2018, 5, 180824. [CrossRef]
11. Huang, H.; Yu, N.; Wang, L.; Gupta, D.K.; He, Z.; Wang, K.; Zhu, Z.; Yan, X.; Li, T.; Yang, X.
The phytoremediation potential of bioenergy crop Ricinus communis for DDTs and cadmium co-contaminated
soil. Bioresour. Technol. 2011, 102, 11034–11038. [CrossRef]
12. Rajkumar, M.; Freitas, H. Influence of metal resistant-plant growth-promoting bacteria on the growth of
Ricinus communis in soil contaminated with heavy metals. Chemosphere 2008, 71, 834–842. [CrossRef]
13. Pandey, V.C. Suitability of Ricinus communis L. cultivation for phytoremediation of fly ash disposal sites.
Ecol. Eng. 2013, 57, 336–341. [CrossRef]
14. Helling, R.K.; Russell, D.A. Use of life cycle assessment to characterize the environmental impacts of polyol
production options. Green Chem. 2009, 11, 380–389. [CrossRef]
15. Amouri, M.; Mohellebi, F.; Zaïd, T.A.; Aziza, M. Sustainability assessment of Ricinus communis biodiesel
using LCA approach. Clean Technol. Environ. Policy 2017, 19, 749–760. [CrossRef]
16. Parascanu, M.M.; Puig-Gamero, M.; Soreanu, G.; Valverde, J.L.; Sanchez-Silva, L. Comparison of three
Mexican biomasses valorization through combustion and gasification: Environmental and economic analysis.
Energy 2019, 189, 116095. [CrossRef]
17. Liang, S.; Xu, M.; Zhang, T. Life cycle assessment of biodiesel production in China. Bioresour. Technol. 2013,
129, 72–77. [CrossRef] [PubMed]
18. Adewale, C.; Reganold, J.P.; Higgins, S.; Evans, R.D.; Carpenter-Boggs, L. Agricultural carbon footprint is
farm specific: Case study of two organic farms. J. Clean. Prod. 2019, 229, 795–805. [CrossRef]
19. Mittal, J.P.; Dhawan, K.C.; Thyagraj, C.R. Energy scenario of castor crop under dryland agriculture of Andhra
Pradesh. Energy Convers. Manag. 1991, 32, 425–430. [CrossRef]
20. Parascanu, M.M.; Sandoval-Salas, F.; Soreanu, G.; Valverde, J.L.; Sanchez-Silva, L. Valorization of Mexican
biomasses through pyrolysis, combustion and gasification processes. Renew. Sustain. Energy Rev. 2017, 71,
509–522. [CrossRef]
21. Perea-Moreno, M.-A.; Manzano-Agugliaro, F.; Hernandez-Escobedo, Q.; Perea-Moreno, A.-J. Peanut shell for
energy: Properties and its potential to respect the environment. Sustainability 2018, 10, 3254. [CrossRef]
22. ISO (International Organization for Standardization). Environmental Management—Life Cycle
Assessment—Principles and Framework; ISO 14040:2006; ISO: Geneva, Switzerland, 2006.
23. ISO (International Organization for Standardization). Environmental Management—Life Cycle
Assessment—Requirements and Guidelines; ISO 14044:2006; ISO: Geneva, Switzerland, 2006.
24. Palmieri, N.; Forleo, M.B.; Giannoccaro, G.; Suardi, A.; Pari, L. Environmental and economic performance
of cereal straw end-practices. In Proceedings of the 25th European Biomass Conference and Exhibition,
Stockholm, Sweden, 12–15 June 2017; Volume 2017.
25. Ekvall, T.; Azapagic, A.; Finnveden, G.; Rydberg, T.; Weidema, B.P.; Zamagni, A. Attributional and
consequential LCA in the ILCD handbook. Int. J. Life Cycle Assess. 2016, 21, 293–296. [CrossRef]
26. Finnveden, G.; Hauschild, M.Z.; Ekvall, T.; Guinée, J.; Heijungs, R.; Hellweg, S.; Koehler, A.; Pennington, D.;
Suh, S. Recent developments in Life Cycle Assessment. J. Environ. Manag. 2009, 91, 1–21. [CrossRef]
27. McManus, M.C.; Taylor, C.M. The changing nature of life cycle assessment. Biomass Bioenergy 2015, 82, 13–26.
[CrossRef]
28. De Boer, I.J.M. Environmental impact assessment of conventional and organic milk production. Livest. Prod.
Sci. 2003, 80, 69–77. [CrossRef]
29. Notarnicola, B.; Salomone, R.; Petti, L.; Renzulli, P.A.; Roma, R.; Cerutti, A.K. Life Cycle Assessment in the
Agri-Food Sector: Case Studies, Methodological Issues and Best Practices; Springer: Berlin/Heidelberg, Germany,
2015; ISBN 3319119400.
30. Chen, C.; Habert, G.; Bouzidi, Y.; Jullien, A.; Ventura, A. LCA allocation procedure used as an incitative
method for waste recycling: An application to mineral additions in concrete. Resour. Conserv. Recycl. 2010,
54, 1231–1240. [CrossRef]Sustainability 2020, 12, 6339 16 of 17
31. Vásquez Lavin, F.; Barrientos, M.; Castillo, Á.; Herrera, I.; Ponce Oliva, R.D. Firewood certification programs:
Key attributes and policy implications. Energy Policy 2020, 137, 111160. [CrossRef]
32. Brentrup, F.; Kusters, J.; Lammel, J.; Kuhlmann, H. Methods to estimate on-field nitrogen emissions from
crop production as an input to LCA studies in the agricultural sector. Int. J. Life Cycle Assess. 2000, 5, 349–357.
[CrossRef]
33. Dalla Riva, A.; Kristensen, T.; De Marchi, M.; Kargo, M.; Jensen, J.; Cassandro, M. Carbon footprint from
dairy farming system: Comparison between Holstein and Jersey cattle in Italian circumstances. Acta Agrar.
Kvár. 2014, 18, 75–80.
34. Eggleston, H.S.; Buendia, L.; Miwa, K.; Ngara, T.; Tanabe, K. IPCC Guidelines for National Greenhouse Gas
Inventories; Agriculture, Forestry and Other Land Use; IPCC: Hayama, Japan, 2006; Volume 4.
35. ISPRA (Istituto Superiore per la Protezione e la Ricerca Ambientale). Agricoltura—Inventario Nazionale delle
Emissioni e Disaggregazione Provinciale (Agriculture—National Emission Inventory and Provincial Breakdown);
Report 85/2008; ISPRA: Rome, Italy, 2008; ISBN 9788844805012.
36. Falconi, F.; Neri, P.; Borsari, A.; Bombardieri, R.; Di Stefano, M.; Brambilla, C.; Querzola, F. Analisi Ambientale
del Ciclo di Vita della Produzione di Latte da Allevamento Biologico e Confronto con la Convenzionale.
In ENEA e UTS Protezione e Sviluppo dell’Ambiente e del Territorio; ENEA: Rome, Italy, 2005.
37. Battini, F.; Agostini, A.; Tabaglio, V.; Amaducci, S. Environmental impacts of different dairy farming systems
in the Po Valley. J. Clean. Prod. 2016, 112, 91–102. [CrossRef]
38. Ruíz-Valdiviezo, V.M.; Mendoza-Urbina, L.D.; Luna-Guido, M.; Gutiérrez-Miceli, F.A.;
Cárdenas-Aquino, M.R.; Montes-Molina, J.A.; Dendooven, L. Emission of CO2 , CH4 and N2 O
and dynamics of mineral N in soils amended with castor bean (Ricinus communis L.) and piñón (Jatropha
curcas L.) seed cake. Plant Soil Environ. 2013, 59, 51–56.
39. Forleo, M.B.; Palmieri, N.; Suardi, A.; Coaloa, D.; Pari, L. The eco-efficiency of rapeseed and sunflower
cultivation in Italy. Joining environmental and economic assessment. J. Clean. Prod. 2017, 172, 3138–3153.
[CrossRef]
40. Lal, R.; Stewart, B.A. Soil-Specific Farming: Precision Agriculture; Advances in Soil Science; CRC Press: Boca
Raton, FL, USA, 2015; ISBN 9781482245349.
41. Grace, P.R.; Harrington, L.; Jain, M.; Robertson, G.P. Long-Term sustainability of the tropical and subtropical
rice-wheat system: An environmental perspective. Improv. Product. Sustain. Rice Wheat Syst. Issues Impacts
2003, 65, 27–43.
42. Iriarte, A.; Rieradevall, J.; Gabarrell, X. Life cycle assessment of sunflower and rapeseed as energy crops
under Chilean conditions. J. Clean. Prod. 2010, 18, 336–345. [CrossRef]
43. Rigamonti, L.; Borghi, G.; Martignon, G.; Grosso, M. Life cycle costing of energy recovery from solid
recovered fuel produced in MBT plants in Italy. Waste Manag. 2019, 99, 154–162. [CrossRef]
44. Brandão, M.; Clift, R.; Milà, L.C.; Basson, L. A life-cycle approach to characterising environmental and
economic impacts of multifunctional land-use systems: An integrated assessment in the UK. Sustainability
2010, 2, 3747–3776. [CrossRef]
45. Koutroubas, S.D.; Papakosta, D.K.; Doitsinis, A. Adaptation and yielding ability of castor plant (Ricinus
communis L.) genotypes in a Mediterranean climate. Eur. J. Agron. 1999, 11, 227–237. [CrossRef]
46. Arnaud, F. The development of castor-oil crops in France. In Il Ricino: Obiettivi, Strategie e Ricerca. Agricoltura
Ricerca; Ministero Agricoltura e Foreste Roma: Rome, Italy, 1990.
47. Anastasi, U.; Sortino, O.; Cosentino, S.L.; Patanè, C. Seed yield and oil quality of perennial castor bean in a
Mediterranean environment. Int. J. Plant Prod. 2015, 9, 99–116.
48. Pari, L.; Latterini, F.; Stefanoni, W. Herbaceous Oil crops, a review on mechanical harvesting state of the art.
Agriculture 2020, 10, 309. [CrossRef]
49. Zhao, H.; Zhang, C. Analysis on the research status and structure characteristics of castor harvester.
In Proceedings of the 2019 IEEE International Conference on Mechatronics and Automation (ICMA), Tianjin,
China, 4–7 August 2019; pp. 415–420.
50. Palmieri, N.; Forleo, M.B.; Giannoccaro, G.; Suardi, A. Environmental impact of cereal straw management:
An on-farm assessment. J. Clean. Prod. 2017, 142, 2950–2964. [CrossRef]
51. Pari, L.; Palmieri, N.; Forleo, M.B.; Suardi, A.; Coaloa, D.; Friuli, V.G. Lca of oilseed rape production for energy
purposes: Sensitivity analysis. In Proceedings of the 20th European Biomass Conference and Exhibition,
Milan, Italy, 18–22 June 2012.Sustainability 2020, 12, 6339 17 of 17
52. Li, S.; Huang, B.; Zhao, F.; Lu, Z.; Wang, X.; Chen, X.; Chen, Y. Environmental impact assessment of
agricultural production in Chongming ecological island. Int. J. Life Cycle Assess. 2019, 24, 1937–1947.
[CrossRef]
53. Chatzisymeon, E.; Foteinis, S.; Borthwick, A.G.L. Life cycle assessment of the environmental performance of
conventional and organic methods of open field pepper cultivation system. Int. J. Life Cycle Assess. 2017, 22,
896–908. [CrossRef]
54. Sanz Requena, J.F.; Guimaraes, A.C.; Quirós Alpera, S.; Relea Gangas, E.; Hernandez-Navarro, S.; Navas
Gracia, L.M.; Martin-Gil, J.; Fresneda Cuesta, H. Life Cycle Assessment (LCA) of the biofuel production
process from sunflower oil, rapeseed oil and soybean oil. Fuel Process. Technol. 2011, 92, 190–199. [CrossRef]
55. Cherubini, F.; Bird, N.D.; Cowie, A.; Jungmeier, G.; Schlamadinger, B.; Woess-Gallasch, S. Energy- and
greenhouse gas-based LCA of biofuel and bioenergy systems: Key issues, ranges and recommendations.
Resour. Conserv. Recycl. 2009, 53, 434–447. [CrossRef]
56. Adler, P.R.; Del Grosso, S.J.; Parton, W.J. Life cycle assessment of net greenhouse gas flux for bioenergy
cropping systems. Ecol. Appl. 2007, 17, 675–691. [CrossRef]
57. Malça, J.; Coelho, A.; Freire, F. Environmental life-cycle assessment of rapeseed-based biodiesel: Alternative
cultivation systems and locations. Appl. Energy 2014, 114, 837–844. [CrossRef]
58. Aguilera, E.; Lassaletta, L.; Sanz-Cobena, A.; Garnier, J.; Vallejo, A. The potential of organic fertilizers and
water management to reduce N2 O emissions in Mediterranean climate cropping systems. A review. Agric.
Ecosyst. Environ. 2013, 164, 32–52. [CrossRef]
59. Spinelli, D.; Jez, S.; Basosi, R. Integrated Environmental Assessment of sunflower oil production. Process
Biochem. 2012, 47, 1595–1602. [CrossRef]
60. Silalertruksa, T.; Bonnet, S.; Gheewala, S.H. Life cycle costing and externalities of palm oil biodiesel in
Thailand. J. Clean. Prod. 2012, 28, 225–232. [CrossRef]
© 2020 by the authors. Licensee MDPI, Basel, Switzerland. This article is an open access
article distributed under the terms and conditions of the Creative Commons Attribution
(CC BY) license (http://creativecommons.org/licenses/by/4.0/).You can also read