Preliminary Geospatial Analysis of Arctic Ocean Hydrocarbon Resources - PNNL-17922
←
→
Page content transcription
If your browser does not render page correctly, please read the page content below
PNNL-17922

Prepared for the U.S. Department of Energy
Under Contract DE-AC05-76RL01830

Preliminary Geospatial Analysis
of Arctic Ocean Hydrocarbon
Resources

P.E. Long
S.K. Wurstner
E.C. Sullivan
H.T. Schaef
D.J. Bradley

October 2008
DISCLAIMER

This report was prepared as an account of work sponsored by an agency of the
United States Government. Neither the United States Government nor any agency
thereof, nor Battelle Memorial Institute, nor any of their employees, makes any
warranty, express or implied, or assumes any legal liability or responsibility
for the accuracy, completeness, or usefulness of any information, apparatus,
product, or process disclosed, or represents that its use would not infringe
privately owned rights. Reference herein to any specific commercial product,
process, or service by trade name, trademark, manufacturer, or otherwise does not
necessarily constitute or imply its endorsement, recommendation, or favoring by
the United States Government or any agency thereof, or Battelle Memorial
Institute. The views and opinions of authors expressed herein do not necessarily
state or reflect those of the United States Government or any agency thereof.

            PACIFIC NORTHWEST NATIONAL LABORATORY
                               operated by
                               BATTELLE
                                  for the
              UNITED STATES DEPARTMENT OF ENERGY
                   under Contract DE-AC05-76RL01830

                        Printed in the United States of America

                    Available to DOE and DOE contractors from the
                     Office of Scientific and Technical Information,
                        P.O. Box 62, Oak Ridge, TN 37831-0062;
                                     ph: (865) 576-8401
                                    fax: (865) 576-5728
                              email: reports@adonis.osti.gov

        Available to the public from the National Technical Information Service,
       U.S. Department of Commerce, 5285 Port Royal Rd., Springfield, VA 22161
                                    ph: (800) 553-6847
                                    fax: (703) 605-6900
                             email: orders@ntis.fedworld.gov
                    online ordering: http://www.ntis.gov/ordering.htm

                        This document was printed on recycled paper.
                                          (9/2003)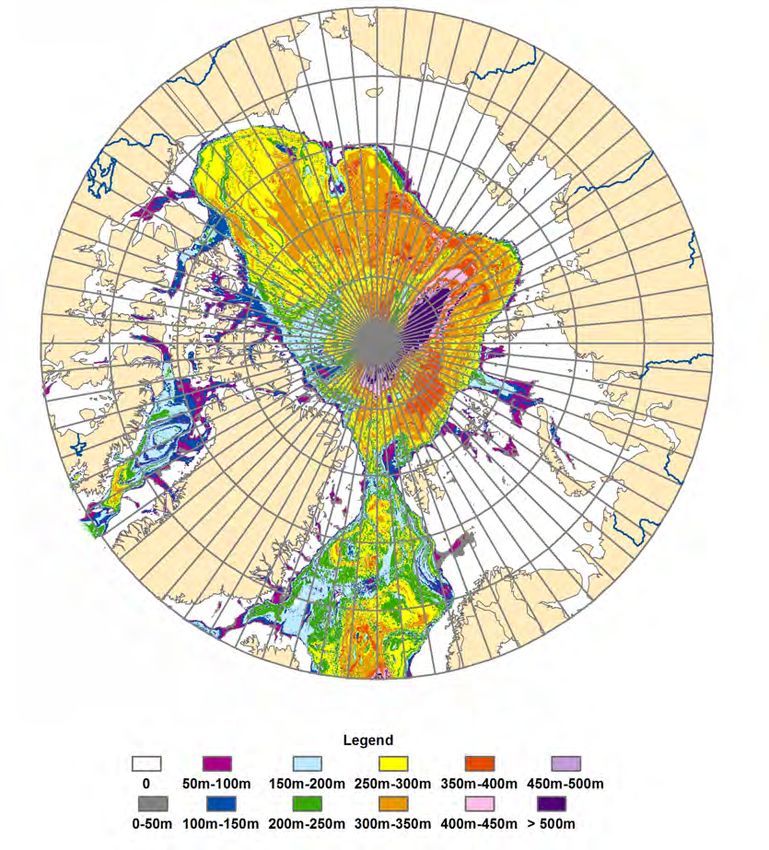
PNNL-17922

Preliminary Geospatial
Analysis of Arctic Ocean
Hydrocarbon Resources

P.E. Long
S.K. Wurstner
E.C. Sullivan
H.T. Schaef
D.J. Bradley

October 2008

Prepared for
the U.S. Department of Energy
under Contract DE-AC05-76RL01830

Pacific Northwest National Laboratory
Richland, Washington 99352
Summary

Ice over the Arctic Ocean is predicted to become thinner and to cover less area with time (NASA, 2005).
The combination of more ice-free waters for exploration and navigation, along with increasing demand
for hydrocarbons and improvements in technologies for the discovery and exploitation of new
hydrocarbon resources have focused attention on the hydrocarbon potential of the Arctic Basin and its
margins. The purpose of this document is to 1) summarize results of a review of published hydrocarbon
resources in the Arctic, including both conventional oil and gas and methane hydrates and 2) develop a set
of digital maps of the hydrocarbon potential of the Arctic Ocean. These maps can be combined with
predictions of ice-free areas to enable estimates of the likely regions and sequence of hydrocarbon
production development in the Arctic.
In this report, conventional oil and gas resources are explicitly linked with potential gas hydrate
resources. This has not been attempted previously and is particularly powerful as the likelihood of gas
production from marine gas hydrates increases. Available or planned infrastructure, such as pipelines,
combined with the geospatial distribution of hydrocarbons is a very strong determinant of the temporal-
spatial development of Arctic hydrocarbon resources.

Significant unknowns decrease the certainty of predictions for development of hydrocarbon resources.
These include: 1) Areas in the Russian Arctic that are poorly mapped, 2) Disputed ownership: primarily
the Lomonosov Ridge, 3) Lack of detailed information on gas hydrate distribution, and 4) Technical risk
associated with the ability to extract methane gas from gas hydrates. Logistics may control areas of
exploration more than hydrocarbon potential. Accessibility, established ownership, and leasing of
exploration blocks may trump quality of source rock, reservoir, and size of target. With this in mind, the
main areas that are likely to be explored first are the Bering Strait and Chukchi Sea, in spite of the fact
that these areas do not have highest potential for future hydrocarbon reserves.

Opportunities for improving the mapping and assessment of Arctic hydrocarbon resources include: 1)
refining hydrocarbon potential on a basin-by-basin basis, 2) developing more realistic and detailed
distribution of gas hydrate, and 3) assessing the likely future scenarios for development of infrastructure
and their interaction with hydrocarbon potential. It would also be useful to develop a more sophisticated
approach to merging conventional and gas hydrate resource potential that considers the technical
uncertainty associated with exploitation of gas hydrate resources. Taken together, additional work in these
areas could significantly improve our understanding of the exploitation of Arctic hydrocarbons as ice-free
areas increase in the future.

                                                     iii
Key Findings
Overall conclusions from this study are as follows:
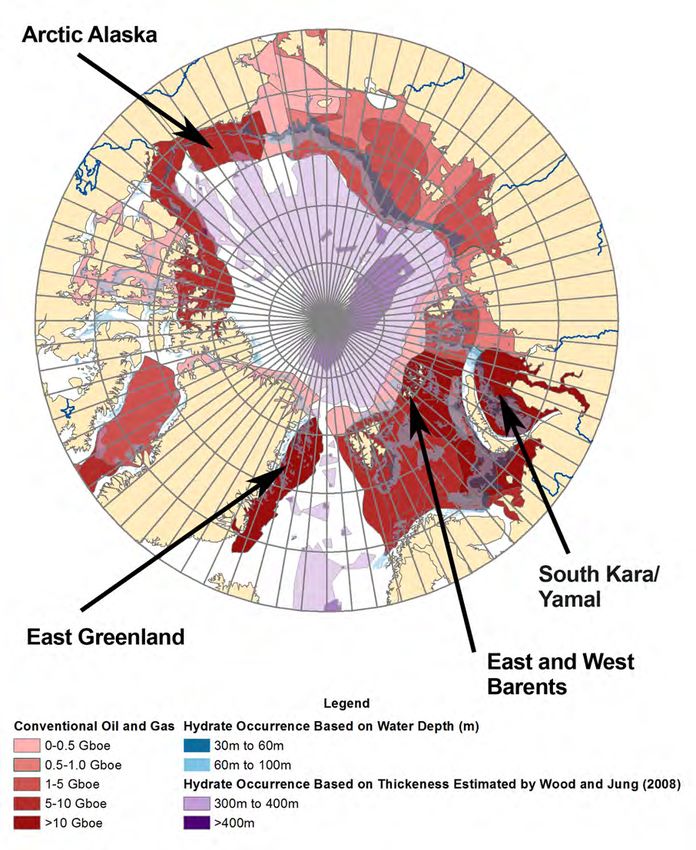
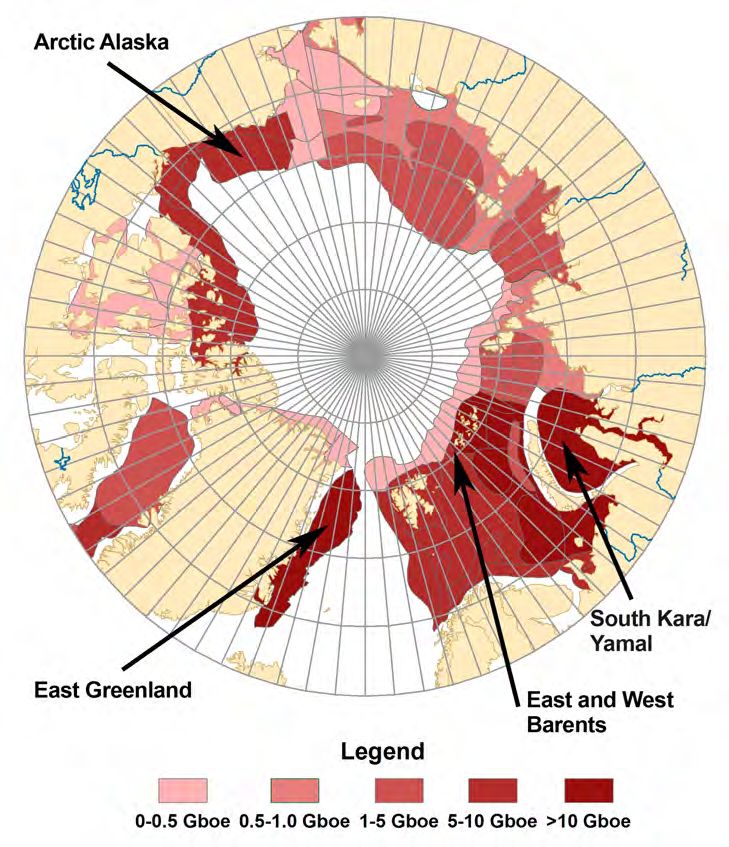
• Geographic areas with the highest hydrocarbon potential are Arctic Alaska, eastern Greenland,
the East and West Barents basins in Norway and Russia, and the South Kara/Yamal basins of
Russia.
• Global interest in Arctic hydrocarbon resources is dynamic, increasing dramatically as global
demand for hydrocarbon resources increases.
• The Arctic contains ~13% of global undiscovered oil, ~30% of global undiscovered conventional
natural gas, and as much as one third of global gas hydrate.
• Geospatial analysis of marine Arctic hydrocarbon resources can be linked to progressively ice-
free areas enabling estimation of possible development areas.
• The rate and location of future hydrocarbon exploration activities will depend not only on
richness of hydrocarbon potential, Arctic ice, and potential for supporting infrastructure, but also
on the opening of areas by various governments for industry exploration.
• Current infrastructure is well known. However, future infrastructure is partly controlled by
geopolitics and governmental decisions, making it difficult to predict. The most significant areas
are those with both highest hydrocarbon potential and the best current and planned infrastructure.
• Depth of water is critical in the economics of exploration and development; the shallow
continental shelf is not only more attractive economically, it is also where the greatest
hydrocarbon potential is located, including gas hydrates.
iv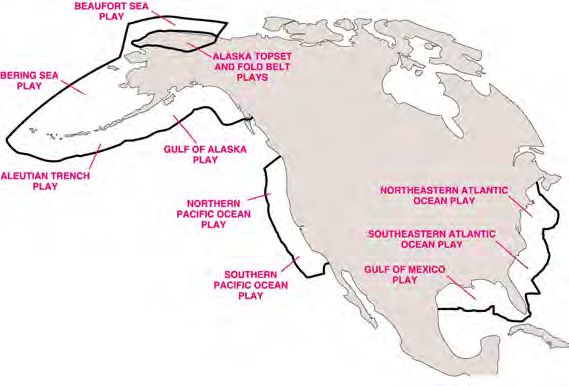
Contents

Summary.................................................................................................................................................. iii
1.0 Introduction .................................................................................................................................. 1.1
        1.1 Background .......................................................................................................................... 1.1
        1.2 Technical Discussion........................................................................................................... 1.2
                1.2.1 Elements of Hydrocarbon Systems ......................................................................... 1.2
                1.2.2 Petroleum Geology of the Arctic Ocean................................................................. 1.2
2.0 Review of Published Potential Hydrocarbon Resource Assessments....................................... 2.1
        2.1 United States Geological Survey Oil and Gas Assessment .............................................. 2.1
        2.2 Wood Mackenzie and Fugro Robertson Assessment ........................................................ 2.3
        2.3 Comparison of USGS and Wood Mackenzie Assessments.............................................. 2.3
        2.4 Methane Gas Hydrate Assessments ................................................................................... 2.4
3.0 Geospatial Analysis of Potential Hydrocarbon Resources ........................................................ 3.1
        3.1 Approach and Methods ....................................................................................................... 3.1
        3.2 Conventional Oil and Gas ................................................................................................... 3.4
        3.3 Methane Gas Hydrates ........................................................................................................ 3.5
        3.4 Combining Conventional Oil and Gas with Methane Gas Hydrate Resources ............... 3.8
        3.5 Overlaying Images in Google Earth ................................................................................. 3.10
4.0 Future Work.................................................................................................................................. 4.1
5.0 References..................................................................................................................................... 5.1
Appendix A ...........................................................................................................................................A.1

                                                                                  v
Figures
Figure 1.1. Tectonic elements of the Arctic Ocean (based on data from Jakobsson, et al., 2008) .. 1.3
Figure 2.1. Two of the Arctic regions assessed for undiscovered hydrocarbon resources by the
USGS (Klett et al., 2007 and Gautier, 2007). ............................................................................. 2.2
Figure 2.2. Offshore areas assessed by the USGS for in-place volumes of methane gas hydrates
(Collett, 1995)............................................................................................................................... 2.4
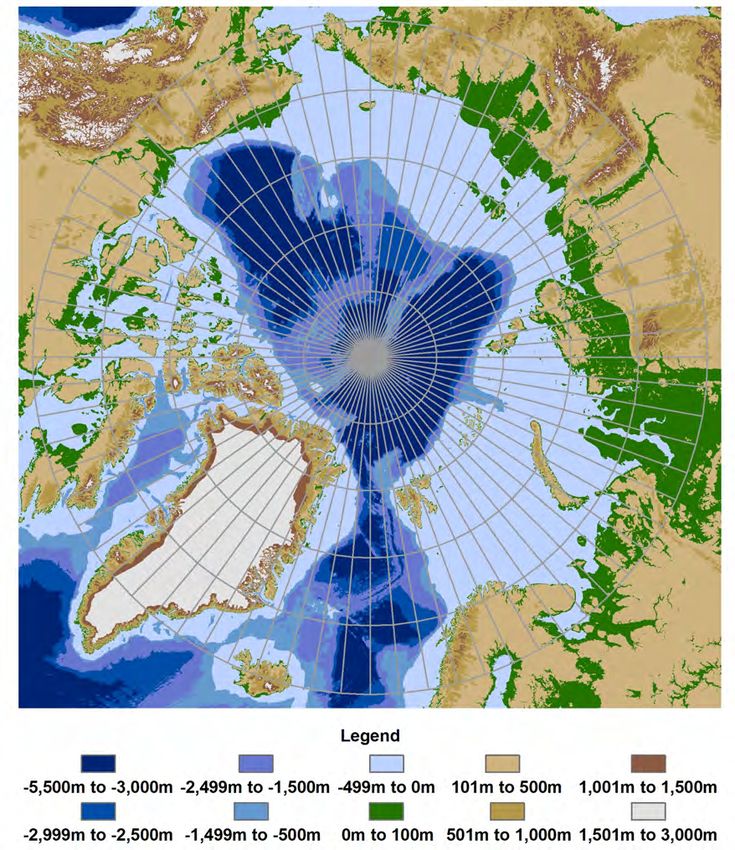
Figure 3.1. Bathymetry and Topography of the Arctic Region (based on data from Jakobsson, et
al., 2008)........................................................................................................................................ 3.2
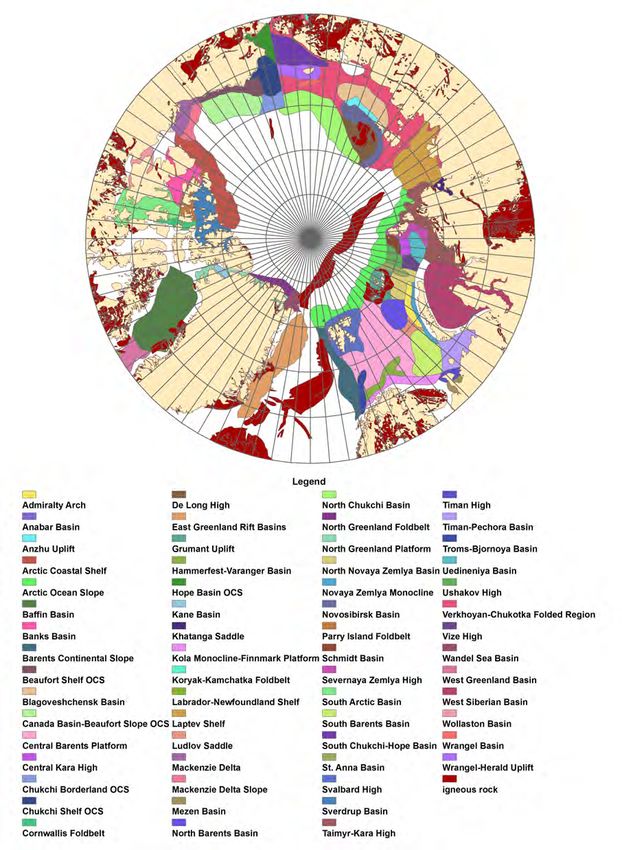
Figure 3.2. Geologic Provinces with possibility of oil and gas resources and areas of igneous rock
outcrops representing unlikely hydrocarbon occurrence (based on digital data from Persits
and Ulmishek, 2003) .................................................................................................................... 3.3
Figure 3.3. Conventional Oil and Gas Potential of Undiscovered Fields in Gboe per field. ........... 3.4
Figure 3.4 Arctic gas hydrate potential (from Wood and Jung, 2008) shown as an estimated
thicknes of the gas hydrate stability zone in marine sediments................................................. 3.5
Figure 3.5. Index map of investigation area (taken from Romanovskii et al., 2005) ....................... 3.6
Figure 3.6. Bathymetric Ranges Defining Continental Shelf Regions with Gas Hydrate Potential
Associated with Submarine Permafrost ...................................................................................... 3.7
Figure 3.7. Hydrocarbon potential showing combined methane hydrate and conventional oil and
gas potential.. ................................................................................................................................ 3.9
Tables
Table 2.1. Estimates of undiscovered hydrocarbon potential for some of the circum Arctic shelf
areas............................................................................................................................................... 2.3
Table 2.2. Estimates of Gobal Oceanic Reserves of Methane in Natural Gas Hydrates in 100,000
Trillion Cubic Feet (After EIA, 1998). ....................................................................................... 2.5
Table A.1. Index of electronic files provided on accompanying CD . ..............................................A.1
vi1.0 Introduction
1.1 Background
Arctic Ocean ice has been thinning and occupying less area over the last few decades and this trend is
expected to continue in response to global climate change (NASA, 2005). The combination of more ice-
free waters for exploration and navigation, along with increasing demand for hydrocarbons and
improvements in technologies for the discovery and exploitation of new hydrocarbon resources have
focused attention on the hydrocarbon potential of the Arctic Basin and its margins. The purpose of this
document is to 1) summarize results of a review of published hydrocarbon resources in the Arctic,
including both conventional oil and gas and methane hydrates and 2) develop a set of digital maps of the
hydrocarbon potential of the Arctic Ocean. These maps can then be combined with predictions of ice-free
areas to enable estimates of the likely regions and sequence of hydrocarbon production development in
the Arctic region.
At the present time there are over 550 oil and gas fields in the Arctic, primarily in northern Alaska, the
East Barents Sea, and the Russian Kara and Yamal Basins. Gas resources dominate over oil in much of
the Arctic Basin including the Chukchi Sea, the Mackenzie Delta and the Russian shelf. The rate and
location of future exploration activities will depend not only on richness of hydrocarbon potential and
potential for supporting infrastructure, but also on the opening of areas by various governments for
industry exploration. An example of the impact of government decisions is the intense activity connected
to the February 6, 2008 lease sale in the Chukchi area by the U.S. Minerals Management Service. The
expenditure of $3.4 billion by exploration companies for offshore tracts will be followed by seismic
acquisition and drilling. Pre-drilling evaluation of acreage may take as little as 2-3 years; Shell has
successfully drilled and tested the Burger well (estimated reserves of 14 trillion cubic feet (TCF) of
natural gas plus potential pay in additional shallow horizons) on one of the structures. The 29.4 million
acres in the lease sale are estimated to contain 15 billion barrels of oil and 77 TCF of gas (Friend, 2008).
This is not an area of the greatest hydrocarbon potential or of existing infrastructure, but it is an area of
good accessibility, current leasing activity, and proven hydrocarbons.
In this context, there are five nations claiming hydrocarbon resources in the Arctic Ocean. The
International Boundaries Research Unit at Durham University has extensively researched these claims
(IBRU, 2008, see http://www.dur.ac.uk/ibru/resources/arctic/). Conflicting national claims underscore the
importance of these resources to the future global economy as world hydrocarbon resources are strained
under the energy demands of developing nations. A multinational approach has been taken by the Arctic
Oil and Gas Company (AOAG.PK, http://www.arcticoag.com/). The company made an Exclusive Rights
Claim to the Hydrocarbon Resources of the Arctic Oceans Commons with the United Nations and the five
Arctic countries on May 9th 2006. The company plans to form a multinational joint venture consortium of
major oil companies. It is highly uncertain if the exclusive rights or the formation of a joint venture
consortium will be successful; the existence of the company and its claim illustrates the complexity of
competing national and corporate entities for exploitation of Arctic hydrocarbons.
Conventional hydrocarbon potential of the shallow parts of the Arctic continental shelf may be enhanced
by the near-surface presence of methane clathrates (also called methane hydrates or gas hydrates – for
simplicity we will use the term gas hydrates for the remainder of this report). Gas hydrates are solids
composed of crystalline cage-like molecular structures of water that each surround a gas molecule,
(mostly methane, but also propane, ethane, and carbon dioxide). This hydrocarbon resource forms
dominantly from microbial (biogenic) degradation of organic material, but also from thermogenic
1.1methane from deep, conventional hydrocarbon accumulations. An estimated 400 Gt of carbon in the form
of natural gas in hydrate form may exist in sub-oceanic sediments and arctic permafrost zones, where
conditions of pressure and temperature are within the hydrate stability region (Max, 2000; Kvenvolden,
1995; Sloan, 1997). However, global estimates of gas hydrate abundance have been controversial and
generally declining with time. Specific reservoir conditions and gas hydrate concentrations are more
important to the eventual production of methane gas from gas hydrate than the global amount of methane
in gas hydrates.
Technology to extract methane gas from natural gas hydrates is currently under development, and several
countries (United States, India, Canada, Japan, and South Korea) have established national gas hydrate
programs with production goals as early as 2017. As fossil energy resources become scarcer, natural gas
hydrate deposits are expected to become economically viable alternatives to conventional oil and gas
reservoirs.
1.2 Technical Discussion
1.2.1 Elements of Hydrocarbon Systems
The six main elements of conventional petroleum systems are reservoirs, traps, seals, source rocks,
hydrocarbon generation, migration, and the timing of development of each of the other elements.
Identification of source rock facies, distribution and maturity, the timing of trap and seal development,
along with the pressure, volume and temperature (PVT) characteristics of generated hydrocarbons help to
constrain the migration path and quantity of hydrocarbons that accumulate in a trap. The success of
locating hydrocarbon accumulations depends on understanding the geologic processes controlling basin
formation and fill, and includes regional tectonics, climate, and sediment supply, as well as the
geochemistry of rocks and fluids. First order models predict a relatively simple hydrocarbon distribution,
controlled largely by the presence of mature source rocks in areas of thick sedimentary rocks, with
favorable timing of hydrocarbon generation (hydrocarbon charge) relative to trap development.
Refinements of that simple paradigm have evolved to include complex migration histories and trapping
mechanisms that are now thought to be major controls on hydrocarbon type, quality, and distribution.
Tools and technologies for predicting and evaluating conventional hydrocarbon accumulations have also
greatly improved over the last 20 years. A similar approach is now applied to gas hydrate reservoirs
recognizing that there are differences in accumulation mechanisms for gas hydrate systems and that most
gas hydrate systems form from biogenic methane and are geologically young relative to most
conventional petroleum hydrocarbon systems.
1.2.2 Petroleum Geology of the Arctic Ocean
The distribution of source rock, reservoirs, traps and seals are strongly controlled by the tectonic history
of the Arctic Basin and the distribution of sedimentary rocks that contain the hydrocarbon resources. In
this section, we review the geologic history of the Arctic Basin, which includes the origin, distribution
and relative thickness of sedimentary rock.
1.2.2.1 Tectonic History of the Arctic Basin
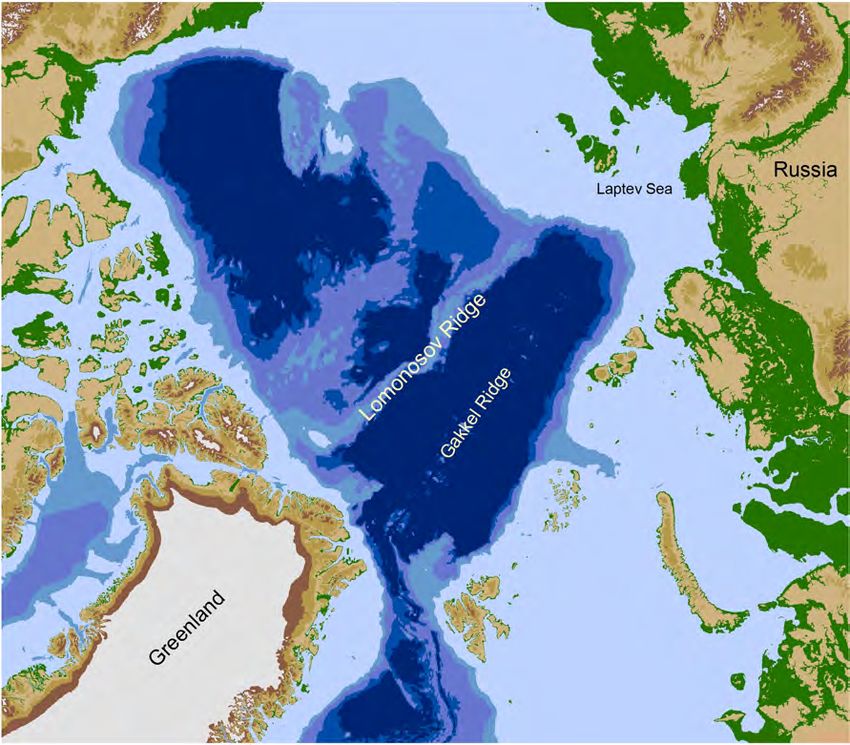
The geology of the Arctic Ocean is dominated by the Amerasia and Eurasia basins, which are separated
by the Lomonosov Ridge (Figure 1.1). Although considered to be international territory since 1997 (at
1.2which time the U.N. Convention on the Law of the Sea was ratified by 152 nations), a team of Russian
scientists reported in June of 2007 that new evidence showed that Russia’s Arctic region is connected to
the North Pole by the Lomonosov Ridge (Gramling, 2007). This resulted in the still-disputed claim that
Russia controls this territory and the natural resources within it.
Most of the oceanic crust in the Arctic basins is Cretaceous and Cenozoic in age and was generated by the
active Gakkel spreading ridge, which is a northward migrating extension of the mid-Atlantic Ridge
(Whaley, 2007a). Early to middle Paleozoic continental collision of the plates surrounding the Arctic
produced mountain belts and most of the economic basement. Regional subsidence during the Triassic
and Jurassic produced important source rocks and reservoirs for most of the discovered and yet-to-be
discovered hydrocarbon accumulations. Late Jurassic opening of the Canada sub-basin in the Amerasia
basin was accompanied by mountain building in Alaska and maturation and migration of hydrocarbons
toward Prudhoe Bay. During this time, erosion of the Canadian Rockies produced the large Mackenzie
Delta depocenter (area of maximum sediment thickness).
Figure 1.1. Tectonic elements of the Arctic Ocean (based on data from Jakobsson, et al., 2008)
The early opening of the Amerasia basin initiated with the Late Cretaceous migration of the mid Atlantic
Ridge between Greenland and Canada, and was followed by extension between Greenland and
Spitsbergen. Late Cretaceous sea floor spreading occurred parallel to the Canadian Arctic border, and was
1.3accompanied by the migration of the Chukchi Borderland along transform faults, and the formation of a
triple junction within the basin, forming the Alpha-Mendeleev Ridge. This extinct spreading center may
consist of continental crust that originated adjacent to the Lomonosov Ridge, plus thick post-Cretaceous
sediment (Max, 2000).
Sea floor spreading along the Gakkel Ridge commenced at the end of the Paleocene, and the Lomonosev
Ridge was rifted away from the continental crust of the Barents Sea, toward the North Pole. This rifting
was accompanied by subsidence of the Ridge, and has accelerated since the Miocene. Miocene pole-ward
extension of oceanic and continental crust also occurred from Greenland to the Beaufort Sea, as well as
between the Alaskan and Siberian Peninsulas.
The plate tectonic model of the Arctic Basin was redefined by GETECH (Whaley, 2007a) using an
extensive commercial library of gravity and magnetic data. The hydrocarbon potential based on this
redefined model can be associated with the following implications:
• The Chukchi Borderland is expected to have stratigraphic similarities to the North Slope of Alaska
and the Arctic Canadian islands.
• The Alpha-Mendeleev (A-M) Ridge may contain continental crust related to the Lomonosov Ridge.
Up to 6,000 m of post mid Cretaceous sediments may be present along the Alaska-facing flank of the
A-M Ridge (Max, 2000).
• The Lomonosov Ridge has been a sediment-starved continental margin during the Cenozoic but
consists of older continental crust that, which, according to the U. S. Geological Survey, may contain
up to 10 billion barrels of oil.
• Depth to the oil generation window in the Arctic Basin is generally about 2700 m. Unless sediments
have been buried to that depth they are not likely to have sourced hydrocarbons. This has important
implications for the Arctic-wide Eocene Azolla source rock interval (Whaley, 2007b).
• The Canada, Amundsen and Nansen basins are sediment starved. They are not expected to have
enough sediment to bury potential source rocks into the oil-maturation window.
• The northeast side of Greenland has several basins including rift and salt basins with highly
prospective accumulations of sedimentary rock.
1.2.2.2 Summary of the Tectonics and Petroleum Geology of the Arctic Basin
The most important controls on the petroleum geology of the Arctic Ocean include the pre-Cenozoic
history of deformation of the region surrounding the Arctic Ocean and the generally passive margin
tectonics from the Jurassic until Recent. Jurassic subsidence produced important source rocks. The Late
Cretaceous opening of the Arctic Ocean produced epicontinental rifts and important depocenters of the
Mackenzie Delta and the northeastern part of the East Siberian Shelf (Franke et al., 2004). Gas reserves
dominate over oil. Plate tectonic activities outside of the Arctic Basin have influenced not only the
sediment source (the Canadian Rockies) for the formation of depocenters such as the Mackenzie Delta,
but also many of the relatively gentle structural features that form traps in Chukchi and elsewhere. The
most prospective areas of the circum Arctic Ocean are the Arctic Alaska, eastern Greenland, the East and
West Barents basins in Norway and Russia, and the South Kara/Yamal basins of Russia. Most of these
have Jurassic oil and gas in structures that formed as a result of the opening of the Arctic. Structures in
the Barents Sea have reservoirs as old as Triassic; source rocks of the unexplored Laptev Basin are
expected to be Permian-Triassic (Dongarov, 2007). Post Cretaceous sedimentation rates outside of a few
1.4localized Arctic depocenters are relatively low, and low volumes of hydrocarbons are expected to have
matured or migrated during the Cenozoic: thus most of the oil in the Arctic occurs in older rocks but may
also have migrated into traps that formed as a result of Cenozoic tectonics. The youngest source rock
across the Arctic is the Eocene Azolla interval, formed by the prolific freshwater floating fern Azolla
during a time when the Arctic was largely enclosed, with elevated temperatures and a freshwater surface
layer. The ability of this zone to source hydrocarbon accumulation is largely related to thickness of
overburden (Whaley, 2007b).
The tectonics and geology controlling the occurrence of gas hydrates is markedly different from
conventional petroleum resources. Most gas hydrate forms from biogenic as opposed to thermogenic
methane based on the carbon isotopic signature of methane in gas hydrate. Furthermore, gas hydrate are
only stable in low temperature-high pressure environment, e.g. shallow marine sediments, a few to several
hundred meters below seafloor. Arctic marine permafrost relic from glacial low stands of sea level
enhances the formation of gas hydrate. Both passive and convergent continental margins host
voluminous gas hydrate deposits. The combination of depressed subseafloor isotherms and extensive
passive margin continental shelf sediments has led to long-standing predictions of gas hydrate in the
Arctic Ocean (Max and Lowrie 1993, Romanovskii et al. 2005). Recent estimates of Arctic gas hydrate
locations have also focused on gas hydrate stability in the context of sediment deposition thickness
(Wood and Jung 2008) and on submarine as well as terrestrial permafrost accumulations (Collett (2008).
1.52.0 Review of Published Potential Hydrocarbon Resource
Assessments
Hydrocarbon resource assessments by government agencies and private corporations have been ongoing
for decades, but the focus has often been in areas more accessible than the Arctic region. However, as
demand for hydrocarbons increases, assessment of additional areas becomes critical. This section
summarizes several of the hydrocarbon resource assessments conducted for the Arctic region.
2.1 United States Geological Survey Oil and Gas Assessment
The USGS has been undertaking hydrocarbon resource assessments for more than 30 years. These
assessments are based on the identification of hydrocarbon plays and the evaluation of each geologic
element of the Total Petroleum Systems defined in a given hydrocarbon province, and includes
hydrocarbon source rocks (source-rock type and maturation and hydrocarbon generation and migration),
reservoir rocks (sequence stratigraphy and petrophysical properties), and hydrocarbon traps (trap
formation and timing). Using this geologic framework, the USGS evaluates and estimates remaining
technically producible hydrocarbons (known) and undiscovered oil and gas resources as well as
hypothetical petroleum systems and their recoverable reserves.
The initial step of an assessment involves defining the hydrocarbon plays. A play is a volume of rock that
contains similar geological parameters (such as petroleum charge, reservoir, and trap) that determine
petroleum (crude oil, natural gas, and natural gas liquids) potential. For each play, distributions of the
number and size of potential petroleum accumulations are estimated, using a probabilistic range of values
for attributes such as reservoir thickness and porosity. These distributions are restricted to potential
accumulations larger than 50 million barrels of in-place oil (MMBO) or 250 billion cubic feet (BCF) of
technically recoverable gas for remote areas of the Arctic, and 5 million barrels of oil and 100 BCF in
areas that have considerable infrastructure, such as the central Alaska North Slope (Bird and
Houseknecht, 2005).
Resulting distributions are risked, using a procedure designed to weigh the likelihood that geologic
parameters were sufficient to generate at least the minimum-size accumulation. In turn, probabilistic
estimates of in-place petroleum resources are calculated on the basis of the risked distributions of size and
number of potential petroleum accumulations in each play. A recovery factor appropriate to each play is
applied to the estimates of in-place petroleum resources to calculate technically recoverable petroleum
resources. Typically, 30% to 50% of the in-place oil resources and about 60% to 70% of in-place gas
resources are technically recoverable. Estimates for each play are aggregated to calculate total technically
recoverable petroleum resources for each assessment area.
The USGS has published resource estimates only for portions of the offshore Arctic that include the south
Kara/Yamal, Barents Sea, Timan-Pechora, Lapteve Sea Shelf, eastern Greenland and western
Greenland/eastern Canada areas. The estimates for these areas have a range of uncertainty of almost an
order of magnitude. The Laptev Sea Shelf Province was assessed for undiscovered crude oil, natural gas,
and natural gas liquids/condensates resources (collectively referred to as petroleum) as part of the U.S.
Geological Survey’s Circum-Arctic Oil and Gas Resource Appraisal (CARA) (Klett, et al., 2007). Using a
geology-based methodology, the USGS estimates the mean undiscovered, conventional petroleum
resources in the province to be approximately 9,300 million barrels of oil equivalent, including
approximately 3,069 million barrels of crude oil, 32,252 billion cubic feet of natural gas, and 861 million
barrels of natural gas liquids. The USGS also completed an assessment of the potential for undiscovered,
technically recoverable (assuming the absence of sea ice) oil and gas resources in the East Greenland Rift
2.1Basins Province. This study, which supersedes the previous USGS assessment of the same area
completed in 2000, was necessary because of new information made available through collaboration with
the Geological Survey of Denmark and Greenland (GEUS), which significantly changes the geological
understanding of the area. As defined for CARA, the province includes an area of approximately 500,000
square kilometers, most of which underlies less than 500 meters of water offshore east of Greenland
between 70° and 82° North (Gautier, 2007. Figure 2.1 shows the regions assessed by the two studies. The
new Circum-Arctic Resource Appraisal by the USGS was released in July 2008, and and include
collaboration with the Geologic Survey of Denmark and Greenland (Bird et al. 2008). This new
assessment concludes “…that 90 billion barrels of oil, 1,669 trillion cubic feet of natural gas, and 44
billion barrels of natural gas liquids may remain to be found in the Arctic, of which approximately 84
percent is expected to occur in offshore areas.” A newly compiled but unpublished map of Arctic
sedimentary basins was used to define geologic provinces, each containing more than 3 km of
sedimentary strata.
Figure 2.1. Two of the Arctic regions assessed for undiscovered hydrocarbon resources by the USGS
(Klett et al., 2007 and Gautier, 2007).
2.22.2 Wood Mackenzie and Fugro Robertson Assessment
The recent assessment by consultants Wood Mackenzie and Fugro Robertson used a similar
methodology, but included a subsurface and commercial review of known resources and estimations of
the yet-to-find petroleum potential. They factored in existing infrastructure, full cycle economics, and
current cost structure and relied heavily on drilling and production data from current exploration activities
(Smith, 2007).
2.3 Comparison of USGS and Wood Mackenzie Assessments
The estimates of the absolute overall hydrocarbon potential of the Arctic by the USGS (prior to July
2008) and the Wood Mackenzie Group differ considerably , with the Wood Mackenzie study estimating
178 Giga barrels of oil equivalent (Gboe) across five countries, and the USGS, in its partial assessment of
the Arctic, estimating approximately 237 Gboe for a smaller assessed area. A study by the consultant
company IHS estimates a total of about 350 Gboe (HIS Energy, 2004), and a review by John Laherrere
(2008) estimated a total of 200 Gboe. The USGS estimates perhaps as much as 25% of the world’s
undiscovered resources are in the circum Arctic region; Wood Mackenzie estimates closer to 14%. Both
groups estimate that natural gas will likely account for perhaps as much as 75% of the potential; and both
groups assess Arctic Alaska, eastern Greenland, the East and West Barents basins in Norway and Russia
and the South Kara/Yamal basins of Russia as having the highest hydrocarbon potential (Gautier, 2007).
The Russian Laptev Sea shelf area is not expected to be as rich in hydrocarbons, but is still highly
prospective (Dongarov, 2007). Russian gas accounts for 69% of the total (Cohen, 2007). It is interesting
that the Chukchi area between Alaska and Siberia is not an area expected to have particularly large
hydrocarbon accumulations, yet because of logistics and leasing opportunity, it is an area of intense
exploration activity. Wood Mackenzie forecasts that oil production from all of the polar areas will peak at
3 million barrels per day (Mb/d) and 5 Mboe/d of gas, at least two decades from now (Cohen, 2007).
Some of the estimations by sub-basin are shown in Table 2.1. Lack of data and distance to industry hubs
and infrastructure result in lower potential being assigned to East Siberia, North Chukchi, the northern
part of the Laptev Sea, and North Greenland by the USGS and by the Wood Mackenzie study. Increase in
data and accessibility with time may result in large resources being recognized here. Although the
estimates of recoverable hydrocarbons are given in Giga barrels of oil equivalent, most of the potential
resource is gas. Exceptions will be where reservoirs are sourced by oil prone (mostly Silurian or other
lower Paleozoic) source rocks.
Table 2.1. Estimates of undiscovered hydrocarbon potential for some of the circum Arctic shelf areas.
BOE
COUNTRY RECOVERABLE DATA SOURCE
Greater Arctic http://www.mms.gov/alaska/re/reports/GSA/Abstract_
117 Gboe
Alaska Geoph_Soc_Alaska_06apr'06.pdf
ANWR plus
7.7 Gboe, 4
National USGS FS2005-1217
TCF gas
Petroleum Reserve
14G+ 333 Mboe
Mackenzie Basin USGS FS2006-302
gas
2.3East Greenland rift
17.3 Gboe USGS FS07-3077-508 (9 oil, 8 condensate, 86 TCF)
basin
Chukchi Sea 15.3 Gboe http://www.petroleumnews.com/pntruncate/328947931.shtml
6.2 Bboe http://energy.ihs.com/News/published-
Norwegian
articles/articles/norwegian-barents-sea-historical-overview-
Barents Sea
future-perspectives.htm
West Siberia Kara http://energy.ihs.com/NR/rdonlyres/EAA73544-7131-4B78-
185 Bboe
Sea 92B5-DBB9FF5308B3/0/fraser_russia.pdf
http://energy.ihs.com/NR/rdonlyres/EAA73544-7131-4B78-
East Siberian Sea 50+ Bboe
92B5-DBB9FF5308B3/0/fraser_russia.pdf
2.4 Methane Gas Hydrate Assessments
Assessment methodologies for recoverable reserves of methane gas hydrates are still being developed.
The USGS 1995 National Assessment of United States Oil and Gas Resources (Collett, 1995) contained,
for the first time, an assessment of the in-place methane gas hydrate resources of the U.S. onshore and
offshore regions (Figure 2.2). The offshore gas hydrate region included the continental shelf offshore
northern Alaska, with an estimated 168,500 trillion cubic feet (TCF). Actual recoverable is expected to be
much lower due to the difficulty in recovering gas hydrate in low concentrations. The USGS Energy
Program is working with the Mineral Management Service to develop standardized assessment
methodology of in-place resource.
Figure 2.2. Offshore areas assessed by the USGS for in-place volumes of methane gas hydrates (Collett,
1995).
The DOE and the US Energy Information Administration (EIA, 1998) summarized nonstandardized
global estimates of methane in hydrates. The estimates for oceanic deposits are shown in
Table 2.2, and vary by over an order of magnitude. More recently, the Geological Survey of Canada
(Osadetz and Chen, 2005) used both deterministic spatial and reservoir parameter probabilistic models to
assess in-place hydrate volumes for the Beaufort Sea-Mackenzie Delta. Their deterministically estimated
total gas hydrate gas-in-place resource for this area is 8.82 x10¹² m3.
2.4Recently, Wood and Jung (2008) have published a global estimate of gas hydrate distribution. Their
global gas hydrate estimate is 4.47x10⁵ km3 of solid methane hydrate or 2.6x10⁶ TCF of methane gas, or
40 terratons of carbon (TtC) globally. They do not break out their estimate by region and we have not yet
been able to interrogate their model results to determine the distribution of marine gas hydrate in the
Arctic. However, they did not include gas hydrate beneath marine permafrost (Wood, personal
communication).
Table 2.2. Estimates of Gobal Oceanic Reserves of Methane in Natural Gas Hydrates in 100,000 Trillion
Cubic Feet (After EIA, 1998).
Date of Estimate/Source Oceanic Deposits
1977/Trofimuk et al 1.8 to 8.8
1981/McIver 1.1
1988/Kvenvolden 6.2
1990/MacDonald 6.9
1994/Gornitz and Fung 9.3 - 49.1
2.53.0 Geospatial Analysis of Potential Hydrocarbon Resources
Previous hydrocarbon potential assessments of the arctic region such as those done by the USGS and
Wood Mackenzie have been focused on conventional oil and gas resources. These do not include the
potential resources of natural gas trapped by hydrates. However, as the world’s combustible energy
resource base shifts from oil to gas, exploitation of offshore methane gas hydrates from marine sediment
will likely occur (Max and Lowrie, 1992). Recent surveys by the USGS have estimated that reserves of
methane in hydrate form exceed all other fossil fuel forms of organic carbon (Booth et al., 1996),
although globally much of that hydrate resource is in sub-economic stratigraphic accumulations (Milkov
and Sassen, 2002). Independent estimates of the natural gas hydrate potential have suggested that as much
as 8,833,572 km3 of potential methane in hydrate is present in the Arctic. In this study, we integrate
published estimates of conventional oil and gas potential with knowledge about methane gas hydrate
occurrence to construct a preliminary geospatial analysis that can facilitate the prediction of hydrocarbon
development and exploitation in the Arctic Region. Geopolitical information as well as geologic and
infrastructure data available from published sources were considered in this analysis.
3.1 Approach and Methods
Our approach to this study was to gather existing, publicly available data and combine these data with
other sources to provide the basis for generating maps of hydrocarbon potential in the Arctic Region. We
used Environmental Systems Research Institute, Inc. (ESRI) ArcGIS to spatially analyze the data and
create maps that were subsequently converted to Keyhole Markup Language (KML) files that can be
imported into Google Earth. We began by assembling basemap data from several sources that would
provide the basis for our map products. Fundamental basemaps to provide general reference only, such as
country outlines and latitude and longitude lines, are from ESRI’s ArcWorld digital map. The digital grid
of the bathymetry of the arctic region was acquired from the International Bathymetric Chart of the Arctic
Ocean (Jakobsson, et al., 2008). Figure 3.1 shows the data presented by depth regions representing deep
to shallow water, land and ice cover. Geologic Basins and Rock type data layers were acquired from
coverages generated by the USGS as part of the Open File Report on Oil and Gas Fields of the Arctic
(Persits and Ulmishek, 2003). We eliminated geologic provinces that have no likelihood of producing oil
and gas, and areas containing igneous rock outcrops (shown in red), thus creating a base layer of
sedimentary basins having potential for hydrocarbon deposits (Figure 3.2). The main purpose of Figure
3.2 is to illustrate the geologic complexity of the Arctic region. Our study is necessarily a simplification
of that complexity. Note in particular, that we focus on marine hydrocarbon resources in order to
facilitate understanding of the effect of waning sea ice on the location and intensity of off-shore
development. Because we are primarily interested in offshore hydrocarbon deposits, most maps are
cropped by countries, shown in beige. However, we recognize that off-shore development cannot be
entirely separated from on-shore infrastructure.
3.1Figure 3.1. Bathymetry and Topography of the Arctic Region (based on data from Jakobsson, et al.,
2008)
3.2Figure 3.2. Geologic Provinces with possibility of oil and gas resources and areas of igneous rock
outcrops representing unlikely hydrocarbon occurrence (based on digital data from Persits
and Ulmishek, 2003)
3.33.2 Conventional Oil and Gas
We examined the summary comparison of estimated oil and gas reserves in the Arctic as reported by four
different groups. Two of these (USGS and Wood Mackenzie) have good summaries in map form. The
Wood Mackenzie assessments and maps were more conservative and more complete. Using their maps as
a base, we included the location of igneous rocks, structural boundaries, and sediment age and thickness
to produce a hydrocarbon potential map. The greatest uncertainties associated with this map are due to
lack of available data for parts of the Russian shelf in the Wood Mackenzie study, and the fact that USGS
studies are still ongoing. A comparison of assessments of Wood Mackenzie and the USGS by two
additional groups (IHS and John Laherrere, 2008) gave us additional confidence in the maps.
The results of comparing assessments and modulating relative estimates of hydrocarbon potential by
eliminating areas of basement rocks or thin sedimentary accumulations is shown in Figure 3.3. The
assignments reflect sediment thickness, known water depth, successful exploration activity, and
infrastructure.
Figure 3.3. Conventional Oil and Gas Potential of Undiscovered Fields in Gboe per field.
3.43.3 Methane Gas Hydrates
The approach to mapping potential methane gas hydrate occurrence in the polar region is based on Wood
and Jung (2008) as shown in Figure 3.4 and on bathymetry modeling adapted from Romanovskii et al.
(2005). Both Max and Lowrie (1993) and Wood and Jung (2008) directed their attention to non-
permafrost related factors controlling gas hydrate occurrence in the marine environment. Sediment
thickness and global heat flow were key factors in developing the three areas shown in Figure 3.4 which
shows the estimated thickness of gas hydrate stability zone. While this is roughly similar to the map of
Max and Lowrie (1993), we use Wood and Jung (2008) as the current best estimate of gas hydrate
distribution in Arctic Ocean outside of areas of marine permafrost.
Figure 3.4 Arctic gas hydrate potential (from Wood and Jung, 2008) shown as an estimated thicknes of
the gas hydrate stability zone in marine sediments. Submarine permafrost gas hydrate
potential is not included in this map. See Figure 3.6 for gas hydrate potential associated with
submarine permafrost.
3.5Romanovskii et al. (2005) focused on the East Siberia Arctic Shelf (Figure 3.5), which has a flat
bathymetry and relatively shallow water depths (not exceeding 100 m) and which can extend over 1000
km from the shoreline. By reconstructing the permafrost evolution over the last 400,000 years, these
authors modeled the evolution of the gas hydrate stability zone as well. Their results show conditions are
favorable for a continuous thick zone (~200 m) of stable gas hydrates in water depths up to 60m. An
average geothermal gradient flux of 70 mW/m2 was used for their calculations.
Figure 3.5. Index map of investigation area (taken from Romanovskii et al., 2005)
Building on the research presented by Romanovskii et al. (2005), we developed a map of potential
methane gas hydrate occurrence for the entire arctic shelf (Figure 3.6). The criteria were selected based on
modeling results by Romanovskii et al. (2005) that suggested the arctic shelf is underlain by relic
permafrost stable enough to support gas hydrate formation. It should be noted that inflow of rivers (shown
in Figure 3.6) and active tectonic zones, which would be dominant factors controlling hydrate stability,
were not considered because of scale. The dark blue color in Figure 3.6 represents the highest potential
for continuous methane gas hydrate occurrence, the lighter blue shades represent progressively less
favorable conditions. Boundaries for the thick (~200 m) hydrate deposit (dark blue) are confined to water
depths greater than 30m and less than or equal to 100 m. Romanovskii et al. (2005) did not eliminate the
0-30m water depth zone. We have given this zone a lower hydrate occurrence probability to more
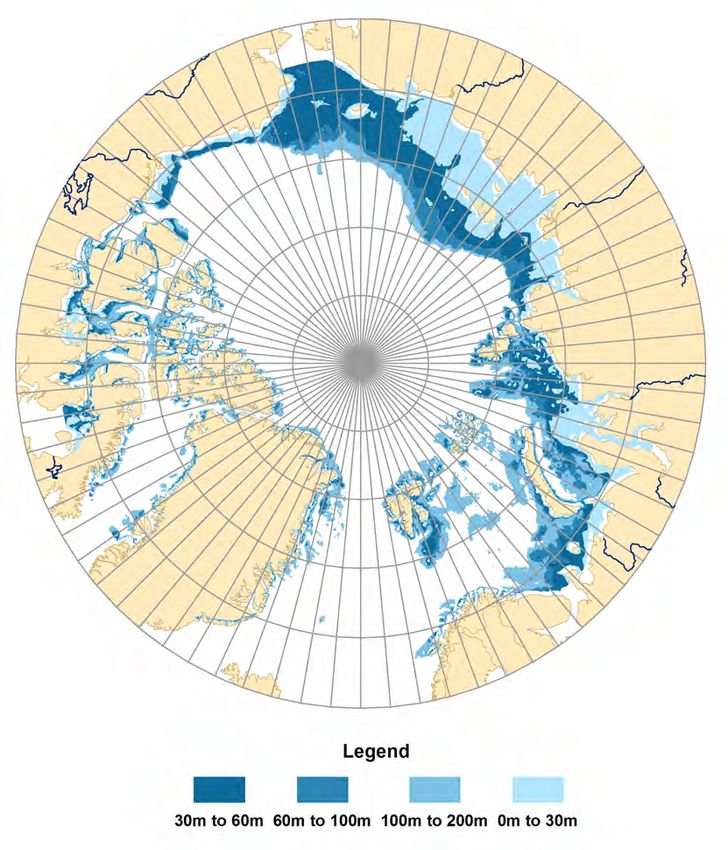
appropriately categorize estuaries and near shore environments where the thermal regime may not favor
gas hydrate stability. Gas hydrate is also less likely to be present in water depths between 100m and 200m
where methane gas hydrate bearing formations are expected to be patchy and discontinuous. The lightest
blue color shows areas of water depth between 0 to 30 m. For the purposes of this analysis we consider
the 0 to 30m water depth and the 100 to 200 m water depths to have similar gas hydrate potential.
3.6Generally, in this shallow shelf submarine permafrost setting, conditions favorable for methane gas
hydrate are expected to be minimal in water depths greater than 200 m. Again, it is important to note that
this approach is highly simplified and used by analogy with the results of Romanovskii et al. (2005). It
does not take into account the role of tectonic or other geologic factors which are expected to locally
concentrate or dissipate gas hydrate. We have also assumed that permafrost-controlled hydrate does not
occur south of 67.5˚ North latitude.
Figure 3.6. Bathymetric Ranges Defining Continental Shelf Regions with Gas Hydrate Potential
Associated with Submarine Permafrost. The near shore 0 to 30 m depths are considered to
have approximately the same potential for gas hydrate as the 100 to 200 m depths as
explained in the text.
3.73.4 Combining Conventional Oil and Gas with Methane Gas Hydrate
Resources
The final hydrocarbon potential map (Figure 3.7) was formed by combining the oil and gas potential with
the methane gas hydrate maps described in the previous section. The maximum hydrate stability potential
(30 to 100 m water depth, and the areas identified in Wood and Jung (2008)) were overlain in transparent
blue and purple colors on the five areas that represent different levels of oil and gas potential (shades of
red Figure 3.3). The potential for gas hydrate is, of course, uncertain due to timing and intensity of
fractures that allow methane to escape from sedimentary rocks and to form hydrates near the surface, as
well as from the presence of river discharge that destroys the preservation of permafrost. It should also be
noted that very young strictly biogenic methane hydrates may form in Pleistocene deltas or depocenters.
Figure 3.3 and 3.7 do not reflect sub-basin details in conventional hydrocarbon potential because such
information typically is available only from detailed studies and eventually from production data in
specific producing fields.
The shallow depth of the offshore continental shelf is the most important control on hydrate accumulation
in the Arctic; much of the potential of the shallow shelf is in relict accumulations, related to subaerial
exposure of the shelf and formation of permafrost and hydrates. The hydrates in the permafrost are
preserved by the Late Pleistocene and Holocene sea level rise. Presence of faults in hydrocarbon bearing
sedimentary rocks may increase the likelihood of methane as hydrate formation (Osadetz and Chen,
2005), particularly if the faulting is related to relatively late breaching of hydrocarbon reservoirs.
3.8Figure 3.7. Hydrocarbon potential showing combined methane hydrate and conventional oil and gas
potential. Rivers are shown in dark blue. Hydrate potential includes predicted hydrate
thickness in deeper sediments (300 m to 400 m and >400 m hydrate thickness) from Wood
and Jung (2008); and predicted regions of hydrate accumulation based on estimates of
Romanovskii et al. (2005), water depths of 30 to 60 m and 60 to 100 m. See text for
additional discussion of how this map was generated.
3.93.5 Overlaying Images in Google Earth
One approach to view geospatial images is to drape them over the world map provided in Google Earth or
other geographic data viewer. Figures 3.3, 3.6 and 3.7 were all converted to Keyhole Markup Language
(KML) format to be compatible with Google Earth, ArcExplorer or other geographic data viewers. These
images can be viewed layer by layer and scale as the data viewer zoom features are used. A CD
containing the generated maps as both images and in KML format is included with this document.
Appendix A contains an index of the files included on the CD.
3.104.0 Future Work
Available data on hydrocarbon resources in the Arctic Ocean make possible a preliminary geospatial
analysis that can facilitate the prediction of hydrocarbon development and exploitation in the region. The
combination of conventional oil and gas resources with potential gas hydrate resources has not been
attempted previously and is particularly powerful as the likelihood of gas production from shallow
methane gas hydrates increases. Available or planned infrastructure, such as pipelines, combined with the
geospatial distribution of hydrocarbons is a very strong determinant of the temporal-spatial development
of Arctic hydrocarbon resources. Current infrastructure is well known. However, future infrastructure is
partly controlled by geopolitics and governmental decisions, making it difficult to predict. Overall
conclusions from this study are summarized as follows:
• The most significant areas are those with highest hydrocarbon potential and the best current and
planned infrastructure.
• Depth of water is critical in the economics of exploration; the shallow continental shelf is not only
more attractive economically, it is also where the greatest hydrocarbon potential is located, including
gas hydrates.
• Geographic areas with the highest potential are Arctic Alaska, eastern Greenland, the East and West
Barents basins in Norway and Russia, and the South Kara/Yamal basins of Russia
Significant unknowns decrease the certainty of predictions for development of hydrocarbon resources.
These include:
• Areas in the Russian Arctic that are poorly mapped
• Disputed ownership: primarily the Lomonosov Ridge
• Lack of detailed information on gas hydrate distribution
• Technical risk associated with the ability to extract methane gas from gas hydrates
Logistics may control areas of exploration more than hydrocarbon potential. Accessibility, established
ownership, and leasing of exploration blocks may trump quality of source rock, reservoir, and size of
target. With this in mind, the main areas without highest potential that are likely to be explored first are
the Bering Strait and Chukchi Sea. Issues specific to these areas include ecology of polar bears and other
environmental issues. Furthermore, fields in the Bering Strait and north are likely to be fairly small. Step-
out drilling may shift exploration emphasis and result in some areas being drilled sooner, if step outs
result in high pay in specific areas. For the top ranked areas, step out drilling is not likely to change their
overall prospectivity.
Methane hydrate potential is largely confined to the shallow continental shelf that also contains the
greatest hydrocarbon potential. Commercial hydrate exploitation is likely to benefit from the development
of conventional resource infrastructure, especially since about 75% of that resource is expected to be gas,
rather than liquids. However, in areas where continued global warming allows warmer currents to enter
the Arctic basin, the presence of hydrates could actually pose drilling challenges ranging from minor gas
bubbling to borehole instability to safety hazards for drilling platforms. Dissociation of gas hydrates may
contribute to the destabilization of sediment and massive slope failures, as in the Storegga submarine
slide off west-central Norway (Hutchinson and Hart, 2003).
4.1Future research on development of Arctic hydrocarbon resources could be focused in three main areas: 1)
refining hydrocarbon potential on a basin-by-basin basis, 2) developing more realistic and detailed
distribution of gas hydrate, and 3) assessing the likely future scenarios for development of infrastructure
and their interaction with hydrocarbon potential. It would also be useful to develop a more sophisticated
approach to merging conventional and gas hydrate resource potential that considers the technical
uncertainty associated with exploitation of gas hydrate resources. Taken together, these areas could
further improve our understanding of the exploitation of Arctic hydrocarbons as ice-free areas increase in
the future.
4.25.0 References
Bird, K.J., and Houseknecht, D.W., 2005. “Oil and gas assessment of central North Slope, Alaska, 2005.”
U.S. Geological Survey Fact Sheet 2005-3043, 2 p., .
Bird, Kenneth J., Ronald R. Charpentier, Donald L. Gautier, David W. Houseknecht, Timothy R. Klett,
Janet K. Pitman, Thomas E. Moore, Christopher J. Schenk, Marilyn E. Tennyson, and Craig J. Wandrey,
2008. “Circum-Arctic Resource Appraisal: Estimates of Undiscovered Oil and Gas North of the Arctic
Circle.” U.S. Geological Survey, Fact Sheet 2008-3049
Booth, J.S., Rowe, M.M., Fischer, K.M. 1996. Offshore gas hydrate sample database with an overview
and preliminary analysis. U.S. Geological Survey, Open File Report 96-272, Denver, Colorado.
Cohen, D. 2007. “Arctic Dreams” Energy Bulletin 25 April 2007. 25 April 2007.
Collett, T.S.. 1995. “Gas hydrate resources of the United States”. in Gautier, D.L., Dolton, G.L.,
Takahashi, K.I., and Varnes, K.L., eds., 1995 National assessment of United States oil and gas resources
on CD-ROM: U.S. Geological Survey Digital Data Series 30.
Collett, Timothy, 2008, “Geologic and Engineering Controls on the Production of Permafrost–Associated
Gas Hydrate Accumulations.” Proceedings of the 6th International Conference on Gas Hydrates (ICGH
2008), Vancouver, British Columbia, CANADA, July 6-10, 2008.
Dongarov, Edward. “Laptev Sea: A Frontier Arctic Basin.” geoexpro.com. September 2007. 12 May
2008. .
Energy Information Administration, International Energy Outlook 1998, DOE/EIA-0484(98)
(Washington, DC, April 1998).
Franke, D., K. Hinz, and C. Reichert. 2004. “Geology of the East Siberian Sea, Russian Arctic, from
seismic images: Structures, evolution, and implications for the evolution of the Arctic Ocean Basin.”
Journal of Geophysical Research. Vol. 109, pp. B07106.
Friend, Phaedra. “Chukchi Sea Lease Sale Draws Record Bids.” RIGZONE.com. 6 February 2008. 20
May, 2008. .
Gautier, D.L., 2007, Assessment of undiscovered oil and gas resources of the East Greenland Rift Basins
Province: U.S. Geological Survey Fact Sheet 2007-3077, 4 p.
Gornitz, V. and I. Fung, 1994. “Potential distribution of methane hydrates in the world's oceans.” Global
Biogeochemical Cycles 8 (3) (1994), pp. 335–347.
Gramling. Carolyn. (2007). “Cold wars: Russia claims Arctic land.” Geotimes. Web Extra, August 1,
2007. < http://www.geotimes.org/aug07/article.html?id=WebExtra080107.html>
Hutchenson, D., and P. Hart. 2003. “Gas Hydrate in the Northern Gulf of Mexico Has Puzzling
Characteristics and Could Pose a Hazard to Deep Drilling” USGS Soundwaves Monthly Newsletter. July
2003. < http://soundwaves.usgs.gov/2003/07/fieldwork.html>.
5.1“IHS Energy's Report on 10-Year Petroleum Trends (1994-2003) Highlights Increased Oil and Gas
Production and a Healthy Remaining Global Resource Base.” 18 October 2004
Jakobsson, M., Macnab, R., Mayer, M., Anderson, R., Edwards, M., Hatzky, J., Schenke, H-W., and
Johnson, P., 2008, An Improved Bathymetric Portrayal of the Arctic Ocean: Implications for ocean
modeling and geological, geophysical and oceanographic analyses, Geophysical Research Letters (35),
< http://www.ibcao.org>
Klett, T.R., and others, 2007, Assessment of Undiscovered Petroleum Resources of the Laptev Sea Shelf
Province, Russian Federation: U.S. Geological Survey Fact Sheet 2007-3096.
Laherrere, Jean. “Arctic Oil and Gas Ultimates.” The Oil Drum: Europe. 12 March 2008.
Kvenvolden, K.A., 1995. “A review of the geochemistry of methane in natural gas hydrate.” Organic
Geochemistry (23): 997.
Kvenvolden, K. A.1988. “Methane hydrates and global climate.” Global Biochemical Cycles; (2):221–
229.
McIver, R.D. 1981. “Gas hydrates” in Meyer, R.F., and Olson, J.C., eds., Long-term energy resources:
Pitman, Boston, p. 713-726.
MacDonald, G.J. 1990. “The Future of Methane as an Energy Resource.” Annual Review of Energy (15):.
53-83.
Max, M.D. and A. Lowrie, 1992. "Natural Gas Hydrates: Arctic and Nordic Sea Potential," Arctic
Geology and Petroleum Potential, ed. T.O. Vorren et al., Norwegian Petroleum Society, 1992.
Max, M.D. 2000. Natural Gas Hydrate: In Oceanic and Permafrost Environments. Springer, 414p.
Milkov, A.V., and R. Sassen. 2002. “Economic geology of offshore gas hydrate accumulations and
provinces.” Marine and Petroleum Geology (19): 1-11.
NASA. ”Satellites See a Double –Texas Sized Loss in Arctic Sea Ice” 28 September 2005.
Osadetz, K.G., and Chen, Z. 2005. “A re-examination of Beaufort Sea-Mackenzie delta basin gas hydrate
resource potential using a petroleum play approach”, in Proceedings of the 5th International Conference
on Gas Hydrate, June 13-16, 2005, Trondheim, Norway, vol. 2.
Persits, F. M. and G. F. Ulmishek . 2003. Maps Showing Geology, Oil and Gas Fields, and Geologic
Provinces of The Arctic. U.S. Geological Survey Open File Report 97-470-J
Romanovskii, N. N., H. W. Hubberten, A. V. Gavrilov, A. A. Eliseeva, and G. S. Tipenko. 2005.
"Offshore permafrost and gas hydrate stability zone on the shelf of East Siberian Seas." Geo-Marine
Letters 25(2-3):167-182.
Sloan, D.E., 1997. Clathrate Hydrates of Natural Gases. Marcel Dekker, Inc, New York.
5.2You can also read