Effects on Microbiota Composition after Consumption of Quinoa Beverage Fermented by a Novel Xylose-Metabolizing L. plantarum Strain - MDPI
←
→
Page content transcription
If your browser does not render page correctly, please read the page content below
nutrients
Article
Effects on Microbiota Composition after Consumption of
Quinoa Beverage Fermented by a Novel Xylose-Metabolizing
L. plantarum Strain
Pamela Canaviri-Paz * , Elin Oscarsson, Anna Kjellström, Hanna Olsson, Chandana Jois and Åsa Håkansson

                                            Department of Food Technology, Engineering and Nutrition, Chemical Center, Lund University, Box 124,
                                            221 00 Lund, Sweden; elin.oscarsson@food.lth.se (E.O.); anna.kjellstrom@food.lth.se (A.K.);
                                            hanna.louise.olsson@gmail.com (H.O.); chandana.jois1@gmail.com (C.J.); asa.hakansson@food.lth.se (Å.H.)
                                            * Correspondence: pamela_rosario.canaviri_paz@food.lth.se

                                            Abstract: Demands for novel lactic acid bacteria with potential to be used as probiotics along with healthy
                                            fermented plant-based products increase worldwide. In this study, a novel Lactiplantibacillus plantarum
                                            P31891 strain with enzymatic capacity to degrade tannins and ferment xylose was used as starter
                                            culture for fermentation of a quinoa-based beverage. The probiotic potential of the selected strain
                                            was evaluated in healthy volunteers. Twenty participants consumed the beverage for 14 days;
                                            microbiota changes in saliva and faecal samples were analyzed by Terminal Restriction Fragment
                                            Length Polymorphism (T-RFLP), Next Generation Sequencing (NGS) and qPCR; and gastrointestinal
                                  well-being and digestive symptoms were recorded. The results indicated that the consumption of

                                            the beverage with Lactiplantibacillus plantarum P31891 in a probiotic dose (1012 CFU/mL) increased
Citation: Canaviri-Paz, P.; Oscarsson,
                                            the number of Lactobacillus in the feces but not in saliva. Overall, the bacterial community did not
E.; Kjellström, A.; Olsson, H.; Jois, C.;
                                            seem to be influenced by the bacterium or by the beverage, as expressed by the diversity indexes, but
Håkansson, Å. Effects on Microbiota
                                            specific genera were affected, as reflected in changes in amplicon sequence variants. Consequently,
Composition after Consumption of
Quinoa Beverage Fermented by a
                                            Lactiplantibacillus plantarum P31891 showed potential to be categorized as a probiotic strain in the
Novel Xylose-Metabolizing L.                fermented quinoa-based beverage.
plantarum Strain. Nutrients 2021, 13,
3318. https://doi.org/10.3390/              Keywords: Lactiplantibacillus plantarum P31891; quinoa-based; fermentation; in vivo study; terminal
nu13103318                                  restriction fragment length polymorphism; Next Generation Sequencing

Academic Editor: Francisco J.
Pérez-Cano
                                            1. Introduction
Received: 13 August 2021
                                                 The consumption of beverages and foods that contain probiotic microorganisms
Accepted: 15 September 2021
                                            has in recent years shown tremendous growth worldwide. Although fermented dairy
Published: 23 September 2021
                                            products are currently the most common food carrier and generally good matrices to
                                            deliver probiotics to humans, an increasing number of non-dairy food matrices exhibit
Publisher’s Note: MDPI stays neutral
                                            potential to be used. Due to a constantly increasing consumer demand of plant-based
with regard to jurisdictional claims in
published maps and institutional affil-
                                            milk alternatives for sustainability, health-related, lifestyle and dietary reasons, various
iations.
                                            plants have been used to produce non-dairy options. This has resulted in an abundance
                                            of products based on nuts, seeds or beans, but the choice of substrate often limits people
                                            suffering from food allergies, and very few of the products on the market are carrier of
                                            probiotic bacteria.
                                                 Quinoa (Chenopodium quinoa Willd.) is a native plant in the Andean region of South
Copyright: © 2021 by the authors.
                                            America that has attracted global growing interest and expanded cultivation even at
Licensee MDPI, Basel, Switzerland.
                                            European latitudes, where the number of producer countries are rapidly increasing [1]. The
This article is an open access article
distributed under the terms and
                                            nutritional value of quinoa grains is high, with a protein quality similar to milk [2] while
conditions of the Creative Commons
                                            being gluten free. Quinoa also has a relatively high amount of dietary fibers, facilitating
Attribution (CC BY) license (https://
                                            digestion [3]. Due to the substantial nutritional content, quinoa is an interesting food
creativecommons.org/licenses/by/            base for functional foods. However, quinoa is in addition known for some anti-nutritional
4.0/).                                      aspects such as content of saponins and phytic acid that can be reduced by fermentation.

Nutrients 2021, 13, 3318. https://doi.org/10.3390/nu13103318                                                https://www.mdpi.com/journal/nutrients
Nutrients 2021, 13, 3318 2 of 14
The process can furthermore increase bioavailability of several compounds [4,5], and
fermented foods have been associated with health benefits by, for example, reducing the
risk of diseases such as type 2 diabetes [6,7]. Traditionally, fermentation has been used
as a food preserving technique for thousands of years, and both the process and the
products have recently attracted scientific interest due to claimed beneficial effects. The
fermentation process is usually performed by the diverse group of bacteria called lactic acid
bacteria (LAB) including, for example, the family Lactobacillaceae. A properly fermented
product is microbiologically safer and has a longer shelf-life compared to an unfermented
one. However, induced fermentation relies on the efficacy of the starter culture, and it
is important to use a culture that can outcompete the native microbiota of the substrate
used. Quinoa has been related to inadequate hygiene after spontaneous fermentation
or via backslopping, as the native microbiota of quinoa grains comprises opportunistic
pathogens [8].
The composition of our gut microbiota and dietary factors are significant for hu-
man health, and the use of probiotics and prebiotics can play an important role in its
maintenance [9,10]. Probiotic bacteria commonly belong to lactic acid bacteria and can,
therefore, be found in spontaneously fermented products. As probiotics have been reported
to, e.g., strengthen the intestinal barrier function, to compete with intestinal pathogens and
to produce health promoting substances and stimulate the immune system [11–13], the
use of probiotic strains as starter cultures can contribute to additional health benefits in
fermented products. In this study, the strain Lactiplantibacillus plantarum P31891 was used
as starter culture due to its ability to degrade tannins, to ferment xylose [14] and for being a
safe organism to consume [15]. According to the definition, probiotic organisms should be
viable and consumed in adequate amounts in order to influence the composition of the in-
testinal microbiota. Lactic acid bacteria as starter culture in a quinoa-based fermented drink
has previously been found to survive transit through the gastrointestinal tract, indicating
that fermented quinoa might be a suitable medium for probiotic bacteria [16].
The aim of this study was to evaluate the probiotic potential of a quinoa-based
fermented drink using the bacterium Lactiplantibacillus plantarum P31891 as a starter culture,
with focuses on changes in saliva and faecal microbiota composition after 14 days of daily
consumption by healthy volunteers.
2. Materials and Methods
2.1. Beverage Development and Evaluation of Hygiene Quality
2.1.1. Quinoa-Based Fermented Drink
White quinoa grains (Chenopodium quinoa Willd.) (Sålta Kvarn AB, Stockolm, Sweden)
imported from Bolivia were acquired from a local supermarket in Lund, Sweden. A quinoa-
based fermented drink was produced in a pilot scale at the Department of Food Technology,
Engineering and Nutrition, Lund University. Elimination of possible impurities on quinoa
grains was performed by submerging the grains in water 1:3 (w/v) twice, under sporadic ag-
itation for 15 min each. The cleaning continued under running tap water until the discarded
water became clear and foamless. The clean quinoa grains were dried at 195 ◦ C with con-
stant agitation on a stove (Elektro Helios, Stockholm, Sweden), followed by 20 min toasting
at 145 ◦ C. Sterile tap water, autoclaved at 121 ◦ C for 15 min and cooled down to 4 ◦ C,
was mixed with the toasted quinoa grains in a proportion of 1:8 (w/v). The mixture was
homogenized using a blender (Electrolux, Great blending TruFlowTM blades, ESB5400BK,
Stockholm, Sweden) for 15 min. Subsequently, the mixture was filtrated through a cheese
cloth, collected and distributed in one liter (302.135.52, IKEA, Malmö, Sweden) or half
liter (203.244.72, IKEA, Malmö, Sweden) glass bottles with caps, which were filled to the
maximum capacity after inoculation and sealed hermetically, minimizing the presence of
oxygen. The inoculum concentration was measured spectrophotometrically at 610 nm. The
quinoa beverage was inoculated with 1.6 × 10⁹ CFU of Lactiplantibacillus plantarum P31891
per liter beverage. The quinoa-based drink was incubated at 30 ◦ C for 48 h with sporadic
agitation and thereafter stored at 4 ◦ C before distribution.Nutrients 2021, 13, 3318 3 of 14
2.1.2. pH and Microbial Analysis
Changes in pH and plate count were assessed for hygiene evaluation of the drink
before fermentation (0 time), after fermentation (48 h) and at the seventh and fourteenth
days of storage in 4 ◦ C. The pH was measured using a Methohm 744 pHmeter (Metholhm,
Ltd., Herisau, Switzerland) previous calibrated according to the manufacturer’s recom-
mendations. For viable count, a conventional dilution procedure was conducted, and
samples from the selected dilutions were spread plated on Violet Red Bile Dextrose agar
(VRBD, Merck, Germany) incubated aerobically at 37 ◦ C during 24 h for enumeration of
Enterobacteriaceae and on Rogosa agar (Oxoid) incubated anaerobically (Gas Pak Anaerobic
system, BBl, Becton Dickinson and company, Franklin Lakes, NJ, USA) at 37 ◦ C for 72 h for
lactobacilli count.
2.2. In Vivo Study
Volunteers for participation in the study were recruited during November and Decem-
ber (2019) in Sweden. Inclusion criteria were healthy individuals equal or over 18 years
old who had not been under medical treatment in the past year or consumed antibiotics
6 months before their participation in the study. The participants did not suffer from gas-
trointestinal disorders or symptoms such as irritable bowel syndrome, inflammatory bowel
disease, constipation or diarrhea at inclusion. The number of participants was determined
based on the power analysis (PS Power and sample Size Program), version 3.0, William
D. Dupont and Walton D. Plummer, to reach a power of 80%. Participants (13 females
and 7 males) were enrolled after signing the consents to participate in the study according
to the Declaration of Helsinki. The study was approved by the Swedish Ethical Review
Authority (Dnr: 2019-01302) and is registered in ClinicalTrials.gov (NCT04280731).
2.2.1. Protocol
The study continued for 30 days. The participants were subjected to two weeks (14 d)
of a wash out period prior to consumption. The participants were told to not consume
any commercial probiotic products or fermented products during the study. During the
consecutive two weeks (14 d), the participants consumed daily 2.5 dL of the fermented
quinoa beverage that they were instructed to keep in the fridge (approx. 4 ◦ C) at home.
Along with the drink, the participants received an exploratory questionnaire and pre-
labelled tubes for collecting saliva (50 mL, VWR) and stool samples (Feces tube 76 × 20 mm,
SARSTED). The participants recorded gastrointestinal well-being and digestive symptoms
in a questionnaire during the study.
2.2.2. Saliva and Stool Samples Collection
Saliva and stool samples were collected by the participants at two occasions: one day
(24 h) before starting consumption of the fermented quinoa beverage and one day (24 h)
after the last day of consumption. After collection, the samples were stored at refrigeration
temperature (faecal and saliva samples for qPCR analysis) and in −20 ◦ C (faecal and saliva
samples for T-RFLP and NGS analysis) by the participants until delivery to the Department
of Food Technology Engineering and Nutrition, Lund University. The samples were further
stored at 4 ◦ C or −80 ◦ C until being analyzed using the methods mentioned.
2.3. Qualitative and Quantitative Assay of In Vivo Samples
2.3.1. DNA Extraction
Saliva and faecal samples stored at 4 ◦ C were treated immediately after arrival to
Department of Food Technology Engineering and Nutrition. Aliquots of 100 µL of saliva
(n = 3, per participant) were transferred into 5 mL Man Rogosa and Shape Broth (MRS-
Broth, Merck, Germany) incubated at 37 ◦ C anaerobically for 24 h. Faecal samples were
weighed (1 g) and diluted into 9 mL of sterile peptone water and vortexed for 1 min.
Aliquots of 1 mL of faecal sample (n = 3, per participant) were transferred into 5 mL of MRS
broth. Incubation was followed as previously described [17]. After incubation, the samplesNutrients 2021, 13, 3318 4 of 14
were centrifuged at 3000× g for 5 min. After centrifugation, 500 µL of the supernatant
were withdrawn and pulled together per participant and centrifuged at 20.8× g for 3 min
(Thermo Scientific, Heraeus Pico 21, Hamburg, Germany). The pellets were cleaned with
500 µL of 0.85% NaCl (g/L) sterile solution followed by a second clean using 500 µL of
sterile Milli-Q water. The pellets were suspended in 500 µL of sterile Milli-Q water before
bead beating using an Eppedorf Mixer 5432 (Eppendorf, Hamburg, Germany) for 45 min
at 4 ◦ C. The DNA was separated by centrifugation (20.8× g, 1 min) and used as templated
in the subsequent polymerase chain reaction (PCR).
DNA was extracted from frozen stool samples according to the method described by
Karlsson et al. [18]. Briefly, 50 mg of stool sample was weighed in 1.5 mL tubes containing
glass beads (between 10 to 12, 2 mm diameter, previously UV sterilized) using an analytical
weigh (model TA302-Traveler, Switzerland), and 500 µL of sterile PBS (Phosphate Buffered
Saline; pH 7.3 ± 0.2 at 25 ◦ C) was added. The samples were incubated during 10 min at
room temperature and vortexed for 1 min followed by 45 min of bead beating at 4 ◦ C on
an Eppendorf Mixer (model 5432, Eppendorf, Hamburg, Germany), after which they were
vortexed for 1 min and centrifuged (3000× g, 30 s) to sediment the pellet. The amount
of 200 µL of the supernatant was collected for DNA extraction using the DNA tissue kit
(Qiagen bioinformatics, Aarhus, Denmark) and EZ1 advanced XL BioRobot (tissue kit and
card; Qiagen). The samples were store at 4 ◦ C until further analyses.
DNA was extracted from 200 µL of frozen saliva samples after thawing on ice without
previous treatment. The DNA was extracted as previously described, but the bead beating
procedure was excluded. The samples were stored at 4 ◦ C until further analyses.
2.3.2. Terminal Restriction Fragment Length Polymorphism Assay
The microbial communities from the saliva and faecal samples were characterized by
amplifying the 16S rRNA genes by the pair primers listed in Table 1. The PCR reactions
were performed in six replicates. The Shannon and Simpsons diversity index (DI) was
calculated from the peak area (40–600 bp) obtained per sample in Excel (Microsoft, 2010),
according to the method described by Oscarsson et al. [19].
Table 1. Primers used for amplifications.
Method Objective Primers Primer Length Ref
FAM-ENV-1 (50 -AGA GTT TGA TII TGG CTC AG-30 )
T-RFLP 16S rRNA genes [20]
ENV-2 (50 -CGG ITA CCT TGT TAC GAC TT-30 )
(50 -TCG TCG GCA GCG TCA GAT GTG TAT AAG AGA
341F
16S rRNA genes CAG CCT ACG GGN GGC WGC AG-30 ) [21]
NGS
(V3-V4) (50 -GTC TCG TGG GCT CGG AGA TGT GTA TAA GAG
805R
ACA GGA CTA CHV GGG TAT CTA ATC C-30 )
Genus Lact-F (50 -AGC AGT AGG GAA TCT TCC A-30 )
q-PCR [17]
Lactobacillus Lact-R (50 -CAC CGC TAC ACA TGG AG-30 )
2.3.3. Next Generation Sequencing
The variable region V3-V4 was amplified using the primers (Eurofins Genomics,
Ebersberg, Germany) in Table 1 according to the 16S Metagenomic Sequencing Library
Preparation protocol. The thermal cycling was performed in an Eppendorf MasterCycler
(Eppendorf, Hamburg, Germany), and the resulting fragments were 550 bp. AMPure XP
beads (Agencourt, Beckman coulter genomics, Brea, CA, USA) were used for purification
of the amplified PCR products. A second PCR reaction was performed in order to attach
indexes (Nextera XT index kit, Illumina, San Diego, CA, USA) to the fragments, and the
PCR products were purified once more. The concentration of the resulting DNA fragments
was determined by using Qubit4.0 Fluorometer (Thermo Fisher Scientific, MAN0017210,
Gothenborg, Sweden), after which the samples were combined in equimolar ratios to a
final concentration of 6 pM. The fragments were loaded to an Illumina MiSeq systemNutrients 2021, 13, 3318 5 of 14
(Illumina, San Diego, CA, USA) and sequenced using MiSeq reagent kit v3 (Illumina Inc.,
San Diego, CA, USA) with a read length of 2 × 300 bp paired-end sequencing according to
the manufacturer’s instructions.
2.3.4. Quantitative Real-Time PCR
The amount of DNA originating from bacteria belonging to the former genus Lactobacillus
was determined in faecal and saliva samples using a q-PCR assay following the procedures
previously described by Karlsson et al. [17]. Briefly, each reaction contained 10 µL 2xRotor-
Gene SYBR Green PCR Master Mix (Qiagen) together with 0.5 µmol/L of the primers listed
in Table 1, 2 µL DNA template and RNAse-free water, resulting in a final volume of 20 µL.
All samples, standards and negative controls were run in triplicates in a Rotor-Gene Q
(Qiagen). The thermal cycling started with 95 ◦ C for 5 min followed by 40 cycles where the
DNA was denatured at 95 ◦ C for 5 s, annealed and elongated at 60 ◦ C for 20 s. The absolute
amount of DNA belonging to Lactobacillus was determined based on calculations using
standard curves with known DNA concentrations using Rotor-Gene Q Series Software 1.7
(Qiagen), R2 > 0.998. The detection limit was 102 genes/reaction. Cloned PCR products
from Lactiplantibacillus plantarum 299v was used for building the standard curve.
In order to confirm viability of Lactobacillus spp. in faecal and saliva samples after
consumption, viable count was performed on Rogosa agar (Oxoid) after serial dilution in
sterile bacteriological peptone water (NaCl, Merck, 8.5 g/L; Bacteriological peptone, Oxoid,
1g/L), and the samples were incubated anaerobically (Gas Pack Anaerobic system, BBI,
Becton Dickinson and company, Franklin Lakes, NJ, USA) at 37 ◦ C for 72 h.
2.4. Statistical Analysis
SigmaPlot version 14.0 (SYSTAT Software, Point Richmond, CA, USA) software was
used for the statistical analyses. Changes in pH and viable cell counts were evaluated by
Kruskal–Wallis one-way analysis of variance (ANOVA) on ranks or a Mann–Whitney ranks
sum test, when appropriate. T-RFLP and q-PCR data were analysed by Wilcoxon signed
rank test, and the results are expressed as median and interquartile range (IQR; 25–75%).
For viable count of lactobacilli after consumption, Excel 2010 was used, and the results
were expressed as mean (SD). NGS statistical analyses were calculated in R version 3.6.3
excluding all sequences not identified as bacteria, such as chloroplasts or mitochondria,
prior analysis. The differences in Alpha diversity (Observed, Chao1, Shannon and Simpson)
over time were calculated with the Wilcoxon test for pairwise comparison. Beta diversity
was calculated using the weighted and unweighted unifrac, Jaccard and Bray-Curtis
dissimilarity and was compared using the Adonis test. The differences between timepoints
regarding relative abundance of phyla, family and genus level were computed with the
Wilcoxon rank test, and DeSeq2 was used for calculating Log2Fold change. The data
were normalized using total sum scaling prior calculation of the relative abundance test.
p-values ≤ 0.05 were considered significant.
3. Results
3.1. Beverage Development and Hygiene Evaluation
pH and Microbial Analysis
The efficiency of the fermentation and the safety of the quinoa based fermented
drink were evaluated by monitoring pH and plate culturing during the fermentation. A
significant decrease in pH was observed after 48 h of fermentation (p < 0.001; Table 2) with a
slightly continuous variation during storage time. The fermentation was not dependent on
the volume of substrate used for the process, and no significant differences of pH or viable
count were detected between volumes (Table 2). The presence–absence of Enterobacteriaceae
before and after fermentation was investigated in order to validate the hygiene quality
of the beverage. The decrease in viable Enterobacteriaceae cells was statistically significant
(p = 0.001) at 48 h of fermentation and remained stable below the limit of detection during
the storage time (p = 0.017) (Table 2). The increase in bacterium L. plantarum P31891 wasNutrients 2021, 13, 3318 6 of 14
statistically significant at 48 h (p-values = 0.001) and remained constant during the storage
time (Table 2).
Table 2. pH, Enterobacteriaceae and lactobacilli count in the fermented quinoa-based beverage.
Log10 CFU/mL
pH
Volume Time Enterobacteriaceae Lactobacilli
Median IQR Median IQR Median IQR
0h 6.36 a 6.31–6.40 2.9a 2.7–3.3Shannon 2.37 2.10–2.55 2.31 1.91–2.71 2.63 1.46–3.03 2.67 2.47–2.95
Simpson 0.84 0.79–0.87 0.82 0.70–0.88 0.88 0.67–0.92 0.88 0.84–0.92
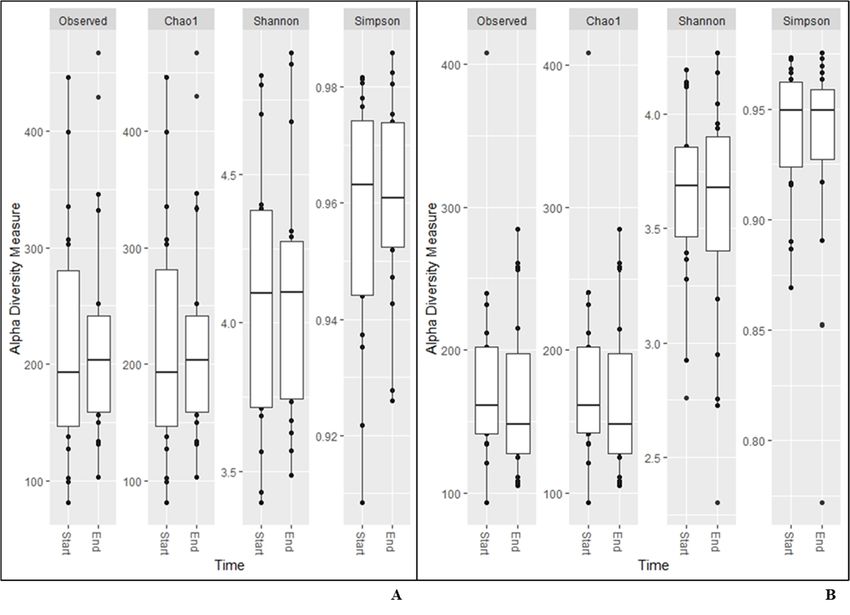
The same results were found for alpha diversity for any of the measurements calcu-
Nutrients 2021, 13, 3318 lated based on data from the NGS analysis (Figure 1). The beta diversity remained7con- of 14
stant during the study (unweighted unifrac (p = 1.0; p = 1.0); Bray–Curtis (p = 1.0; p = 1.0);
Jaccard (p = 1; p = 1), and weighted unifrac (p = 0.990; p = 0.986), respectively.
Figure 1. Alpha diversity measurements for saliva (A), and faecal (B) samples.
Figure 1. Alpha diversity measurements for saliva (A), and faecal (B) samples.
3.3.2. Relative Abundance
3.3.2. Relative Abundance
The relative composition of different phyla can be observed in Table 4 for both saliva
The relative composition of different phyla can be observed in Table 4 for both saliva
and faecal samples. In the saliva samples, the most occurring phyla was Bacteroidetes and
and faecal samples. In the saliva samples, the most occurring phyla was Bacteroidetes and
Firmicutes, followed by Proteobacteria. In the faecal samples, Firmicutes had the highest
Firmicutes, followed by Proteobacteria. In the faecal samples, Firmicutes had the highest
relative abundance, followed by Bacteroidetes (Table 4). There was no change in relative
relative abundance, followed by Bacteroidetes (Table 4). There was no change in relative
abundance on phyla level over the study period, however, both in saliva and in faecal
abundance on phyla level over the study period, however, both in saliva and in faecal
samples, an increase in the family Lactobacillaceae could be observed (p < 0.01 and p < 0.0001,
samples, an increase in the family Lactobacillaceae could be observed (p < 0.01 and p <
respectively) (Tables 5 and 6).
0.0001, respectively) (Tables 5 and 6).Nutrients 2021, 13, 3318 8 of 14
Table 4. Relative abundance of bacterial phyla in saliva and faecal samples expressed as median and
interquartile range (MD ± IQR) at the start and end of the study.
Bacterial Phyla Relative Abundance
Start (%) End (%)
p (Start–End)
Median IQR Median IQR
Saliva
Firmicutes 31.8 24.7–39.8 28.8 22.6–45.4 0.664
Bacteroidetes 33.0 23.2–38.7 32.7 26.0–39.0 0.908
Fusobacteria 9.0 6.6–13.4 8.2 6.5–10.8 0.707
Actinobacteria 0.6 0.3–1.2 0.6 0.3–0.9 0.583
Proteobacteria 17.8 17.8–28.0 21.3 15.5–32.6 0.506
Faeces
Firmicutes 49.5 40.6–56.4 51.6 40.0–58.0 0.883
Bacteroidetes 45.2 33.5–51.3 41.6 38.0–54.3 0.758
Actinobacteria 0.14 0.08–0.3 0.13 0.07–0.2 0.639
Proteobacteria 1.0 0.6–2.0 1.1 0.5–2.0 0.925
Verrucomicrobia 0.1 0.0–2.1 0.3 0.0–2.6 0.740
Table 5. Relative abundance of families and genera in saliva samples expressed as median and interquartile range (MD and
IQR) at the start and end of the study.
Saliva Start (%) End (%)
p (Start–End)
Family Median IQR Median IQR
Campylobacteraceae 1.49 0.81–2.64 1.18 0.70–2.18 0.418
Carnobacteriaceae 0.78 0.49–1.32 0.86 0.60–1.16 0.840
Flavobacteriaceae 0.93 0.48–2.34 1.20 0.50–2.97 0.931
Fusobacteriaceae 5.04 2.52–7.39 4.87 3.18–6.41 0.644
Gemellaceae 0.54 0.31–0.75 0.63 0.33–0.96 0.525
Lachnospiraceae 1.88 1.36–3.39 1.42 0.92–2.17 0.065
Lactobacillaceae 0.00 0.00–0.00 0.02 0.00–0.09 0.003
Leptotrichiaceae 3.62 2.13–5.94 3.46 2.25–5.53 0.863
Neisseriaceae 7.67 2.91–13.8 6.64 4.52–11.2 0.954
Pasteurellaceae 8.60 6.06–11.9 10.85 8.07–17.0 0.212
Peptostreptococcaceae 0.53 0.09–0.92 0.24 0.14–0.63 0.726
Porphyromonadaceae 7.25 2.53–9.02 6.62 3.83–9.91 1.00
Prevotellaceae 18.5 12.8–25.8 20.10 10.5–26.7 0.885
Streptococcaceae 6.97 4.85–9.68 5.19 4.27–11.67 0.931
Veillonellaceae 17.9 14.4–26.4 17.84 15.4–23.3 0.954
Genus
Aggregatibacter 0.57 0.30–0.79 0.59 0.23–0.92 0.804
Campylobacter 1.49 0.81–2.64 1.18 0.70–2.18 0.418
Capnocytophaga 0.93 0.48–2.34 1.20 0.50–2.97 0.931
Fusobacterium 5.04 2.5–7.39 4.87 3.18–6.40 0.644
Granulicatella 0.78 0.49–1.32 0.86 0.60–1.16 0.84
Haemophilus 7.23 5.59–10.0 9.12 5.17–14.5 0.297
Leptotrichia 2.64 1.95–4.86 2.95 1.57–5.33 0.954
Megasphaera 1.12 0.35–2.19 0.49 0.22–1.38 0.181
Neisseria 6.78 2.50–13.2 5.63 3.98–10.7 1.00
Oribacterium 0.93 0.67–2.06 0.72 0.42–0.94 0.061
Porphyromonas 6.60 2.28–8.73 6.07 3.43–9.56 0.954
Prevotella 18.48 12.8–25.8 20.1 10.5–26.7 0.885
Selenomonas 0.56 0.34–1.48 0.50 0.32–1.11 0.544
Streptococcus 6.97 4.85–9.68 5.19 4.27–11.7 0.931
Veillonella 14.09 12.4–21.6 16.7 13.4–19.9 0.954Nutrients 2021, 13, 3318 9 of 14
Table 6. Relative abundance of families and genera in faecal samples expressed as median and interquartile range (MD±IQR)
at the start and end of the study.
Faecal Start (%) End (%)
p (Start–End)
Family Median IQR Median IQR
Bacteroidaceae 18.75 14.2–30.8 21.0 15.3–36.1 0.494
Lachnospiraceae 12.52 10.3–16.8 11.8 5.8–18.8 0.529
Lactobacillaceae 0.00 0.00–0.00 0.04 0.01–0.12 0.000
Porphyromonadaceae 1.88 0.90–3.24 2.98 1.65–4.71 0.221
Rikenellaceae 7.20 3.73–9.65 6.72 4.13–11.3 0.883
Ruminococcaceae 23.7 16.01–30.2 23.9 14.5–27.2 0.820
Veillonellaceae 5.58 4.57–14.5 6.91 3.90–14.9 0.678
Genus
Bacteroides 18.75 14.6–30.8 21.0 15.3–36.1 0.494
Coprococcus 0.83 0.22–2.13 0.51 0.18–2.09 0.494
Dialister 4.45 2.29–4.45 5.42 1.89–13.6 0.639
Dorea 0.50 0.20–0.90 0.30 0.16–1.26 0.904
Faecalibacterium 8.84 2.76–12.9 13.3 5.42–17.8 0.239
Oscillospira 2.57 1.88–5.03 1.68 1.32–2.73 0.096
Parabacteroides 1.87 0.87–3.24 2.98 1.65–4.71 0.201
Roseburia 2.56 1.17–4.61 3.06 1.27–5.17 0.639
Ruminococcus 1.34 0.57–3.77 0.89 0.59–1.40 0.221
Studying the change in abundance of specific ASVs over time, it was found that
ASVs belonging to Fusobacterium, Haemophilus, Leptotrichia, Porphyromonas and Prevotella
increased, meanwhile Ornibacterium, Paludibacter and Streptococcus decreased in saliva
samples (Figure 2). For Veillonella, one ASV increased but another decreased. In faecal
samples, ASVs belonging to Bacteroides increased and Oscillospira decreased over time,
whereas one ASV of Prevotella increased and two decreased (Figure 2).
3.3.3. Absolute Amount of Lactobacillus
The absolute number of lactobacilli in saliva samples was not significantly different
over time (Table 7). Contrary to the saliva samples, the lactobacilli content was higher in
faecal samples at the end of the study, compared to the initial values (Table 7).
Table 7. Quantification of lactobacilli in in vivo samples.
Saliva Faeces
Log10 16S rRNA Copies/mL Log10 16S rRNA Copies/g
IQR IQR
Median p (Start–End) Median p (Start–End)
(25–75%) (25–75%)
Start 7.87 0.00–9.20 * 8.28 8.05–9.46
0.548 0.014
End 8.54 6.73–9.28 9.71 9.18–10.4
* Ten volunteers had concentrations below the detection limit, which were assumed to be zero during the
statistical analysis.
The viable counts of lactobacilli in saliva and faecal samples after consumption of the
fermented quinoa beverage were 4.90 ± 0.52 and 7.96 ± 0.57 (mean (SD)), respectively, and
growth were found for all individuals.Nutrients 2021,13,
Nutrients2021, 13,3318
x FOR PEER REVIEW 10
10 of
of14
14
Figure 2.2. Log2FoldChange
Figure Log2FoldChange calculated
calculated as
as start
start vs.
vs. end
end for
for amplicon
amplicon sequence
sequence variants
variants belonging
belonging toto different
differentgenera.
genera. All
All
results
results in
in the
thefigure
figureare
aresignificant withppNutrients 2021, 13, 3318 11 of 14
In the present study, the results from the alpha and beta diversity analyses showed
no overall change diversity indices in either saliva or faecal samples after consumption.
Those results suggest that the human microbiota in healthy individuals is relatively stable
and is not affected by intake of the probiotic bacteria or the fiber-rich quinoa. Previously,
it has been shown that a diet rich in fiber does not change the alpha-diversity [17]. The
human microbiota is generally considered adult like at three years of age and have only
minor fluctuations over time [20,21]. Overall, the saliva had higher diversity than the faecal
samples (Figure 1), which was also reflected in the relative abundance of phyla (Table 4).
Higher alpha diversity has been detected and not detected in saliva after intake of probiotic
products in previous studies by Dassi et al. [26], which partly contrasts with our results.
However, the authors also found that the probiotics only had small changes on relative
abundance and taxonomic distribution, even if they were able to re-identify the species
from the probiotic product in saliva samples [27]. On the other hand, it has also been
shown that less than 50% of the participants had the probiotic bacteria present in the saliva
samples after three weeks of probiotic intervention [16]. In the saliva samples, we found
higher levels of the family Lactobacillaceae after two weeks of consumption of the fermented
quinoa drink, showing a possible persistence of the genus (Table 5). Although we did
not find an increase in absolute numbers of the genus Lactobacillus after consumption, we
observed detectable levels of Lactobacillus spp. in all participants at the end of the study
(Table 7). Furthermore, ASVs belonging to the genus Prevotella increased in abundance
over the study period in the saliva samples. Prevotella is commonly seen to increase in the
gut microbiota after intake of a fiber-rich diet [28,29] and might, therefore, increase as a
consequence of the consumption of quinoa [3]. In saliva, ASVs of the genera Fusobacterium,
Haemophilus, Leptotrichia, Porphyromonas, Ornibacterium, Paludibacter, Streptococcus and
Veillonella, constituting genera of the oral microbiome, were also found to be affected [30,31]
(Figure 2). Data of compositional changes of the human salivary microbiota by dietary
factors are limited, but Hansen et al. [30] did find intake of dietary components such
as fibers and fatty acids to be associated with bacterial diversity, community structure
and relative abundance of species-level operational taxonomic units [30]. If the changes
found after consumption of the fermented quinoa-based drink depend on the potential
probiotic strain, the nutritional content of quinoa grains or a combination thereof need to
be further evaluated.
Compared to the saliva samples, the faecal microbiota was relatively stable over time.
No changes were found in diversity or relative abundance of specific bacteria except an
increase in the family Lactobacillaceae (Table 6). Furthermore, only three identified genera
seemed to change in ASV abundance over time (Bacteroides, Oscillospira and Prevotella)
(Figure 2) compared to nine in the saliva samples. ASVs belonging to Bacteroides seemed
to increase, which has mostly been associated with consumption of animal products [29],
particularly with high contents of fat and protein [28]. Discrepancies against this gen-
eralization have been shown and discussed by others, where plant-based diets high in
proteins and fibers also increased the abundance of Bacteroides spp. [32–34]. Quinoa has
both high protein and fiber values [2,3] and might, therefore, influence the increase in
Bacteroides. After consumption of the fermented quinoa-based drink, we also found a
significant increase in absolute numbers of Lactobacillus spp. in faecal samples (Table 7).
The finding should be regarded as beneficial and except for indicating a possible surviv-
ability of the administrated strain, the increase can also be associated with the high content
of polyphenols in quinoa grains, which has previously been shown to positively affect
lactobacilli proliferation [35].
With an increased intake of fiber and/or when starting probiotic consumption, in-
dividuals may initially experience a mild increase in gas production, bloating and some
digestive problems, which normally subsides after a few weeks of regular intake. In the
present study, the volunteers participating experienced the effects after intake of the quinoa-
based fermented drink differently. According to the questionnaire, 35% perceived minor
stomach pains during the study, meanwhile, 65% did not have any discomfort. None ofNutrients 2021, 13, 3318 12 of 14
the participants experienced any increase in bloating but instead experienced a reduction
in bloating of 11% was actually reported.
5. Conclusions
In conclusion, the consumption of the quinoa based fermented drink with
Lactiplantibacillus plantarum P31891 did increase the amount of Lactobacillus spp. in the
faecal samples and changed the Log2Fold change of specific ASVs in both saliva and faecal
samples, especially ASVs belonging to genera associated with intake of a plant-based diet.
As the diversity index was not affected by the intake, the potential probiotic strain seems
to enhance the intestinal Lactobacillus population without altering the balanced indigenous
microecology of the healthy participants.
6. Patents
Deposited data under the Budapest Treaty in the Belgian Coordinated Collection of
Microoorganisms-BCCM. Laboratorium voor Microbiologie-Bacterienverzameling-LMG,
patent collection. The following accension number has been assigned: L. plantarum
LMG P-31891.
Author Contributions: Conceptualization, P.C.-P., E.O. and Å.H.; data curation, H.O. and C.J.;
formal analysis, P.C.-P., E.O. and A.K.; investigation, P.C.-P.; methodology, P.C.-P. and E.O.; project
administration, Å.H.; resources, Å.H.; software, P.C.-P., E.O., A.K., H.O. and C.J.; supervision, Å.H.;
validation, P.C.-P. and A.K.; writing—original draft, P.C.-P.; writing—review and editing, P.C.-P., E.O.
and Å.H. All authors have read and agreed to the published version of the manuscript.
Funding: This research was funded by the Swedish International Development Cooperation Agency
(SIDA), Sweden, Project number ID 75000553, and the APC was funded by Lund University (LU).
Institutional Review Board Statement: The study was conducted according to the guidelines of the
Declaration of Helsinki and approved by the Swedish Ethical Review Authority (Dnr: 2019-01302)
and is registered in ClinicalTrials.gov (NCT04280731).
Informed Consent Statement: Informed consent was obtained from all subjects involved in the study.
Acknowledgments: The authors would like to express their sincere thanks to Jörgen Nilsson and
Stina Burri for the administrative and technical support.
Conflicts of Interest: The authors declare no conflict of interest. The funders had no role in the design
of the study; in the collection, analysis or interpretation of data; in the writing of the manuscript or in
the decision to publish the results.
References
1. Bazile, D.; Jacobsen, S.-E.; Verniau, A. The Global Expansion of Quinoa: Trends and Limits. Front. Plant Sci. 2016, 7, 622.
[CrossRef] [PubMed]
2. Vega-Gálvez, A.; Miranda, M.; Vergara, J.; Uribe, E.; Puente, L.; Martínez, E.A. Nutrition facts and functional potential of quinoa
(Chenopodium quinoa willd.), an ancient Andean grain: A review. J. Sci. Food Agric. 2010, 90, 2541–2547. [CrossRef] [PubMed]
3. Ogungbenle, H.N. Nutritional evaluation and functional properties of quinoa (Chenopodium quinoa) flour. Int. J. Food Sci. Nutr.
2003, 54, 153–158. [CrossRef]
4. Rizzello, C.G.; Lorusso, A.; Russo, V.; Pinto, D.; Marzani, B.; Gobbetti, M. Improving the antioxidant properties of quinoa flour
through fermentation with selected autochthonous lactic acid bacteria. Int. J. Food Microbiol. 2017, 241, 252–261. [CrossRef]
[PubMed]
5. Carrizo, S.L.; Montes de Oca, C.E.; Laiño, J.E.; Suarez, N.E.; Vignolo, G.; LeBlanc, J.G. Ancestral Andean grain quinoa as source of
lactic acid bacteria capable to degrade phytate and produce B-group vitamins. Food Res. Int. 2016, 89, 488–494. [CrossRef]
6. Chen, M.; Sun, Q.; Giovannucci, E.; Mozaffarian, D.; Manson, J.E.; Willett, W.C. Dairy consumption and risk of type 2 diabetes: 3
cohorts of US adults and an updated meta-analysis. BMC Med. 2014, 12, 1–14. [CrossRef] [PubMed]
7. Díaz, A.; Mònica, L.; Miguel, B.; González, A.M.; Corella, D.; Estruch, R. Dairy product consumption and risk of type 2 diabetes
in an elderly Spanish Mediterranean population at high cardiovascular risk. Eur. J. Nutr. 2016, 55, 349–360. [CrossRef] [PubMed]
8. Canaviri Paz, P.; Janny, R.J.; Håkansson, Å. Safeguarding of quinoa beverage production by fermentation with Lactobacillus
plantarum DSM 9843. Int. J. Food Microbiol. 2020, 324, 108630. [CrossRef]Nutrients 2021, 13, 3318 13 of 14
9. Salminen, S.; Collado, M.C.; Endo, A.; Hill, C.; Lebeer, S.; Quigley, E.M.M. The International Scientific Association of Probiotics
and Prebiotics (ISAPP) consensus statement on the definition and scope of postbiotics. Nat. Rev. Gastroenterol. Hepatol. 2021, 18,
649–667. [CrossRef]
10. FAO; WHO. Guidelines for the Evaluation of Probiotics in Food; Management Service FAO: London, ON, Canada, 2002.
11. Ahrné, S.; Nobaek, S.; Jeppsson, B.; Adlerberth, I.; Wold, A.E.; Molin, G. The normal Lactobacillus flora of healthy human rectal
and oral mucosa. J. Appl. Microbiol. 1998, 85, 88–94. [CrossRef]
12. Mangell, P.; Lennernäs, P.; Wang, M.; Olsson, C.; Ahrné, S.; Molin, G. Adhesive capability of Lactobacillus plantarum 299v is
important for preventing bacterial translocation in endotoxemic rats. Apmis 2006, 114, 611–618. [CrossRef] [PubMed]
13. Osman, N.; Adawi, D.; Ahrné, S.; Jeppsson, B.; Molin, G. Endotoxin- and d-galactosamine-induced liver injury improved by the
administration of Lactobacillus, Bifidobacterium and blueberry. Dig. Liver Dis. 2007, 39, 849–856. [CrossRef] [PubMed]
14. Canaviri-Paz, P.; Oscarsson, E.; Håkansson, Å. Autochthonous microorganisms of white quinoa grains with special attention to
novel functional properties of lactobacilli strains. J. Funct. Foods 2021, 84, 104586. [CrossRef]
15. Ricci, A.; Allende, A.; Bolton, D.; Chemaly, M.; Davies, R.; Fernández Escámez, P.S. Update of the list of QPS-recommended
biological agents intentionally added to food or feed as notified to EFSA 8: Suitability of taxonomic units notified to EFSA until
March 2018. EFSA J. 2018, 6–14. [CrossRef]
16. Vera-Pingitore, E.; Jimenez, M.E.; Dallagnol, A.; Belfiore, C.; Fontana, C.; Fontana, P. Screening and characterization of potential
probiotic and starter bacteria for plant fermentations. LWT Food Sci. Technol. 2016, 71, 288–294. [CrossRef]
17. Karlsson, C.L.J.; Önnerfält, J.; Xu, J.; Molin, G.; Ahrné, S.; Thorngren-Jerneck, K. The microbiota of the gut in preschool children
with normal and excessive body weight. Obesity 2012, 20, 2257–2261. [CrossRef]
18. Karlsson, C.L.J.; Molin, G.; Fåk, F.; Johansson Hagslätt, M.L.; Jakesevic, M.; Håkansson, Å. Effects on weight gain and gut
microbiota in rats given bacterial supplements and a high-energy-dense diet from fetal life through to 6 months of age. Br. J. Nutr.
2011, 106, 887–895. [CrossRef]
19. Oscarsson, E.; Håkansson, Å.; Andrén Aronsson, C.; Molin, G.; Agardh, D. Effects of Probiotic Bacteria Lactobacillaceae on the
Gut Microbiota in Children with Celiac Disease Autoimmunity: A Placebo-Controlled and Randomized Clinical Trial. Front.
Nutr. 2021, 8, 354. [CrossRef]
20. Oscarsson, E.; Wahlgren, M.; Agardh, D.; Håkansson, Å. Advances in Applied and Pharmaceutical Sciences Journal Individual
Differences of Bacterial Degradation of Starch In The Upper Gastrointestinal Tract Evaluated in A Modified In Vitro Model. AAPS
2018, 2, 31–38.
21. Marungruang, N.; Tovar, J.; Björck, I.; Hållenius, F.F. Improvement in cardiometabolic risk markers following a multifunctional
diet is associated with gut microbial taxa in healthy overweight and obese subjects. Eur. J. Nutr. 2018, 57, 2927–2936. [CrossRef]
22. Charalampopoulos, D.; Pandiella, S.S.; Webb, C. Growth studies of potentially probiotic lactic acid bacteria in cereal-based
substrates. J. Appl. Microbiol. 2002, 92, 851–859. [CrossRef] [PubMed]
23. Guarner, F.; Khan, A.; Garisch, J. Probiotics and Prebiotics: World Gastroenterology Organization Global Guidelines. 2011.
Available online: http://www.worldgastroenterology.org/assets/export/userfiles/Probiotics_FINAL_20110116.pdf (accessed on
14 September 2021).
24. Hill, C.; Guarner, F.; Reid, G.; Gibson, G.R.; Merenstein, D.J.; Pot, B. Expert consensus document: The international scientific
association for probiotics and prebiotics consensus statement on the scope and appropriate use of the term probiotic. Nat. Rev.
Gastroenterol. Hepatol. 2014, 11, 506–514. [CrossRef] [PubMed]
25. Verdenelli, M.C.; Silvi, S.; Cecchini, C.; Orpianesi, C.; Cresci, A. Influence of a combination of two potential probiotic strains,
Lactobacillus rhamnosus IMC 501® and Lactobacillus paracasei IMC 502® on bowel habits of healthy adults. Lett. Appl. Microbiol.
2011, 52, 596–602. [CrossRef]
26. Dassi, E.; Ballarini, A.; Covello, G.; Abura’ed, A.; Anderle, M.; Asnicar, F. Enhanced microbial diversity in the saliva microbiome
induced by short-term probiotic intake revealed by 16S rRNA sequencing on the IonTorrent PGM platform. J. Biotechnol. 2014,
190, 30–39. [CrossRef]
27. Dassi, E.; Ferretti, P.; Covello, G.; Speccher, A.; Migazzi, A.; Bosco, B. The short-term impact of probiotic consumption on the oral
cavity microbiome. Sci. Rep. 2018, 8, 2–9. [CrossRef] [PubMed]
28. Wu, G.D.; Chen, J.; Hoffmann, C.; Bittinger, K.; Chen, Y.; Keilbaugh, S.A. Linking Long-Term Dietary Patterns with Gut Microbial
Enterotypes. Science 2011, 334, 105–109. Available online: http://www.pubmedcentral.nih.gov/articlerender.fcgi?artid=336838
2&tool=pmcentrez&rendertype=abstract (accessed on 14 September 2021). [CrossRef]
29. David, L.A.; Maurice, C.F.; Carmody, R.N.; Gootenberg, D.B.; Button, J.E.; Wolfe, B.E. Diet rapidly and reproducibly alters the
human gut microbiome. Nature 2014, 505, 559–563. [CrossRef] [PubMed]
30. Hansen, T.H.; Kern, T.; Bak, E.G.; Kashani, A.; Allin, K.H.; Nielsen, T. Impact of a vegan diet on the human salivary microbiota.
Sci. Rep. 2018, 8, 5847. [CrossRef]
31. Acuña-Amador, L.; Barloy-Hubler, F. Porphyromonas spp. have an extensive host range in ill and healthy individuals and an
unexpected environmental distribution: A systematic review and meta-analysis. Anaerobe 2020, 66, 102280. [CrossRef] [PubMed]
32. Matijašić, B.B.; Obermajer, T.; Lipoglavšek, L.; Grabnar, I.; Avguštin, G.; Rogelj, I. Association of dietary type with fecal microbiota
in vegetarians and omnivores in Slovenia. Eur. J. Nutr. 2014, 53, 1051–1064. [CrossRef]Nutrients 2021, 13, 3318 14 of 14
33. Liszt, K.; Zwielehner, J.; Handschur, M.; Hippe, B.; Thaler, R.; Haslberger, A.G. Characterization of bacteria, Clostridia and
bacteroides in Faeces of vegetarians using QPCR and PCR-DGGE fingerprinting. Ann. Nutr. Metab. 2009, 54, 253–257. [CrossRef]
[PubMed]
34. Tomova, A.; Bukovsky, I.; Rembert, E.; Yonas, W.; Alwarith, J.; Barnard, N.D. The effects of vegetarian and vegan diets on gut
microbiota. Front. Nutr. 2019, 6, 47. [CrossRef] [PubMed]
35. Sun, H.; Chen, Y.; Cheng, M.; Zhang, X.; Zheng, X.; Zhang, Z. The modulatory effect of polyphenols from green tea, oolong tea
and black tea on human intestinal microbiota in vitro. J. Food Sci. Technol. 2018, 55, 399–407. [CrossRef] [PubMed]You can also read