Employment Analysis - Wellington Regional Growth Framework
←
→
Page content transcription
If your browser does not render page correctly, please read the page content below
Employment Analysis

October 2020

               Wellington Regional Growth Framework |   0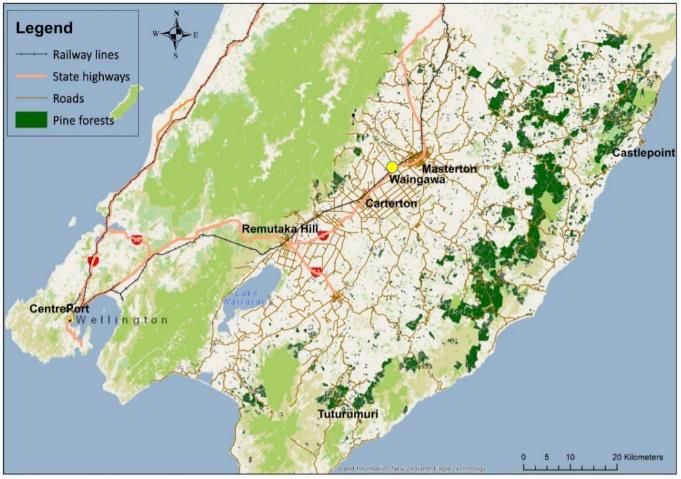
Introduction
Ka ora te wai             If the water is healthy
                                                          Purpose of this report
Ka ora te whenua          the land will be nourished                                                               More detailed work, than has been undertaken in the
                                                          The purpose of this report is to summarise existing
Ka ora te whenua          If the land is nourished                                                                 Framework, will need to be undertaken to
                                                          research and data to assist with regional spatial
Ka ora te tangata         the people will be provided                                                              understand in more detail:
                                                          planning. No new analysis has been undertaken. This
                         for                                                                                       1. How many jobs do we expect in each
                                                          report should be read as an input into other work,
                                                                                                                       geographical area as of 2050?
                                                          and not as a final conclusion on the spatial direction
                                                                                                                   2. What change is that from the current situation?
Mo te iti - mo te rahi   For the little - for the large   for the Framework or as policy for any of the partner
                                                                                                                   3. What type of jobs are they?
                                                          organisations.
                                                                                                                   4. What do we need to do to make this change?
As outlined in the Foundation Report1 for the
Wellington Regional Growth Framework (the                 This report builds upon the Foundation Report to
Framework), employment in the region2 is                  provide background information to assist in analysing
concentrated in central Wellington and a significant      employment patterns and information and
number of commuters travel into central Wellington        determine what changes may/could occur with
from other parts of the region for employment.            regards to employment and the Framework.

Regional employment is dominated by knowledge-            A key direction during development of the
based sector employment. With these jobs typically        Framework with regards to employment has been to
working conventional hours, a large number of             ensure that Wellington Central remains as the core
people want to travel into and out of central             place of employment for the region but also that
Wellington at the same time each day.                     employment is more dispersed so people can work
                                                          closer to where they live.
There are a number of other major employment
centres in the western and eastern corridors and a        This direction will impact on a number of things such
number of smaller regional service towns in Kāpiti,       as changes to transport patterns and demand,
Horowhenua and the Wairarapa. All of these are            lowering carbon emissions, creating nodes and major
serviced by the rail and State Highway networks.          centres with housing and employment options and
                                                          providing reduced travel time (and therefore
                                                          increased social time) for workers.

1
 WRGF Foundation Report 2020                              Masterton, Carterton, South Wairarapa, Upper Hutt,       refers to this geographic areas, whereas data
2
 For the purpose of the Framework and this report,        Lower Hutt, Wellington, Porirua, Kāpiti Coast and        references that refer to the “Wellington region”
the region includes the territorial authorities of        Horowhenua. Note: Data referencing “the region”          exclude Horowhenua.

                                                                 Wellington Regional Growth Framework | 1
Contents
Introduction ................................................................................................................................................................................................................. 1
Current regional employment trends .......................................................................................................................................................................... 1
Geographical extent ..................................................................................................................................................................................................... 5
Employment related journeys ..................................................................................................................................................................................... 8
Employment specific challenges and opportunities .................................................................................................................................................. 12
Employment projections............................................................................................................................................................................................ 17
Appendix A – Shared evidence base .......................................................................................................................................................................... 21

                                                                                       Wellington Regional Growth Framework | 2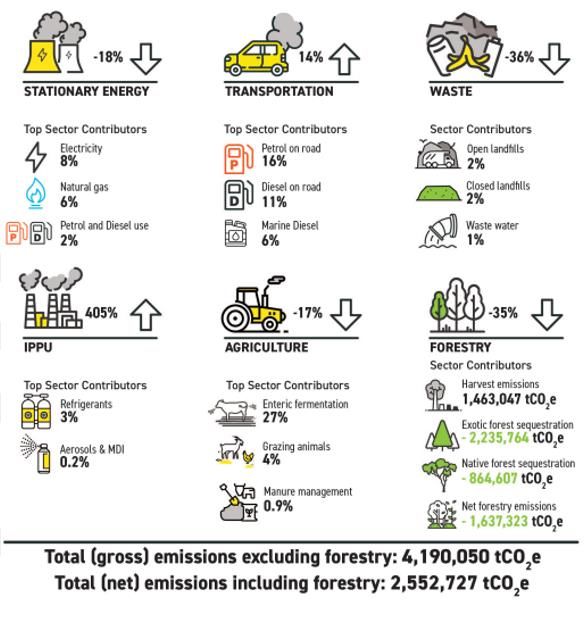
Current regional employment trends
                                                                                                                        Diagram 1: Top 5 Employment
How many people are employed in                         Education qualifications are one of the most                    Sectors (Wellington region only)
the region?                                             important indicators of socio-economic status.
In 2019, 302,802 people living in the region were
employed3.                                              Analysis of the qualifications of the population in the
                                                        Wellington region in 2018 compared to the North
The number of employed people in the Wellington         Island shows that there was a higher proportion of
region increased by 40,188 between 2013 and 2018.       people holding formal qualifications [Higher degrees,
In 2018, 78.7% of employed people living in the         Bachelor degrees and Post School (excluding
Wellington region were employed full-time and           university) qualifications], and a lower proportion of
21.3% part-time4. Over the same period (2013-2018)      people with no formal qualifications8. Incomes are
the number of employed people in Horowhenua             generally highest in Wellington city9.
increased by 9005. 75.4% of employed people living in
Horowhenua were employed full time and 24.6%            Analysis of individual income levels in the Wellington
part-time in 20186.                                     region in 2018 compared to the North Island shows
                                                        that there was a similar proportion of persons earning
                                                        a high income (those earning more than $70,000 per
What kinds of employment?                               annum) and a lower proportion of low income
Over half of the workforce in the region is employed    persons (those earning less than $15,000 per
in knowledge intensive sectors. The Wellington          annum).10 The median income in Horowhenua was
region possesses a highly skilled population and has    less than $23,900 in 201811.
proximity to business and innovation resources
including the government, research, and education       By employment, the five largest industries in the
sectors. In addition, advanced manufacturing, one of    Wellington region (year-end March 2018) are shown
the main technology hubs for New Zealand and a          in Diagram 1.12
large proportion of the country’s creative sector are
based here7.

3                                                       7                                                         11
  Infometrics (Horowhenua and Wellington region)          Deloitte                                                     StatsNZ 2018
4                                                       8                                                         12
  Profile ID – GWRC Industries                            Profile ID GWRC qualifications                               Arataki Wellington regional summary
5                                                       9
  Infometrics (Horowhenua)                                HBA Regional Summary
6                                                       10
  StatsNZ 2018                                             Profile ID GWRC qualifications individual incomes

                                                               Wellington Regional Growth Framework | 1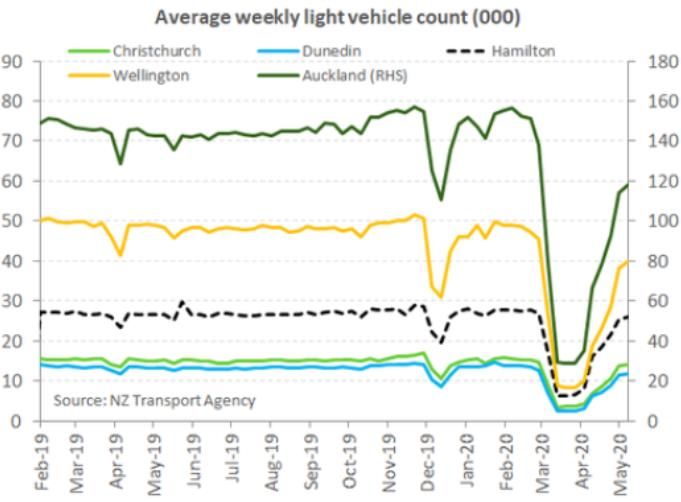
By GDP, the five largest industries in the Wellington   Diagram 2     Top 5 employment
region are:                                             industries (Horowhenua)15                                   Analysis undertaken as part of the ‘Wellington
• Professional scientific and technical services                                                                    Regional Investment Plan - 2019’ with regards to the
• Public administration and safety                                                                                  industries within the Wellington region identified
• Financial and insurance services
• Health care and social assistance
                                                                                15.4%                               that:
                                                                                                                    • The high importance of government,
                                                                                AGRICULTURE,
• Information media and telecommunications.                                     FORESTRY AND                            professional services, finance and ICT for
                                                                                FISHING                                 Wellington City is singular for a territorial
By GDP, the five largest industries in the Horowhenua                                                                   authority area in New Zealand.
                                                                                                                    • The industry mixes for Lower Hutt, Upper Hutt,
District are13:
• Agriculture, forestry and fishing                                    12.5%                                            Porirua, and Kāpiti Coast are quite typical for
• Electricity, Gas, Water and Waste services                           MANUFACTURING                                    urban centres in New Zealand. They all include
• Manufacturing                                                                                                         amongst others, manufacturing and construction
• Rental, hiring and real estate services
• Construction
                                                                                11%                                     industries.
                                                                                                                    • The report noted that the importance of health
                                                                                RETAIL TRADE                            services to the Kāpiti Coast is unusual given its
Industries with the most growth between 2013 and                                                                        lack of a hospital, and probably reflects its higher
2018 (resident population in the Wellington region)                    10.5%                                            age structure.
                                                                                                                    • The industry mixes for the Wairarapa districts are
were for those employed in:                                            HEALTH CARE AND SOCIAL
• Public administration and safety (+8,433                             ASSISTANCE                                       reasonably typical for rural-based districts in
    persons)                                                                                                            New Zealand. The high importance of health in
• Professional, scientific and technical services                                                                       Masterton reflects the location of the hospital
    (+8,130 persons)                                                            9.7%                                    there.
• Construction (+6,285 persons)                                                 CONSTRUCTION
                                                                                                                    Wellington is home to a large and thriving software
• Accommodation and food services (+4,911
                                                                                                                    development industry, and the region has a high
    persons)14.
                                                        Industries which created the most jobs                 in   proportion of employees in other knowledge-
                                                        Horowhenua between 2009 and 201916:                         intensive industries, from ICT to financial and
By employment, the five largest industries in
                                                        • Health Care and Social Assistance (+205)                  insurance services.
Horowhenua (2019) are shown in Diagram 2.
                                                        • Other Services (+161)
                                                        • Public Administration and Safety (+126)                   In 2015, the Wellington region had the highest
                                                        • Wholesale Trade (+97)                                     proportion of information and communications
                                                        • Construction (+95)                                        technology employment (ICT) in New Zealand17.

13                                                      15                                                          17
     Infometrics (Horowhenua)                                Infometrics (Horowhenua)                                    NZIER 2015
14                                                      16
     Profile ID – GWRC Industries                            Infometrics (Horowhenua)

                                                                  Wellington Regional Growth Framework |   2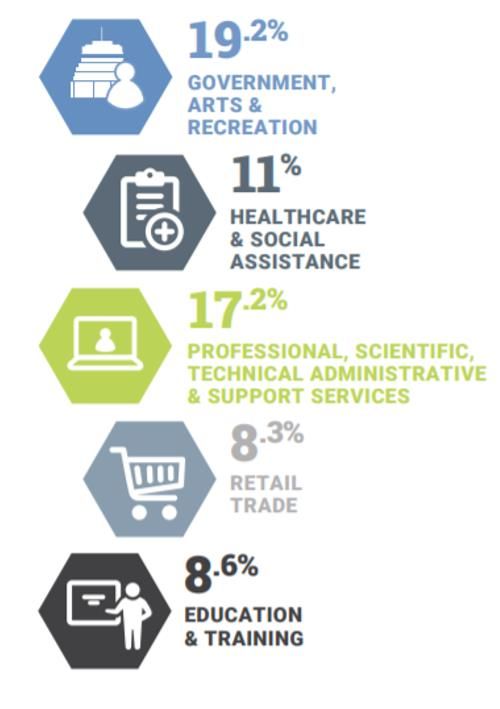
Wellington is home to a number of software and            past few decades. There is a strong relationship         Māori make up 11% of the labour force of the
technological companies who have been                     between food and (mostly domestic) tourism in the        Wellington region. The Māori labour force of Porirua
internationally recognised for their rapid growth.        region21.                                                City is particularly large, making up almost one fifth
                                                                                                                   of the labour force of the city. The lowest proportion
The film industry has also agglomerated in Wellington                                                              of the labour force that are Māori is in Wellington
and generates 60% of the gross revenue generated by       Māori economy                                            City, with only 7% of the labour force being Māori.
production and post production of feature films in        The Māori economy is an (integrated) subset within
New Zealand18.                                            the broader regional economy and cannot be seen in       Māori in the Wellington region generate an income
                                                          isolation. It encompasses all people, entities and       from salaries and wages of $1.2 billion per annum.
43.5% of the public service workforce is located in the   enterprises that self-identify as Māori.                 However, overall Māori earn significantly less than
Wellington region. This represented 23,662 full time                                                               the regional average. 30% of Māori in the region are
employment (FTE) jobs in 2019. However, when              In 2018, Māori made up almost 24.5% of the               employed in high-skill jobs, compared to 47% for non-
including wider state sector employment (including        population in Horowhenua, with over half aged under      Māori.
education, health, public sector, state owned             26 years.22 While participation of Māori over 15 years
enterprises, local government employment) the             in the labour force in Horowhenua was higher than        Notably lower home ownership rates constrained the
region accounts for just 11.5% of national public         the district average (65.8% compared to 58.1%), the      ability of Māori to enter into self-employed or SME
sector employment (or 262,900 employees).19               unemployment rate for Māori was double the district      business enterprise.
                                                          average in 2018 (9.6% compared to 4.8%). 46% of
The government’s Ultra-Fast Broadband (UFB)               Māori in Horowhenua have an average income of            Nearly 60% of Māori in the Wellington region are
programme and Rural Broadband Initiative (RBI) are        $20,000 or less.                                         aged under 30 years old.
recognised critical drivers of productivity growth and
employment. As of March 2020, 46% of premises             The most common occupations for Māori in the             Within the Wellington region there are significant
within the Wellington region with access to UFB have      Horowhenua District is as a labourer (21.7%) and         differences in the level of qualification of the Māori
connected. 45% of target households or businesses         community or personal service workers (16.5%).           workforce between the eight Territorial Authorities.
for RBI2 have access20. There are however gaps in         There is a notable difference in the most common         Wellington City has the highest proportion of Māori
provision of ultra-fast broadband, particularly in the    occupations for Māori in Horowhenua by sex. 23           with a bachelor’s degree and post graduate
Wairarapa and Horowhenua.                                                                                          qualifications. Masterton, Carterton and South
                                                          A 2018 report for GWRC24 (excluding Horowhenua)          Wairarapa District have the highest proportion of the
Employment in the regional economy is diversified         found Māori business thriving, with a strong presence    Māori workforce with no qualifications.
through the strength of the food bowls of the             in film, technology and business services.
Wairarapa and Horowhenua. Winemaking and                                                                           More than one third of working Māori in the
brewing have also increased in importance over the        Māori owned entities play a key role in commercial       Wellington region are employed in the social services
                                                          property, housing and social developments.

18                                                        21                                                       24
  StatsNZ Screen industry: 2017/18                           Deloitte 2019                                              BERL 2018
19                                                        22
   SSE 2018                                                  StatsNZ 2018
20                                                        23
   MBIE quarterly connectivity update (2020)                 StatsNZ 2018

                                                                  Wellington Regional Growth Framework |   3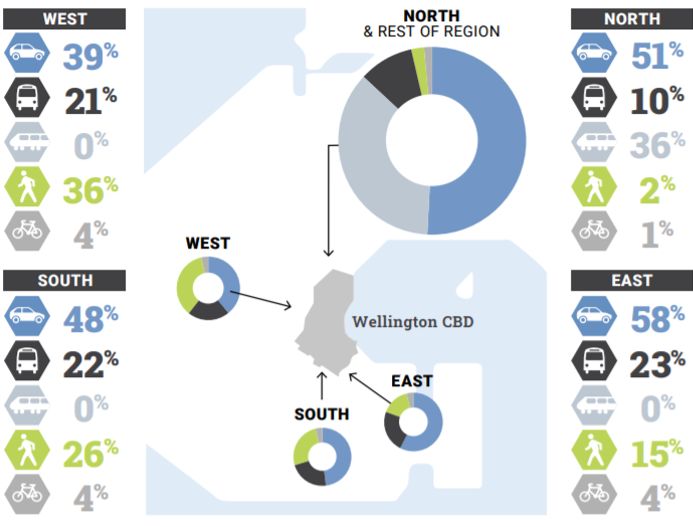
sector and half the working Māori work in retail trade
and business services.

Some of the project partners have recently
participated in developing "Te Matarau a Mauī:
Collaborative pathways to prosperous Māori Futures
in Te Upoko o Te Ika". There are a number of actions
in that plan that are relevant for the Framework, in
particular, Iwi, Māori collectives and Māori business
growth and Investing in education, training and
employment for Māori.

                                                         Wellington Regional Growth Framework |   4
Geographical extent                                                                Diagram 3 Number of employees by area unit 2013

Where do we live?
The presence of employment opportunities is a key
driver of migration and where people choose to live.

Most of the region’s population lives in its four
cities, which are home to over 75% of the total
population. This trend is projected to continue
through to 203825.

Where do we work?
Most of the region’s residents (who are employed)
work within the region. At the time of the 2018
census just 0.8% of the region’s population
primarily travelled outside of the region for
employment26.

The economic reach of the Wellington region
extends to Horowhenua and beyond. In 2018,
approximately 12.3% of the workers employed
within the region lived outside of the region27.

49.6% of the people who are employed and living in
the Wellington region work in Wellington City (in
both full and part time employment). 24.9% of
these workers commute to the city, primarily from
Lower Hutt, Porirua, Upper Hutt and the Kāpiti
Coast28.

25                                                     27                                                     28
     StatsNZ                                                Profile ID – GWRC workers                          Profile ID – Wellington workers and Profile ID –
26
     Profile ID – GWRC residents                                                                              GWRC employment status

                                                                 Wellington Regional Growth Framework |   5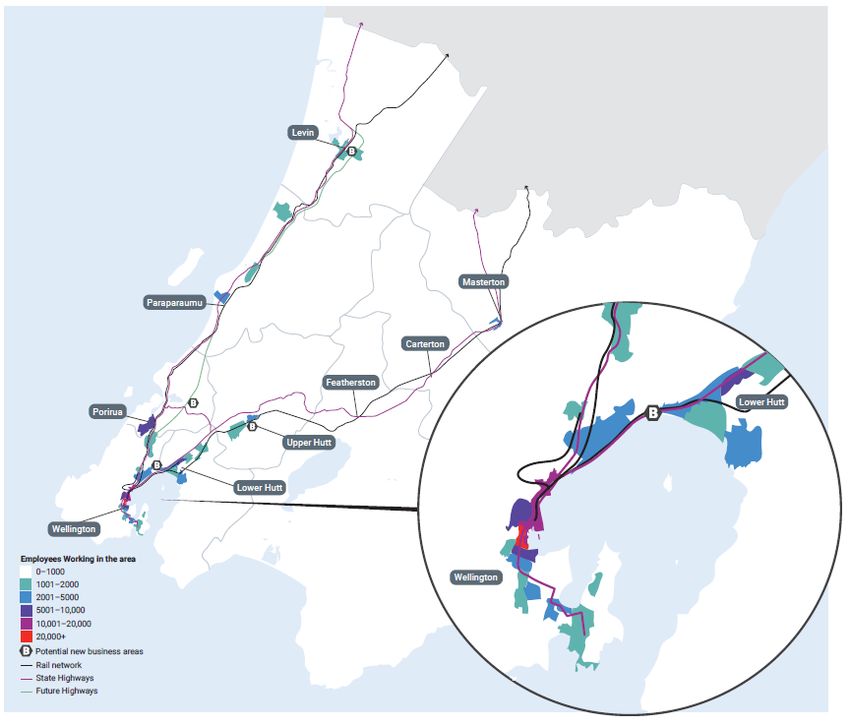
Wellington City is the main regional employment           design studio, post production facilities, camera and
centre29. During the work week Wellington City            lighting equipment hire businesses and Victoria
supports an additional 82,000 commuters30.                University’s Miramar Creative Centre. More than
Despite a much smaller regional workforce, central        2,000 Weta Group employees, clients, contractors,
Wellington employs just 4000 fewer employees              and crew work on the Peninsula, and Weta Digital
than central Auckland31. More than a quarter of           are one of the largest employers in Wellington City.
Wellington City centre employment is public sector.
                                                          Other large regional employers such as our
There are a number of other major employment              hospitals, schools and education facilities, result in
centres in the western and eastern transport              workers largely based in fixed locations within the
corridors and a number of smaller regional service        region. The percentage of employees who can work
towns in Kāpiti, Horowhenua and the Wairarapa.            from home by industry, as estimated by Infometrics,
Diagram 3 highlights that jobs are centred within         is represented in diagram overleaf33.
the region’s city and town centres and particularly
in Wellington City.

All of these centres are serviced by the rail and State
Highway networks and have significant numbers of
commuters traveling to central Wellington regularly
for employment (with the exception of
Martinborough).

There has been a growth recently in flexible
workspaces in the region, with 12 co-working
spaces located in cities and towns across the
region32.

Some employment hubs are located outside of the
region’s centres. The Wellington film industry has
agglomerated on the Miramar peninsular and is
home to one of the world's premier visual effects
companies, sound stages, manufacturing and

29                                                        31                                                       33
     HBA regional summary                                  Deloitte 2019                                                Infometrics April 2020
30                                                        32
     Productivity Commission 2019                          Wellington NZ

                                                                  Wellington Regional Growth Framework |   6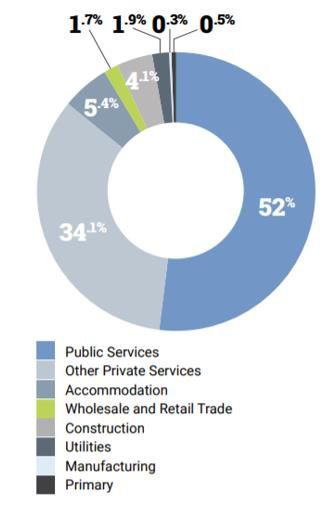
Diagram 4 Percentage of employees able to work from home by industry

                                                                     Industry

            ACCOMMODATION AND FOOD SERVICES

                                OTHER SERVICES

                                  RETAIL TRADE

             AGRICULTURE, FORESTRY AND FISHING

                                 CONSTRUCTION

                  ARTS AND RECREATION SERVICES

           TRANSPORT, POSTAL AND WAREHOUSING

                               MANUFACTURING

             HEALTH CARE AND SOCIAL ASSISTANCE

                                        MINING

                       EDUCATION AND TRAINING

    ELECTRICITY, GAS, WATER AND WASTE SERVICES

                              WHOLESALE TRADE

       RENTAL, HIRING AND REAL ESTATE SERVICES

             PUBLIC ADMINISTRATION AND SAFETY

PROFESSIONAL, SCIENTIFIC AND TECHNICAL SERVICES

          ADMINISTRATIVE AND SUPPORT SERVICES

              FINANCIAL AND INSURANCE SERVICES

  INFORMATION MEDIA AND TELECOMMUNICATIONS

                                                  0%           10%              20%          30%   40%   50%   60%   70%

                                                  Wellington Regional Growth Framework | 7
Employment related journeys
Diagram 6 shows the proportion of regional jobs
The concentration of regional employment in Diagram 5 demonstrates the mode of travel into the accessible by different transport modes within a 45
Wellington City, coupled with the dominance of the Wellington CBD. More than half the commuter minute travel time.
knowledge-based sector working conventional hours, movements coming into Wellington City are made by
results in a large number of people want to travel into car. Diagram 6 Access to percentage of
and out of central Wellington at the same time. regional jobs by different modes
Diagram 5 Morning peak transport into
This creates a significant and concentrated peak Wellington CBD by area of origin and
commuter demand on main transport corridors,
creating significant travel time delays and unreliable
mode (2016)
journeys.
Table 1 from the 2013 census journey to work data
gives a sense of the scale of commuter movements
within, into and out of each district.
Table 1: Journey to work movements
within, into and out of each district 2013
Council area Within Into Out of
Wellington 81,306 29,574 5,022
City
Hutt City 21,837 7,965 13,659
Porirua City 7,434 3,459 9,030
Upper Hutt 6,828 987 7,545
City As highlighted in the Foundation Report, significant
Kapiti Coast 10,668 531 5,334 commuter travel at peak times, limited west-east
District transport connectivity across the region, and capacity
Wairarapa 14,424 21 1,143 constraints on the state highway, local roads and
Councils public transport, create significant travel time delays
Horowhenua 7,395 255 1,317 and unreliable journey times for freight, private
District vehicles and bus services.
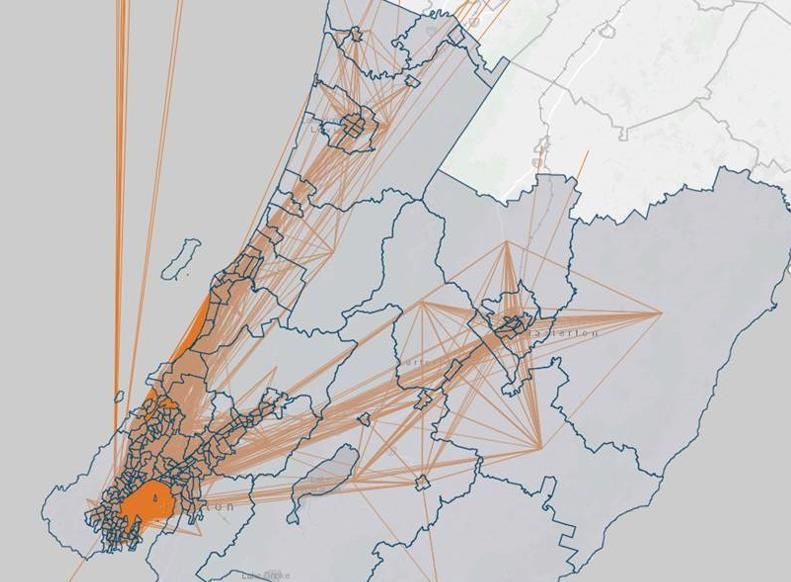
Wellington Regional Growth Framework | 8Diagram 7 summarises spatially the 2013 journey to Diagram 7 Journey to work movements within the region 2013
work movements within the region. This highlights
the significant flows into central Wellington and the
importance of Wellington City as an employment
centre within the region.
This diagram also indicates how self-sufficient the
region is in terms of its labour market, with very few
journeys to work (proportionally) starting from
outside of the region.
Freight movements
The region has a number of existing key freight hubs
and destinations including central Wellington City,
CentrePort, Seaview/Gracefield, Porirua/Tawa and
Waingawa. Access to CentrePort, and the safety and
reliability of road and rail corridors north of
Wellington are critical to supporting journeys
between these destinations.
The tables overleaf demonstrate data from the
Ministry of Transport’s October 2019 National Freight
Demand Study34. These show that most goods
produced within the region, but not exported, are
consumed within the region or the lower half of the
North Island.
One quarter of movements of horticultural products
in the Wellington region originate from the Auckland
region. 58.3% of meat and meat product movements
originate from the mid-lower North Island. Similarly,
57.1% of livestock movements in the Wellington
region come from other regions35.
34 35
MoT National Freight Demand Study 2017/18 Stock slaughter carried out in Wellington region as Beef cattle: 3.7%, Lambs: 5.3%, Other Sheep: 5.5%
a percentage of the national total: Dairy cattle: 1.5%, and Deer 1.3%.
Wellington Regional Growth Framework | 9Between 2012-2018 there was a 64% growth in Other 0.16 2.9% Wellington Timber Wgtn 0.04 1.1%
horticultural production in the region and a 9% drop agricultural million (88%) and products region million
in liquid milk production. products tonnes Manawatu- tonnes
Wanganui Meat and meat Wgtn 77 8.2%
Aggregates 1533 4.2% Wellington products seaport million
Table 2: Movement of produced goods million tonnes
from the Wellington region (2018) tonnes Horticultural Wgtn 0.005 >1%
Fertiliser 0.18 1.8% Wellington, produce Seaport tonnes
Goods Quantit % of Destination million Manawatu- Wool Wgtn 0.02 7.14%
y national tonnes Wanganui region million
total and Taranaki tonnes
Scrap steel Wgtn 64.6 10.5%
Liquid milk 0.28 1.3% Manawatu-
Approximately 10.5 million tonnes of cargo is handled region million
production billion Wanganui
by CentrePort on an annual basis, including tonnes
litres
interisland volumes. Scrap Wgtn 6.7 12.7%
Log harvest 1.03 3% Wellington
aluminum region million
million port (94%)
tonnes
tonnes manawatu- There was a 118% growth in log exports from the
wanganui Other Wgtn 0.03 1.8%
Wellington seaport between 2012 and 2018. 0.7 manufactured Seaport million
(6%) million tonnes of these logs originated from and retail tonnes
Timber 0.54 5.4% Various Manawatu-Wanganui. Over the same period (2012- goods
products million north island
2018) there was a significant decline in fish exports.
tonnes destinations
Meat and 0.04 3.6% Wellington
meat million Table 3: Export of goods from Wellington
products tonnes (2018)
Livestock 0.15 2.7% Wellington,
million Manawatu- Goods Origin Tonnag % National
tonnes Wanganui,
e total
Hawkes Bay
and Taranaki. Dairy Wgtn 0.07 2.2%
Wool 7699 5.5% Hawkes Bay Seaport million
tonnes and Auckland tonnes
Fish 0 - - Logs Wgtn 1,314 6.4%
Seaport million
Horticultural 18 0.7% Wellington
tonnes
products million and
tonnes Manawatu-
Wanganui
Wellington Regional Growth Framework | 10Freight movements in the region are also generated Diagram 8: Wairarapa pine forests relative to CentrePort and Waingawa
by imports. Imports include 0.01 million tonnes of
manufactured timber products (1.3% national total)
7.4 million tonnes of imported meat and meat
products, 0.16 million tonnes of other manufactured
and retail goods and 1.18 tonnes of petroleum.
Road transport is the highest carbon emitting activity
within the transport sector for the Wellington region.
Between 2001 and 2019 road, air and marine
transport emissions have all been trending
upwards36. Work is underway to reduce the carbon
intensity of regional transport associated with freight.
New Zealand Green Investment Finance has
announced a green credit facility of $15 million for
CentrePort. This fund will be used exclusively to fund
low carbon projects to reduce CentrePort’s carbon
footprint. This may include the introduction of
electric vehicles, on-site renewable energy
generation and energy efficiency upgrades37.
In 2019, the volume of logs handled by CentrePort
increased to 1.7 million tonnes. Many of these logs
have historically been transported to the port from
the Wairarapa by road. Diagram 8, from a BERL report
on the cost savings of the Waingawa log hub, shows
the location of pine forests in the Wairarapa relative
to the location of CentrePort38. Over the last three
years the log hub has been developed at Waingawa plans for additional ‘log hubs’ in Woodville and result in savings of $5.5 million a year, as well as
to transfer Wairarapa logs onto rail for the haul to Marton. BERL’s study39 which estimates that shifting reducing externality costs (emissions, road accidents,
CentrePort. CentrePort have recently announced 357,000 tonnes of logs a year from road to rail would congestion and damage to roads).
36 39
AECOM 2020 BERL Feb 2020
37 38
NZGIF 2020 BERL Feb 2020
Wellington Regional Growth Framework | 11Employment specific challenges and opportunities
well. Examples of technology changes which are
15-24-year cohort NEETs Deprivation and access anticipated to result in business and social
Studies show that in some areas in the region there Whilst the region overall has a highly productive transformations in the near future include smart cars
are high numbers of youth (15 to 24 year olds) not in workforce and high average household incomes, this and green energy transformations.45
employment, education, training (NEET). is not consistent across the region and can be an issue
for those areas where wage levels are not keeping up While advances in technology may displace certain
For the Wellington region, the figure in March 2020 in a region where the cost of housing is increasing. types of jobs, historically they have also resulted in
was 14.3%. This was an increase of 2.3% when net job increases.
compared to the same quarter last year (March 2019 There are communities across the region with high
quarter), and is slightly higher than the national levels of deprivation. These communities also often The flexibility of the regional economy will determine
average of 14% (also up 2.3% from March 2019 have poorer access to employment. Unemployment how well we can respond to disruptive technologies
quarter).40 Latest figures from June 2020 show the rates in areas of high deprivation, such as Cannons and capitalise on opportunities made, whilst
NEET rate at 9.2%, which is 1% higher than for June Creek in Porirua and Taita in Lower Hutt, are higher successfully managing the associated risks and
last year.41 than the national average44. challenges.46
For Horowhenua, 20.4% of 15-24 year olds were NEET Disruptive technologies
46% of New Zealand jobs are at risk of automation
Greening the economy
in 2019.
The Climate Change Response (Zero Carbon)
over the next two decades. Our ability to manage
Amendment Act 2019 provides a framework by which
Unemployment technological change depends on the extent to which
New Zealand can meet our Paris Agreement
Currently unemployment for the Wellington region is we adapt to the changes fuelled by the digital
commitments. It includes a legally binding
at 4.1% (up 0.7% from the same quarter last year). economy.
commitment to living within 1.5 degrees Celsius of
This is slightly higher than the national average of 4%.
global warming and sets up a framework of five-year
Unemployment rates for Māori in the Wellington While the number of jobs at risk within the
emissions budgets to meet long term carbon
region were 4.6% in June 2020 (down 2.8% from June Wellington region are significantly lower than for
emission reduction targets.
last year). 42 other regions, the number of jobs at risk of
automation is estimated at more than 95,000. So far
In the 2018/19 reporting year, the Wellington region
The average unemployment rate in Horowhenua was automation has impacted the most on blue-collared
(excluding Horowhenua) emitted gross 4,190,050
5.5% in June 2020, down from 6.2% the previous employment. However, the coming wave of
tCO2e. The breakdown of emission sources is shown
year43. innovation threatens to upend white-collar work as
40 43 46
MBIE Labour Market Snapshot March 2020 Infometrics June 2020 NZIER October 2015
41 44
MBIE Labour Market Snapshot June 2020 Arataki Version 1.1 Wellington regional summary
42 45
MBIE Labour Market Snapshot June 2020 NZIER October 2015
Wellington Regional Growth Framework | 12in the diagrams below taken from the Wellington
Region Greenhouse Gas Inventory May 2020. 49
Diagram 10: Wellington regional GHG emissions by Type
Diagram 9: Wellington regional sources of
Greenhouse Gas emissions47
The biggest emitting districts in the Wellington region
are Wairarapa and Wellington City, with each area
emitting 41% and 25% of total gross emissions
respectively (or 1,734,320 tCO2e and 1,061,383 tCO2e
respectively).
Total gross emissions in Horowhenua in 2018/2019
were 819,053 tCO2e. This is the third largest
emissions profile in the region. The largest source of
GHG emissions in Horowhenua is Agriculture and
Transportation 48.
47 48 49
AECOM 2020 AECOM 2019 AECOM 2020
Wellington Regional Growth Framework | 13Diagram 11: Wellington regional GDP Emissions reductions, electrification of the regional
Transport (road, rail, and air travel) is the biggest growth in relation to GHG emissions economy and forestry are likely to play a significant
source of emissions accounting for 40% of total gross role in our future economy.
emissions for the Wellington region. Agriculture
(2001-2019)
(emissions from cattle, pigs and sheep) is the second Reducing travel distance and using active and public
largest emitter, 34% of total gross emissions. transport modes will make a significant impact on our
Stationary Energy (consumption of electricity or regional emissions profile and may influence where
natural gas) is the third highest emitting sector in the people work in the future, with more people
region, producing 18% of total gross emissions. predicted to work from or work closer to home.
After consideration of carbon sequestration (carbon
Responding to Covid-19
captured and stored in plants or soil by forests), the
The Covid-19 pandemic has caused substantial
Wellington region emitted net 2,552,727 tCO2e
economic disruption globally. A recent analysis
emissions. Carbon sequestration reduces gross
undertaken by BERL on behalf of Greater Wellington
emissions by 1,637,323 tCO2e, a 39% reduction. Most
Regional Council assesses three scenarios for the
sequestration, 84% occurs in the Wairarapa district.
Covid-19 recovery for the Wellington region (a best
case, mid case and worst-case scenario out to
Transport emissions and industry emissions both
2030)51.
increased between 2001 and 2019, by 14% and 405%
respectively in the Wellington region. Within the
Peak unemployment for the Wellington region
transport sector road emissions from petrol and
between the three scenarios ranges from 6.3% (best
diesel use increased by 8% from 2001 to 2019. In the
case) to 11% (worst case); compared to the base 2020
industrial sector many emissions are caused by
level of 4.7%. Māori will be disproportionately
industrial refrigerant use which has increased by
affected by the crisis, and the worst hit industry
405% in this period50.
sectors will be accommodation and food services,
While green energy transformations have potential arts and recreational and retail trade.
As demonstrated in Diagram 11, from the AECOM to cause disruption to the regional economy and
Wellington Region Greenhouse Gas Inventory May employment, it also represents a significant All three scenarios predict that the Wellington
2020, the Wellington regional economy has started to opportunity to strengthen competitive advantages in regional economic impact of Covid-19 will be short
decouple GDP growth with GHG emissions, however green technologies and reduce the greater long term term, with employment recovering under all
the rapid rate of decoupling that is required will be costs of adaptation. scenarios by 2030: with regional full-time
significant.
employment (FTE) above pre-Covid levels.
50 51
AECOM (2020) BERL June 2020
Wellington Regional Growth Framework | 14This analysis generally reflects that shown in Waka Diagram 12: Drop reduction in vehicle
Covid-19 and the climate crisis
Kotahi’s recent update to Arataki52. This analysis count during April Covid-19 lockdown
The Covid-19 pandemic is also likely to have dramatic
shows that the Wellington region is one of just two
consequences on climate change progress. In the
main urban centres forecast to return to business as
short term the pandemic has resulted in a contraction
usual employment levels by 2031.
of the global economy and a significant restriction on
the movement of people. Global aviation volumes
This report notes that the Wellington region is
and oil demand have collapsed. Globally, GHG
comparatively well-placed to recover from the
emissions might fall by 8% or 2.6 GtCO2 in 2020 which
pandemic, as it will be shielded from the worst
is more in absolute terms than in any other year on
impacts due to the dominance of the public sector
record.53
and major professional service employment. This
report noted that there may even be an increase in
However, in the short-medium term both the
domestic migration to the Wellington region due to
economic response to the crisis and the fallout and
employment opportunities in government.
cost of the crisis response will impact on the ability of
economies to decarbonise at the pace that is
The Wellington region’s decline in overall
required. This will have lasting impacts in the long
employment is predicted to be relatively mild, with
term, as unprecedented actions are required to cut
less negative flow-on effects for consumer spending,
global emissions over the next decade. The climate
the housing market, and construction. This resilience Energy use from commercial buildings and
impact of fiscal recovery packages could either
is expected to benefit areas such as Upper Hutt, Kāpiti manufacturing and construction emissions would
reinforce economic reliance on fossil fuels or support
Coast, and parts of the Wairarapa. South Wairarapa have fallen, while residential buildings would have
decoupling of emissions from economic activity.
district is forecast to be hit harder than the rest of the increased their energy use; however overall
region due to its reliance on the tourism and electricity demand reduced during lockdown.
During lockdown, by April 10, Wellington traffic was
hospitality sectors. Māori and Pasifika, and youth, are Aviation and cruise ship emissions, both significant,
down 83.5% compared to last year (see Diagram 12
likely to experience the greatest impacts. An increase were significantly reduced by the lockdown55.
from news article Woolf, 2020). By the halfway point
in youth not in employment, education or training
of lockdown, air pollution from traffic emissions in
(NEETs) is expected. The lockdown resulted in severe economic hardship
Wellington had also dropped by 72%.54
for significant parts of the economy, as is reflected by
Both reports noted the significant levels of the recent increase in regional unemployment above.
uncertainty which remains regarding the scale and
duration of Covid-19 impacts. However, the Covid-19 lockdown provides an insight
into the scale of change that is required in the
regional economy to respond to the climate crisis.
52 53 54
Arataki Covid-19 Implications Hepburn, O’Callaghan, Stern, Stiglitz and Zenghelis Woolf 2020
55
2020 Woolf 2020
Wellington Regional Growth Framework | 15Working from home, reducing travel distances and storm or flooding events. This highlights the challenge of maintain a vibrant
using active and public transport modes may make a The need for resilience is critical not only for the Wellington economy, with Wellington City currently
significant impact on the regional GHG emissions. region but also for the nation as it is the seat of the regional centre of employment, while responding
Government and transport hub between the North to the climate crisis, the prospect of future pandemics
Resilience and employment locations and South Islands. Resilience of core infrastructure is and a local resurgence of community transmission of
The region’s geology, tectonic setting and climate key to ensuring rapid economic recovery following a Covid-19.
mean that it is prone to many hazards. Many parts of major natural hazard event.58
our urban areas are also situated in low lying coastal
areas, vulnerable to the impacts of sea level rise, or Relocation of jobs out of central
on flood plains, steep hillsides, reclaimed land, Wellington whilst keeping a strong
subject to other natural hazards56.
centre
There has been an increasing discussion regarding
All regional urban centres are subject to earthquake
relocating government jobs to other parts of the
hazards. Parts of Wellington, Lower Hutt, Upper Hutt
region to increase resilience of the public service due
and Porirua cities, and the Waikanae centre, are built
to the hazard profile of the region. 350 employees
directly over active fault rupture zones. Some key
for the Ministry of Business, Innovation and
pieces of regional infrastructure, including bulk water
Employment for example have moved into an office
supply pipelines and main transport routes also cross
space in Porirua.
over active fault rupture zones57.
The Covid-19 crisis saw an increased support for
Movement of residents, visitors and freight faces
working from home, with many staff indicating they
significant seismic and resilience risk due to the
would like to keep working from home after the
presence of natural hazards throughout the region.
lockdown (at least some of the time).59 Other
There is a heavy reliance on the western and eastern
commentators have raised concerns that if
road and rail corridors to connect people and goods
employees continue to work from home central
with employment centres, services and key hubs
Wellington would be seriously affected; particularly
including the port and airport. These transport
hospitality, cafés, hairdressers and retail stores.
corridors (road and rail) and CentrePort are located
on a series of major fault lines and/or in areas
susceptible to future sea level rise and more frequent
56 58
WRGF Constraints Report Wellington Lifelines Project
57 59
WRGF Constraints Report Hill 2020
Wellington Regional Growth Framework | 16Employment projections
A number of studies and assessments, including the infrastructure and services, and linking housing
As established in the Foundation Report60, the region Housing and Business Capacity Assessments for the to employment and essential services.
is projected to have over 100,000 additional jobs over metro areas, provide predictions in relation to future • There will be an on-going need for transport
the next 30 years. The diagram below shows the economic. business land demand and supply, services to support Covid-19 recovery by
projected share of employment growth for each activity, journeys to work and competitive improving access to employment and essential
sector. advantages for the region61. services for vulnerable communities.
Diagram 13: Share of predicted It should be noted that these studies and assessments Housing and Business Capacity
employment growth by sector 2018-2050 were written before the development of the Assessments62
Framework and we would expect initiatives and The Housing and Business Capacity Assessment
projects in the Framework to have some impact on regional economy summary shows:
some of these predictions. • The Wellington regional economy differs in
several ways from other parts of New Zealand.
Arataki - 10-year outlook • Incomes are generally higher in Wellington with
Key points are: almost half of all jobs in the region earning
• Given the relative resilience of the Wellington $60,000 or more.
regional economy, no significant changes are • The workforce is highly educated, with a greater
expected in the nature, scale and location of amount of tertiary qualifications, and a greater
transport demand over the medium to long likelihood of having a higher degree.
term. • Wellington firms have a competitive advantage
• Changes to the nature of work for professional borne of the region’s deep labour pool and high
services may see a reduction in peak trips to human capital.
central Wellington, due to more people working • In turn, firms operating in Wellington engage in
remotely. complex industries.
• Work to ensure the effective integration of land- • However there has been a relative
use and transport remains a priority, to support underperformance when compared to other
mode-shift and reductions in greenhouse gas centres and the national growth rate.
emissions. This includes sequencing of • The 2008 Global Financial Crisis had a significant
development, ensuring growth areas are impact on the regional economy. Regional
serviced with active mode and public transport employment numbers only returned to pre-GFC
60 61 62
WRGF Foundation Report 2020 These assessments were completed pre-Covid. For Housing and business capacity assessments.
analysis on the impacts of Covid-19 on the regional
economy see Challenges and opportunities section.
Wellington Regional Growth Framework | 17levels in 2017; in the Hutt Valley at the time of The local activity outlook Wellington region growing at a faster pace than
the report, employment numbers were yet to The share of each district’s industry employment is local government.
return to pre-GFC levels. used to allocate future activity across the region. • Construction is the largest industry in Porirua.
• A key strength of the regional economy is the Results show: Growth in housing construction will help to offset
government sector which continues to bolster • Wellington City has, retains, and grows the lion’s a temporary slowdown in construction following
the regional economy in the face of decline in share of government workers across the region the completion of the Transmission Gully
other sectors such as manufacturing. (83% in 2047) and commercial employment in Motorway. The motorway is expected to be the
• The economies of the region are closely tied Wellington City is also a little bit larger. catalyst for new industrial and commercial
together highlighting the complementarities • Kāpiti increases its share of workers in health, businesses establishing in Porirua.
and also highlighting that a shock to one education and training a little by 2047.
economy can reverberate through the region. • Wellington City accounts for about half of GDP calculations show:
employment in health, education and training • Economic output in Upper Hutt is expected to hit
Projecting economic activity sector over time. $1 billion by 2035.
Commercial employment is projected to flourish to • Kāpiti also has many self-employed workers that • Economic activity in Lower Hutt is expected to
2047 with history suggesting retail will return to leave the average firms’ size at 2.5 – unchanged increase by $1.1 billion over a 30-year period.
strong growth rates and the outlook for industrial from 2000 and much lower than the national • Kāpiti requires a lift in productivity to
employment is more mixed. average of 3.8. substantially boost activity.
• Industrial employment across the region is flat or • Activity within Wellington City is expected to
The slump in industrial employment after the GFC declining over the forecast horizon to 2047. increase by a little over 50% over time next 30-
implies a weak growth outlook although the precise • Outright declines in Lower Hutt where the share years.
numbers are very uncertain. of industrial employment declines over time.
This decline stems from Lower Hutt’s exposure to Business Land Demand
Growth in the government sector is predicted to a declining manufacturing sector. The other Business land is dispersed across the Wellington
continue steadily. Our numbers suggest government growing components of industrial activity lift the region. Commercial and office activity dominates
activity decreases as a share of the national economy relative shares of other districts. Wellington City, while industrial land is concentrated
but increases a little as a share of the regional • Retail employment is relatively stable across the in Lower Hutt and Upper Hutt. Porirua has a mix of
Wellington economy. districts and districts share of “other” industry commercial and industrial zoned land. Kāpiti contains
employment are stable. a mix of activity. Retail activity is spread across all
The past twenty years implies strong growth for • The industrial sector declines over the forecast metro councils. Lower Hutt and Wellington City
health, education and training as an industry to 2047. period and is almost 50% smaller in 30-years contain the most business land.
Employment in a “grab bag” of other industries is times.
predicted to lift more slowly in the future. • In contrast, the government sector increases Regional transport projects are anticipated to impact
over time and is a materially larger share of the upon the location and size of demand for business
economy in 30-years’ time. Government sector land. Land area demand for the region is projected to
employment includes local government with be 346,162 square metres. Generally, industrial
central government employment within the activity will likely decline over the 30-year period.
Wellington Regional Growth Framework | 18• Industrial land demand holds up for Upper Hutt. region. Mild increases in commercial and retail
The assessment considered capacity in three forms – It is expected Upper Hutt will continue to activity also boost the outlook.
currently vacant sites, infilling of existing sites, and increase its share of industrial employment in the • Porirua has 200 ha of commercial and industrial
redevelopment. Capacity from those three sources is region. Partly this reflects an expected zoned land in total. Industrial activity will require
significant. There is a collective capacity of over 1.8 continuation of recent trends towards firms approximately 26-63ha by 2048 in Porirua.
million square metres of floorspace available on sites seeking to reduce earthquake risks with some Commercial office (ex. Retail and commercial
that are currently zoned and vacant within the region. locations in Upper Hutt offering more stable service) activity will require 8-10 ha of land by
A further 3.89 million square metres is available land. 2048.
through infill development and redevelopment of • By 2047, it is expected many more health and • Estimates suggest the health, education and
existing areas could provide for an additional education workers will be needed in Kāpiti and training sector is the primary driver of business
maximum of 15 million square metres. this boosts demand for business land in Kāpiti. land demand in Kāpiti. An ageing population is
Industrial demand falls a little. likely to continue to increase the strong demand
The HBA accordingly concluded that the cities have • Estimates suggest Wellington City needs more for services in the region that has grown rapidly
sufficient capacity to meet projected demand for business land over the next 30-years. Additional in recent years. Population growth is also
business land over the study period. land is required across all sectors, particularly expected to generate some additional retail
retail, health and education, the commercial and activity which impacts demand for land, although
Key points: government sector but also some for the the region is relatively well serviced. Like
• Land area demand is projected to be 346,162 industrial sector. The demand sums to 238,313 elsewhere, a mild decline in industrial activity
square metres square metres of business land (equivalent to reduces land demand overall.
• The five cities have a projected business perhaps 100 supermarkets) or a 4% increase in
floorspace demand of 1,340,472 square metres. business land. Using a StatisticsNZ high population forecast shows
• Demand for industrial floor area is negative in • Demand for land in Lower Hutt is expected to that:
some council areas as the nature of industrial decline over the next 30-years. Lower Hutt has a • By the end of the forecast period, the Statistics
activity changes and existing activity rationalises substantial area of industrial land. A mild decline New Zealand high population forecast is 14%
into new areas both in and out of the Wellington is expected in industrial activity across the higher than the medium projection.
region. region. Lower Hutt is also losing its share of • Wellington City requires substantially more
• Conversely, other councils see growth in industrial industrial activity, exacerbating the overall business land – a little over 1,000,000 extra
floorspace demand. decline. These factors all sum to a material 40% square metres over the 30-years to 2047, an
decline in the demand for business land in Lower increase of about 17%.
Analysis shows that: Hutt. • In aggregate, higher regional population growth
• A range of industries lift total floorspace demand • Demand for business land in Upper Hutt is approximately offsets the decline in industrial
in Wellington City by 625,750 square metres or expected to grow over the 30-years to 2047. land demand in Lower Hutt. Demand for land
about 11%. Increasing market share for industrial land is increases substantially across most sectors.
• Less demand for industrial space reduces total sufficient to generate an increase in land Demand for retail land increases by almost 25%
demand for Lower Hutt. requirements even though industrial and health and education also increase
requirements overall are declining across the substantially.
Wellington Regional Growth Framework | 19• For Upper Hutt under the high population reflecting a recent lift in activity. But over the score poorly. Access to rail routes are generally
growth scenario the industrial sector requires long-term, the shift from industrial activity poor, and reflective of the nature of business
substantial land to accommodate the new towards services, and the assumption that the uses in the area. Assessment of measures such as
population track. floorspace required for each industrial worker access to the airport or seaport reflect the
• Population growth has a large influence on declines, produces a mild decline in the demand distance between the business areas and the
demand for business land in Kāpiti. Additional for industrial floorspace. For Porirua, trended airport.
workers are predominantly employed in the growth shows an increase in demand by 69,000
health and education sector with additional square metres over 30-years. By contrast the 30-
Deloitte 2019 report
workers in retail and the industrial sector. A little year Transmission Gully Motorway scenario
Modelling by Deloitte has suggested there are
over 20% more business land could be required. shows an increase in demand by 168,705 square
regional opportunities to leverage off the synergies
metres.
between the film and creative, food and beverage,
Demand for floor space • Health, education and training - Over the
and tourism sectors.
These assessments project a future business land projection horizon, demand for floorspace to
demand over the 2017-2047 period of 1,340,472 grow by 216,000 square metres, comprising a
With the country’s highest concentration of web-
square metres of new floor area across all business 25% increase over 30-years.
based and digital companies per capita, Wellington is
sectors. • Other - a 12% growth in floorspace in demand also poised to continue growing its creative digi-tech
The analysis shows: over the next 30-years, requiring an additional industry.
• Commercial - From an estimated 1.3 million 86,000 square metres by 2047.
square metres in 2016, we expect demand to hit Most students do not stay on to take jobs in
1.59 million square metres in 2048. Business capacity Wellington upon graduation. Wellington is viewed as
• Government - from an estimate of about 400,000 • Existing business floorspace of all types across an attractive and safe place to study. But finding a
square metres in 2016 the Government sector is the five councils currently measures 3.1 million solution to the steep house prices caused by the
set to grow to 550,000 square metres by 2047. square metres. housing shortage in the capital will be imperative to
Assumptions on the space required per worker • Infill development of existing business sites to keep growing the number of students choosing
have a marked effect on the outlook. If footprint the maximum expected extent under District Wellington for tertiary education.
per worker is kept static at the current Plan standards could provide for an additional
requirement, then the sector requires 720,000 3.3 million square metres of floor space.
square metres by 2047 – an increase of 72%. • Redevelopment of all business zoned sites across
• Retail - retail space would hit 1.5 to 1.62 million the five councils would provide for 14.4 million
square metres by 2048 (upper figure allows for square metres of floor area.
Transmission Gully Motorway scenario in • The assessment of feasibility of business areas
Porirua). That represents a 10% increase in was undertaken by way of a Multi Criteria
floorspace over the entire period. Analysis. All of the Councils show above average
• Industrial – for most metro councils, in the near- feasibility scores based on the assessment
term industrial land demand grows a little, undertaken. On some measures, the council’s
Wellington Regional Growth Framework | 20Appendix A – Shared evidence base
This section outlines the various technical reports that have been used to inform BERL (June 2020) - Greater https://www.gw.govt.nz/assets/Uploads/
the Employment Analysis Report and provide a robust level of data and analysis as Wellington Region Covid-19 GWRC-COVID-19-Impacts-for-LTP-
the basis of the shape of the report. economic impact scenario one Summary-FINAL.pdf
summary
REPORTS WEBSITE REFERENCE Deloitte 2019 Shaping our slice of https://www2.deloitte.com/content/da
heaven Regions of opportunity m/Deloitte/nz/Documents/Economics/nz
ACEOM Horizons Region http://www.horizons.govt.nz/HRC/media -en-DAE-Slice-of-Heaven-2019-
Community Carbon /Media/Publication/SoE_2020_Horizons- Report.pdf
Footprint 2018/19 Region-Community-Carbon-Footprint- Wellington Regional Housing and https://planningforgrowth.wellington.go
2018-19.pdf?ext=.pdf Business Development Capacity - vt.nz/__data/assets/pdf_file/0021/3288/
AECOM Wellington Region https://www.gw.govt.nz/assets/Climate- Chapter 7 - Appendix 1,2, and 3 Wellington-Regional-HBA-Chpt-7-
Greenhouse Gas Inventory May change/GHG-Summary-Report- Appendix-Appendix-1,-2-and-3.pdf
2020 Wellington2019WRFinal.pdf Hepburn, O’Callaghan, Stern, https://www.smithschool.ox.ac.uk/public
Arataki 2021–31 Regional Summary https://www.nzta.govt.nz/assets/plannin Stiglitz and Zenghelis (2020) Will ations/wpapers/workingpaper20-02.pdf
Wellington – Version 1.1 g-and-investment/arataki/docs/regional- COVID-19 fiscal recovery packages
summary-wellington.pdf accelerate or retard progress on
Arataki Covid-19 Implications 2020 https://www.nzta.govt.nz/assets/plannin climate change? Prepared for the
g-and-investment/arataki/docs/regional- Oxford Review of Economic Policy
summary-9-wellington-potential- 36(S1).
impacts-of-covid-19.pdf
BERL (March 2018) - Making sense http://www.gw.govt.nz/assets/Mana- Hill, R (June 2020). Plea for workers https://www.rnz.co.nz/news/national/41
of the numbers, Māori economy in WhenuaPartnership-Page-Images/BERL- to return to Wellington CBD to 8511/plea-for-workers-to-return-to-
the Greater Wellington region Report-GWRC-finalreport-29-March- support businesses. Published by wellington-cbd-to-support-businesses
2018.pdf RNZ.
BERL (February 2020) - CentrePort https://berl.co.nz/research/centreport- Housing and Business https://planningforgrowth.wellington.go
Waingawa log hub, Cost savings waingawa-log-hub-cost-savings Development Capacity Assessment vt.nz/__data/assets/pdf_file/0020/3287/
from a transport mode shift – Regional summary Wellington-Regional-HBA-Chpt-1-
https://berl.co.nz/sites/default/files/202 Regional-Summary.pdf
0- Housing and Business https://planningforgrowth.wellington.go
03/BERL%20Transport%20mode%20shift Development Capacity Assessment vt.nz/__data/assets/pdf_file/0016/3283/
%20study.pdf – Hutt City Wellington-Regional-HBA-Chpt-3-Hutt-
City-Council.pdf
Wellington Regional Growth Framework | 21You can also read