Changes in forest productivity across Alaska consistent with biome shift
←
→
Page content transcription
If your browser does not render page correctly, please read the page content below
Ecology Letters, (2011)                                                      doi: 10.1111/j.1461-0248.2011.01598.x

      LETTER
                                            Changes in forest productivity across Alaska consistent with
                                            biome shift

                                            Abstract
Pieter S. A. Beck,1* Glenn P. Juday,2       Global vegetation models predict that boreal forests are particularly sensitive to a biome shift during the 21st
Claire Alix,3 Valerie A. Barber,2           century. This shift would manifest itself first at the biome!s margins, with evergreen forest expanding into
Stephen E. Winslow,2 Emily E.               current tundra while being replaced by grasslands or temperate forest at the biome!s southern edge.
Sousa,2 Patricia Heiser,2 James D.          We evaluated changes in forest productivity since 1982 across boreal Alaska by linking satellite estimates of
Herriges4 and Scott J. Goetz1               primary productivity and a large tree-ring data set. Trends in both records show consistent growth increases at
                                            the boreal–tundra ecotones that contrast with drought-induced productivity declines throughout interior
                                            Alaska. These patterns support the hypothesized effects of an initiating biome shift. Ultimately, tree dispersal
                                            rates, habitat availability and the rate of future climate change, and how it changes disturbance regimes, are
                                            expected to determine where the boreal biome will undergo a gradual geographic range shift, and where a more
                                            rapid decline.

                                            Keywords
                                            Boreal forests, drought, evergreen forests, global warming, high latitudes, NDVI, productivity, remote sensing,
                                            tree rings.

                                            Ecology Letters (2011)

                                                                                      agreement with model outputs (Forbes et al. 2010). Populations of far
INTRODUCTION
                                                                                      northern trees in cold marginal environments have sustained positive
Over the 21st century, dynamic global vegetation models predict that                  growth responses to temperature, and in recent decades have grown at
the boreal biome is likely to experience forest conversion and losses                 their greatest recorded rates (Juday et al. 2005). In contrast, spatially
resulting in a northward shift in the biome!s range, particularly under               restricted field observations have documented anomalously low white
scenarios of greatest warming (Lucht et al. 2006; Scholze et al. 2006;                spruce (WS) [Picea glauca (Moench) Voss] growth in productive stands
Gonzalez et al. 2010). As northern high latitude forest ecosystems                    in interior Alaska in the last three decades of the 20th century (Barber
contain at least 30% of global terrestrial carbon (McGuire et al. 2009;               et al. 2000). Similar observations at elevational tree line in Canada
Tarnocai et al. 2009), such changes could substantially modify future                 indicate that once the climate warms beyond a physiological threshold,
climate (Bonan 2008). Northward and elevational shifts in species                     a divergence of tree growth and air temperature occurs (D!Arrigo et al.
distributions over the past decades have been documented across a                     2004). A few satellite-based studies report a recent reversal of the
wide range of taxa (Hickling et al. 2006). At high latitudes shrub                    initial (1982 through 1991) productivity gains of boreal forest across
abundance has increased (Tape et al. 2006) and in alpine environments                 many high latitude forest areas (Angert et al. 2005; Goetz et al. 2005),
forest communities have recently migrated to higher elevations,                       but these observations have not been directly linked to field
apparently in response to environmental warming (Peñuelas & Boada                    measurements.
2003). At regional scales, however, there is little evidence of                          Tree-ring measurements provide a consistent record of past
directional change in the distribution of terrestrial biomes attributable             productivity but are traditionally collected at ecosystem transition
to ongoing climate change.                                                            zones (ecotones) to test for climate sensitivity or to reconstruct
   Model simulations of high latitude ecosystems changes in the last                  climate records (D!Arrigo et al. 2004), rather than to capture growth
three decades, which experienced rising atmospheric CO2 concentra-                    trends in more typical (higher density) forest stands. As a result,
tions and associated warming (Rahmstorf et al. 2007), suggest an                      comparisons of in situ tree growth measurements with more synoptic
increasing vegetation productivity trend (Lucht et al. 2002; Kimball                  scale observations across large spatial domains, such as satellite data,
et al. 2007; Zhao & Running 2010). Analyses of satellite imagery since                are rare (Kaufmann et al. 2004). Establishing this link provides a
1982 have generally supported this view, indicating consistent                        potentially powerful way to extend relatively limited field observations
increases in gross primary productivity estimated using remote sensing                to the spatial domain covered by remote sensing observations, and
(Prs; Myneni et al. 1997; Zhou et al. 2001). Recent field measured                    thus provide a comprehensive view of biome-wide productivity
increases in tundra shrub growth over the same period are also in                     patterns and trends.

1                                                                                     4
    Woods Hole Research Center, Falmouth, MA 02540, USA                                   Bureau of Land Management, Fairbanks, AK 99709, USA
2
    School of Natural Resources and Agricultural Sciences, University of Alaska       *Correspondence: E-mail: pbeck@whrc.org
Fairbanks, Fairbanks, AK 99775, USA
3
    Archéologie des Amériques, NRS ⁄ Université de Paris 1 – Panthéon Sorbonne,
France

                                                                                                                            ! 2011 Blackwell Publishing Ltd/CNRS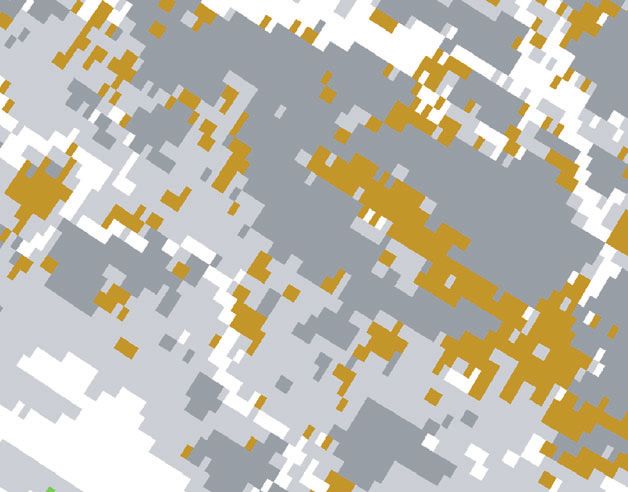
2 P. S. A. Beck et al.                                                                                                                            Letter

   Spruce species dominate the boreal forest biome of North America.          The MODIS Land Cover map for 2005 (MOD12Q1; Friedl et al.
We collected an extensive tree-ring width data set from WS and, for           2002), with a spatial resolution of 15 arc-seconds (0.0042"), was
the first time, from black spruce [BS, Picea mariana (Mill.) B.S.P.] forest   reclassified from the International Geosphere-Biosphere Programme
stands which, despite their dominance in boreal North America, have           (IGBP) classification to (1) anthropogenic land cover, be it agricultural
rarely been reported in the dendrochronology literature. The WS and           (IGBP-12, IGBP-14), or urban (IGBP-13), (2) non-vegetated (IGBP-
BS stands span an east–west gradient from a drier continental to a            0, IGBP-15, IGBP-16) or (3) vegetated (other IGBP classes).
more mesic maritime climate, and were sampled to capture variations           A GIMMS grid cell was excluded from the analysis if more than
in forest productivity. We compared this data set to satellite remote         40% of it was classified as non-vegetated or if vegetated land cover
sensing observations of the normalized difference vegetation index            was not at least three times larger than anthropogenic land cover.
(NDVI), a spectral metric reflecting gross productivity (Prs; Myneni             Patterns in Prs changes were compared with gradients of (1) tree
et al. 1995; Goetz & Prince 1999). Spatial coherence and temporal             cover as mapped in the MODIS Vegetation Continuous Fields
covariance of these two very different observational records was              product (MOD44; Hansen et al. 2003) and (2) monthly temperatures
assessed along with their interannual variability, to evaluate geograph-      in the 1982–2008 period (McKenney et al. 2006). Both were gridded to
ical patterns in changes in vegetation productivity over the period of        match the GIMMS data set.
their coincidence (1982–2008). Here, we investigate these patterns to
test the hypothesis that the boreal biome is undergoing a range shift
                                                                              Burn history
characterized by: (1) productivity increases at the boreal–tundra
ecotone and (2) productivity declines at the warmer margin of its             In each GIMMS grid cell in Alaska and Canada, the yearly area burned
current distribution.                                                         was calculated from 1950 to 2007 by merging the fire perimeter data
                                                                              produced by the Bureau of Land Management, Alaska Fire Service
                                                                              (AFS; acquired from the Alaska Geospatial Data Clearinghouse,
MATERIAL AND METHODS                                                          http://agdc.usgs.gov/data/blm/fire), and the Fire Research Group at
                                                                              the Canadian Forest Service.
Remotely sensed gross productivity (Prs) 1982–2008
Remotely sensed gross productivity was mapped annually from a
                                                                              Tree-ring sampling
gridded time series as the mean NDVI during the growing season,
while accounting for spatial variation in the growing season length           We measured radial growth in 839 mature trees, of which 627 WS and
(GSL). The NASA Global Inventory Modeling and Mapping Studies                 212 BS, that were dominant in the current landscape and had no
data set (GIMMS-NDVI version G) spans the period 1982–2008                    visible signs of fire or insect damage. The trees were pooled to create
(http://glcf.umiacs.umd.edu/data/gimms/; Tucker et al. 2005) at               46 WS and 42 BS stand-level wood growth (WG) estimates, based on
0.07" spatial resolution. It was derived from measurements by the             the GIMMS grid cell the trees were located in. The number of trees
Advanced Very High Resolution Radiometers (AVHRRs) carried by                 sampled in a stand varied from 1 to 62, with a median of 6. Mean
the afternoon-viewing NOAA satellite series (NOAA 7, 9, 11, 14, 16            stand-level growth was calculated from 1982 until the year of
and 17). The data processing includes corrections for atmospheric             sampling, generating 88 series between 6 and 27 years long
aerosols effects from the El Chichón and Pinatubo eruptions, solar           (median = 20) where growth and GIMMS data could be paired.
zenith angle effects and sensor differences and degradation (Tucker              Tree-ring data were not de-trended as spruce trees of the age
et al. 2005). GIMMS-NDVI provides 24 global NDVI images per                   range in this study exhibit little to no age-related growth trend
year, with the first image of each month representing the month!s first       (Barber et al. 2000). Furthermore, Barber et al. (2000) showed for a
15 days, and the other image the remainder.                                   subset of the current data set that de-trending had negligible effects
   We mapped Prs for each year between 1982 and 2008. First, the              on the growth–climate relationships. Mean radial growth was
GSL was mapped at 30 arc-second (0.0083") spatial resolution from             calculated per stand from non-normalized tree-ring series to preserve
the Moderate Resolution Imaging Spectroradiometer (MODIS) Land                the greater contribution of larger trees to stand-level WG. An index
Cover Dynamics product (MOD12Q2; Zhang et al. 2006). Here, the                of topography-related soil wetness was estimated for the tree stands
GSL was initially estimated as the period between the latest "start of        from a 60-m digital elevation model, and calculated as ln(a ⁄ tan b)
greening! date, and the earliest "start of dormancy! date recorded in the     where a is the local upslope area draining through a certain point
MOD12Q2 data between 2001 and 2004. To ensure exceptionally late              per unit contour length and tan b is the local slope (Beven & Kirkby
snow melt or early snow fall events never overlapped with our                 1979).
growing season estimate, the initial GSL estimate was shortened by a
third. The resulting maps of GSL were then averaged to the spatial
                                                                              Statistical methods
and temporal resolution of the GIMMS-NDVI data to determine the
GSL for each GIMMS-NDVI grid cell (see Figure S1). Next, Prs was              Prior to mapping, temporal trends in Prs were subjected to a
calculated and mapped annually from GIMMS-NDVI as the mean                    Vogelsang test (Vogelsang 1998) to determine if a deterministic
NDVI during the growing season, using the GSL map to account for              temporal trend was present in the data (statistical significance was set
spatial variation in the GSL. To account for year-to-year variation in        at a = 0.05). The Vogelsang stationarity test controls for the
the start and end of the growing season, each year Prs was set to the         possibility of strong serial correlation in the data generating spurious
maximum value output from a time series moving average, with                  trends. It is valid whether errors are stationary or have a unit root, and
window length set to GSL (Figure S2).                                         does not require estimates of serial correlation nuisance parameters.
   To map trends in Prs, the NDVI data were further filtered to mask          It is useful for masking stochastic changes in Prs in the landscape such
anthropogenic changes and non-deterministic (e.g. stochastic) series.         as those associated with disturbance (Goetz et al. 2005).

! 2011 Blackwell Publishing Ltd/CNRS
Letter Changes in forest productivity across Alaska 3
The consistency of temporal changes in both tree growth series and West (Fig. 1). Across tree-ring sites where the remote sensing data
Prs since 1982 was quantified and compared using Kendall!s s indicated non-stochastic trends in gross productivity (N = 30,
(Hollander & Wolfe 1973), calculated at each site from the cross- Vogelsang test, a = 0.05; see Table S1), yearly values of WG and
tabulation of time and radial growth (sgrowth), and time and Prs (sPrs). Prs were strongly positively correlated and displayed a negative
As a result, s approaches 1 as a series consistently increases with time, temporal trend between 1982 and 2008 (R = 0.69, N = 27 years,
and )1 as it consistently decreases with time. Agreement between P < 0.001; Fig. 2). Furthermore, all but 2 of these 30 sites (13 WS and
trends in Prs and growth was quantified using a regression model 17 BS), showed an identical direction of change in WG and Prs as
describing sgrowth as a linear function of sPrs, weighted by the number measured by the signs of sgrowth and sPrs respectively. Across all sites
of available ring width measurements. The regression included both without traces of fire since 1950, temporal changes in Prs since 1982
BS and WS sites, but excluded sites with evidence of burning since reflect commensurate changes in spruce growth [Fig. 3; sgrowth =
1950. sPrs * 1.06(±0.14 SEM) ) 0.001(±0.05 SEM), d.f. = 55]. Overall, the
To compare year-to-year variation in Prs and growth in isolation best agreement in trends occurred when growth was estimated from a
from multi-year trends, the agreement between yearly changes in radial larger number of samples (Figure S3).
growth (Dgrowth) and Prs (DPrs) was calculated at each site using Decreases in WG relative to the previous year were weakly
Kendall!s s, denoted as sDPrs,Dgrowth. Agreement was calculated correlated with changes in Prs (median sDPrs,Dgrowth = 0.2, P = 0.002,
separately in years of increasing growth (Dgrowth > 0), and decreasing N = 21). By contrast, increases in WG from 1 year to the next were
growth (Dgrowth < 0), and only if 5 years of observations were not consistently associated with equivalent increases in Prs (median
available. The agreement was then assessed for statistical significance sDPrs,Dgrowth = )0.05, P = 0.59, N = 21), suggesting that resource
across sites using the Wilcoxon signed rank test (H0: sDPrs,Dgrowth = 0). allocation to leaf mass and WG is not necessarily regulated at identical
time scales.
While the tree-rings used here were collected from mature trees in
RESULTS
unburned stands, the satellite Prs time series reflects the legacy of
Over the satellite record, which begins in 1982, within-stand variation wildfire. The magnitude of that effect is dependent upon the timing,
in tree growth trends was present: 48 of 88 stands contained both extent and severity of burning (Goetz et al. 2006). Consequently,
trees displaying positive (sring width > 0) and negative growth trends trends in WG and Prs may not agree in some areas characterized by
(sring width < 0). However, mean interseries correlation of raw ring vegetation mortality from fire (sudden decrease in Prs) or rapid
widths during the reference growth period of 1950 to date of vegetation regrowth following fire (steady increase in Prs; Figure S4).
collection was generally high [for stands with 10 trees or more, After excluding disturbance-related stochastic changes in Prs using the
mean = 0.43 (±0.14 SD), N = 31] indicating that our tree-ring based burn history data and the Vogelsang test (Goetz et al. 2005), the
estimates of stand-level WG are robust, particularly in the larger tundra areas of Alaska show near-ubiquitous increases in Prs (Fig. 1).
samples. The coldest boreal areas, which are currently sparsely forested, i.e.
Across boreal Alaska both WG and satellite-derived Prs predom- those at the boreal–tundra ecotone, also display deterministic
inantly declined since 1982, except in the more maritime areas of the increases in productivity over the past three decades (Fig. 4).
180° 170° W 160° W 150° W
60° N
0 25 50 100
Km
Spruce growth and gross productivity (Prs) 1982–2008 Tree ring sites Rivers
Decreasing White Spruce Roads
Burned
Increasing Black Spruce
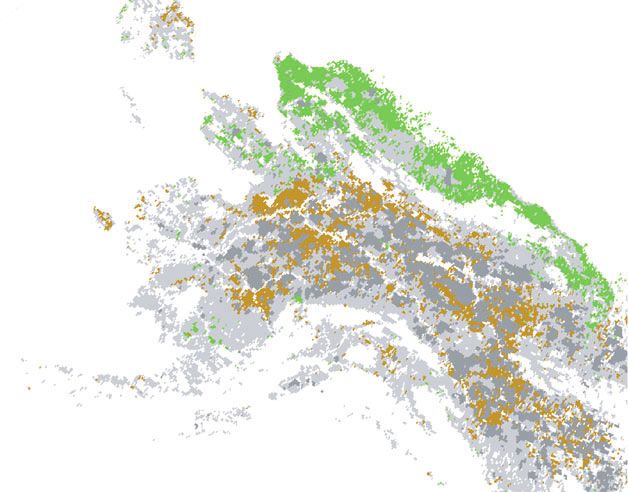
Figure 1 Trends in remotely sensed gross productivity (Prs) between 1982 and 2008 and trends in spruce growth since 1982 in Alaska (left) and the area around Fairbanks
(right). White shading indicates sparsely vegetated or human modified land cover. Light grey shading indicates the trend in Prs from 1982 to 2008 was non-deterministic based
on a Vogelsang significance test (a = 0.05), and dark grey areas had wildfires anywhere between 1982 and 2007. Green and brown shading in the symbols indicate increasing
and decreasing ring widths, respectively, in unburned stands from 1982 to the year of sampling which ranged from 1994 to 2008.
! 2011 Blackwell Publishing Ltd/CNRS4 P. S. A. Beck et al. Letter
4 6 8 10 12 14
1.5
(b)
No trend in Prs
0
10 20 30 40 50 60 70
70 60 50 40 30 20 10
(a) (c)
Tree cover (%)
−1.5
Decreasing Prs
Increasing Prs
30
15
0
1982 1986 1990 1994 1998 2002 2006
0
0
Year
4 6 8 10 12 14
Figure 2 Trends in remotely sensed gross productivity (Prs, solid line) and radial Temperature in May–August (°C)
tree growth (dashed line) at the 30 tree-ring sampling sites with deterministic
changes in Prs based on a Vogelsang test (a = 0.05; Vogelsang 1998). Anomalies Figure 4 (a) Tree cover (Hansen et al. 2003) compared to mean air temperature in
are expressed in units of standard deviations (SD) from the respective means May–August in 1982–2007 for non-anthropogenic vegetated areas of interior
calculated over the period 1982–1996. Lines represent yearly mean anomalies across Alaska, i.e. the mainland north of the Alaska Range and south of the Brooks Range.
all sites and shaded areas their standard errors, both weighted by the number of Only areas where gross productivity (Prs) shows a deterministic trend from 1982 to
trees sampled at each site. 2008 and where there were no wildfires between 1982 and 2007 are shown.
Histograms represent the distribution of (b) temperature and (c) tree cover and
include areas where no trend was detected.
DISCUSSION
0.5
Along with temperature, tropospheric ozone, nitrogen deposition and
CO2 concentrations have all increased globally in the last three
decades, potentially driving shifts in vegetation productivity (IPCC
τ
2007). Mean ozone concentrations in Alaska are low compared to
0.0
more populated areas, and are generally considered to be at global
"background levels! (Figure S5; Vingarzan 2004). Because of this and
the greater tolerance of needle-leaved trees to elevated ozone
concentrations (Sitch et al. 2007; Wittig et al. 2009) projected increases
in ozone over the 21st century are not expected to adversely affect
–0.5
vegetation productivity in Alaska (Sitch et al. 2007), and recent
increases are unlikely to explain the patterns in productivity
documented here. Similarly, the relatively low rates of nitrogen
deposition in interior Alaska [at Denali National Park; Jones et al.
–0.5 0.0 0.5
(2005) report 0.3 kg N ha)1 year)1] are an order of magnitude lower
τ
than rates that were experimentally found to limit boreal tree growth
Figure 3 Temporal trends in WG and Prs. Growth is calculated from ring widths (Hogberg et al. 2006). This is consistent with recent results from a
of all trees sampled within a single satellite grid cell (c. 64 km2), and point sizes are process-based biogeochemistry model with coupled carbon and
equivalent to the number of ring widths in the series, which were restricted to years nitrogen cycles that indicates that over the past five decades N
when both Prs and growth data were available. Circles represent white spruce deposition has had a very small effect on boreal net ecosystem
stands and triangles black spruce stands. Open symbols indicate vegetation burning
exchange (McGuire et al. 2010). These same model simulations
and regrowth after 1950 might have influenced Prs estimates. Red points represent
cases where s of the Prs series or the WG series were statistically different from 0 indicate that increased atmospheric CO2 concentrations since 1750
(a = 0.05). have promoted net uptake of carbon by arctic as well as boreal
ecosystems, i.e. a CO2 fertilization effect. At the pan-arctic scale,
however, this effect appears outweighed by a stronger increase of
carbon losses from the biosphere to the atmosphere due to shifts in
In contrast, all other forested areas in the boreal zone, not only the fire disturbance and climate (mediated by combustion and temper-
warmest or most densely forested ones, were dominated by ature, moisture, and successional controls on photosynthesis and
productivity declines (Figs 1 and 4). Topographical wetness (W) did respiration), to the extent that the CO2 fertilization is not likely to be
not differ significantly between sites where productivity increased or detectable over the 30-year period investigated here (McGuire et al.
decreased, whether measured as WG or satellite-derived gross 2010). Overall, we conclude that the productivity patterns we
productivity (Kruskall–Wallis rank sum test, H0: WsWG0, document in mature unburned forests are driven more by climate
P = 0.3; H0: WsPrs0, P = 0.1; N = 88) and at 8 of the (temperature and moisture) than ozone, nitrogen or CO2 fertilization
10 wettest sites both measures indicated declining productivity. effects.
! 2011 Blackwell Publishing Ltd/CNRSLetter Changes in forest productivity across Alaska 5
18
/oo)
● Coastal ● Year
o
3
Normalized ring width (mm)
Interior 1910
17
●
● ● ● 1940
16
1970
2
● ● ● ●
●
● 2000
14 15
●
1
● ●
●●● ● ●
C
● ●
● ●●
13
●●
0
● ●
●●● ●●
δ
● ●
●● ●
● ●●●●●● ●
●
● ● ●●
●
●●
● 1900 1915 1930 1945 1960 1975 1990
−1
● ●
● ●●
● ● Year
●
Figure 6 Stable carbon isotope (d13C) time series for black spruce and white spruce
–2
10 12 14 16 stands in interior Alaska. Black spruce data were measured in the Zasada Road 8
stand at the Bonanza Creek Long-term Ecological Research (LTER) site (64.8" N,
Temperature in May−August (°C)
148.0" W) following the methods described by Barber et al. (2000) and at 5-yearly
intervals to assure sufficient wood material was available for analysis. Yearly white
Figure 5 Normalized white spruce mean tree-ring widths at coastal and interior
spruce d 13C discrimination (thin grey line) was taken from Barber et al. (2000),
sites where trees were sampled in 2010 vs. mean temperature in May–August of the
measured in the Reserve West stand in the same LTER site and averaged at 5-year
year of ring growth and 1 and 2 years prior. The coastal trees were sampled at
intervals (bold line). Isotopic discrimination is expressed as the proportional
Dillingham (N = 10) and King Salmon (N = 8; Table S1) and compared with the
deviation of the measured 13C ⁄ 12C ratio from the Peedee belemnite carbonate
temperature record at King Salmon Airport (59" N, 157" W) which starts in 1947.
standard (Craig 1957).
The trees from interior Alaska were sampled in the Yukon River Flats (N = 25;
Table S1) and were compared with the Fairbanks ⁄ University Experiment Station
(65" N, 148" W) temperature record which is the longest one available in interior widespread productivity increases in both forest and tundra areas in
Alaska and representative of interannual variation across the region (Barber et al. the preceding decade (Figure S8a; Myneni et al. 1997). Since the mid-
2000). We note that the choice for the months of May–August as a temperature 1990s, we observe a divergent response to climate warming in Arctic
index represents a compromise since seasonal temperature sensitivity differs
between the sites (Figure S6).
tundra and forests, consistent with earlier reported NDVI trends
across North America (Goetz et al. 2005) and Alaska (Verbyla 2008).
Whereas the warmer climate has continued to increase tundra
The observed spatiotemporal pattern in productivity suggests that productivity, it appears to constrain photosynthetic activity in boreal
in colder areas temperature limitations on spruce growth have been forests (Fig. 1; Figure S8a). Recent global ecosystem model simula-
released during the recent decades of warming, while the climate has tions showing increased net primary productivity in both forested and
shifted beyond the optimum for spruce growth in the warmer zones tundra areas in Alaska from 2000 to 2009 (Zhao & Running 2010)
of interior Alaska (Figs 4 and 5). Earlier analysis of carbon isotopes in apparently fail to capture the declines we observe using satellite
WS has attributed the growth declines in interior Alaska to imagery (Figure S8b). As plant respiration generally increases with
temperature-induced drought stress (Barber et al. 2000). Additional temperature, increased net productivity is at odds with the gross
analysis of BS tissue reveals an equally strong drought-induced shift in productivity declines we observed in undisturbed mature boreal forest.
isotopic composition since the early 1980s (Fig. 6, Appendix S1), While net productivity increases are consistent with assumed
suggesting that water availability is increasingly limiting productivity of metabolic responses to rising temperature in cold climates, the recent
the dominant tree species in Alaskan boreal forests. simulation results currently show no moisture limitations on Alaskan
Drought in boreal forests can originate from a lack of soil moisture vegetation productivity (Zhao & Running 2010). In contrast, our
or an excessive evaporative demand. Although summer precipitation observations indicate that the higher temperatures of recent decades
has been experimentally shown to limit productivity of spruce trees have limited productivity of Alaskan forests owing to coincident
(Yarie 2008), it does not show a directional change in Alaska during increases in evaporative demand (VPD; Figure S7), which is consis-
the decades investigated here (Hinzman et al. 2005). Our finding that tent with experimental and in situ measurements (Barber et al. 2000;
recent decreases in productivity are not restricted to upland sites, but Hogg et al. 2008; Way & Oren 2010), as well as earlier model
are equally prominent in floodplains where ground water could buffer simulations (e.g. Angert et al. 2005; Zhang et al. 2008).
against precipitation-driven water deficits (Viereck et al. 1993), further The observed changes in forest productivity during the period of
indicates that soil moisture is not the main driver of the widespread the satellite record (27 years), and their relationship to temperature,
declines in productivity. In contrast to soil moisture stress, evaporative indicate that warming has resulted in drought stress exerting an
demand has grown during the last decades; even during periods when increasingly limiting role on both Prs and tree growth across most of
temperatures were relatively stable (Figure S7). This supports our the boreal forest ecosystem of interior Alaska. We observed increasing
contention that observed decreases in productivity are the result of tree growth and Prs only in the marginal zone of low tree cover in
drought stress stemming from hydraulic limitations imposed by high western Alaska, which constitutes the boreal–tundra ecotone, and
vapour pressure deficits (VPDs) on photosynthesis during warm beyond current tree limits, both areas where 20th century tempera-
summer periods. Furthermore, because plant growth responds tures were sub-optimal for tree growth. An identical pattern of shifts
nonlinearly to both VPD and temperature, which are coupled, this in boreal forest productivity has been projected by global vegetation
observation is consistent with the temperature–growth relationship models to occur over the course of the 21st century, leading to biome-
reported here (Fig. 5). wide changes such as northward forest expansion and regional
Negative productivity trends in the Alaskan boreal forest are drought-induced forest recession (Lucht et al. 2006; Scholze et al.
particularly pronounced since the mid-1990s (Fig. 2), in contrast to 2006). The confluence of the current observational record with the
! 2011 Blackwell Publishing Ltd/CNRS6 P. S. A. Beck et al. Letter
latter longer term projections thus provides support for the hypothesis D!Arrigo, R.D., Kaufmann, R.K., Davi, N., Jacoby, G.C., Laskowski, C., Myneni,
that a biome shift is already underway on a quasi-continental scale. R.B. et al. (2004). Thresholds for warming-induced growth decline at elevational
tree line in the Yukon Territory, Canada. Global Biogeochem. Cycles, 18, GB3021.
As long as increases in temperature persist, currently forested areas
Forbes, B.C., Fauria, M.M. & Zetterberg, P. (2010). Russian Arctic warming and
will experience intensified stress, mortality and composition changes, "greening! are closely tracked by tundra shrub willows. Glob. Change Biol., 16,
while the transitional ecotones of western and northern Alaska will 1542–1554.
become climatically more suitable for enhanced tree recruitment and Friedl, M.A., McIver, D.K., Hodges, J.C.F., Zhang, X.Y., Muchoney, D., Strahler,
growth associated with forest migration. A.H. et al. (2002). Global land cover mapping from MODIS: algorithms and early
Ultimately, the resiliency of the boreal forest to climate change and results. Remote Sens. Environ., 83, 287–302.
the possibility for forest migration, as dictated by tree dispersal rates Goetz, S.J. & Prince, S.D. (1999). Modeling terrestrial carbon exchange and storage:
evidence and implications of functional convergence in light use efficiency. Adv.
and habitat availability, will shape the extent and speed of a biome
Ecol. Res., 28, 57–92.
shift. Both the in situ tree ring and the satellite data presented here Goetz, S.J., Bunn, A.G., Fiske, G.J. & Houghton, R.A. (2005). Satellite-observed
suggest that the climate of the last few decades has shifted beyond the photosynthetic trends across boreal North America associated with climate and
physiological optimum for spruce growth throughout the Alaskan fire disturbance. Proc. Natl. Acad. Sci. USA, 102, 13521–13525.
boreal ecosystem. Intensified monitoring is needed to document Goetz, S.J., Fiske, G.J. & Bunn, A.G. (2006). Using satellite time-series data sets to
whether the pattern observed here will result in a rapid decline of the analyze fire disturbance and forest recovery across Canada. Remote Sens. Environ.,
boreal biome rather than a more gradual geographical range shift, 101, 352–365.
Gonzalez, P., Neilson, R.P., Lenihan, J.M. & Drapek, R.J. (2010). Global patterns in
particularly since direct effects of climate warming on tree growth can
the vulnerability of ecosystems to vegetation shifts due to climate change. Global
amplify its indirect effects, e.g. through increased susceptibility to Ecol. Biogeogr., 19, 755–768.
insect disturbance (Malmström & Raffa 2000). Moreover, forest Hansen, M.C., DeFries, R.S., Townshend, J.R.G., Carroll, M., Dimiceli, C. &
expansion into tundra areas is expected to vary geographically, since it Sohlberg, R.A. (2003). Global percent tree cover at a spatial resolution of
too is impacted by indirect climate effects, such as thermokarst and 500 meters: first results of the MODIS vegetation continuous fields algorithm.
fire, and can be physiologically limited by drought (Lloyd et al. 2002; Earth Interact., 7, 1–15.
Hickling, R., Roy, D.B., Hill, J.K., Fox, R. & Thomas, C.D. (2006). The distribu-
D!Arrigo et al. 2004). Finally, if the continued shift in the climate
tions of a wide range of taxonomic groups are expanding polewards. Glob. Change
optimum for forest growth outpaces tree migration rates, a Biol., 12, 450–455.
contraction of the boreal biome in the 21st century is more likely Hinzman, L., Bettez, N., Bolton, W., Chapin, F., Dyurgerov, M., Fastie, C. et al.
than a northward or elevational shift in its distribution. (2005). Evidence and implications of recent climate change in northern Alaska
and other arctic regions. Clim. Change, 72, 251–298.
Hogberg, P., Fan, H.B., Quist, M., Binkley, D. & Tamm, C.O. (2006). Tree growth
ACKNOWLEDGEMENTS and soil acidification in response to 30 years of experimental nitrogen loading on
boreal forest. Glob. Change Biol., 12, 489–499.
We thank John Little of the Canadian Forest Service for providing the
Hogg, E.H., Brandt, J.P. & Michaelian, M. (2008). Impact of regional drought on
Canadian fire database, Dave McGuire for his responses to queries on the productivity, dieback and biomass of western Canadian aspen forests. Can. J.
biogeochemical cycles in Alaska and the anonymous referees for their For. Res., 38, 1373–1384.
constructive comments. We acknowledge support from the National Hollander, M. & Wolfe, D.A. (1973). Nonparametric Statistical Methods. John Wiley &
Science Foundation (0902056), the NOAA Carbon Cycle Science Sons, New York.
program (NA08OAR4310526) and the NASA Carbon program IPCC (2007). Climate Change 2007: The Physical Science Basis. Contribution of Working
(NNX08AG13G) to SJG, from the McIntire-Stennis Cooperative Group I to the Fourth Assessment Report of the Intergovernmental Panel on Climate Change.
Cambridge University Press, Cambridge.
Forestry Research Program, the US Geological Survey Yukon River
Jones, J.B.J., Petrone, K.C., Finlay, J.C., Hinzman, L.D. & Bolton, W.R. (2005).
Basin program, and the US NSF Long-Term Ecological Research Nitrogen loss from watersheds of interior Alaska underlain with discontinuous
(LTER) Program (DEB 0620579) to GPJ, and from the French Polar permafrost. Geophys. Res. Lett., 32, L02501.
Institute Paul Emile Victor (IPEV) programme 402 Anthropobois, the Juday, G.P., Barber, V., Vaganov, E., Rupp, S., Sparrow, S., Yarie, J. et al. (2005).
International Arctic Research Center (G1464, NSF ARC-0327664 and Forests, land management, and agriculture. In: Arctic Climate Impact Assessment
G191, NOAA NA17RJ1224), the NSF Office of Polar Programs (eds Symon, C., Arris, L. & Heal, B.). Cambridge University Press, Cambridge,
pp. 781–862.
(0436527) and the Geist Fund of the University of Alaska Museum of
Kaufmann, R.K., D!Arrigo, R.D., Laskowski, C., Myneni, R.B., Zhou, L. & Davi,
the North to CA. N.K. (2004). The effect of growing season and summer greenness on northern
forests. Geophys. Res. Lett., 31, L09205.
Kimball, J.S., Zhao, M., McGuire, A.D., Heinsch, F.A., Clein, J., Calef, M. et al.
REFERENCES
(2007). Recent climate-driven increases in vegetation productivity for the western
Angert, A., Biraud, S., Bonfils, C., Henning, C.C., Buermann, W., Pinzon, J. et al. Arctic: evidence of an acceleration of the northern terrestrial carbon cycle. Earth
(2005). Drier summers cancel out the CO2 uptake enhancement induced by Interact., 11, 0004.
warmer springs. Proc. Natl. Acad. Sci. USA, 102, 10823–10827. Lloyd, A.H., Rupp, T.S., Fastie, C.L. & Starfield, A.M. (2002). Patterns and
Barber, V.A., Juday, G.P. & Finney, B.P. (2000). Reduced growth of Alaskan white dynamics of treeline advance on the Seward Peninsula, Alaska. J. Geophys.
spruce in the twentieth century from temperature-induced drought stress. Nature, Res.-Atm., 107, 8161, 15 pp.
406, 668–673. Lucht, W., Prentice, I., Myneni, R., Sitch, S., Friedlingstein, P., Cramer, W. et al.
Beven, K.J. & Kirkby, M.J. (1979). A physically based, variable contributing area (2002). Climatic control of the high-latitude vegetation greening trend and
model of basin hydrology. Hydrol. Sci. Bull., 24, 43–69. Pinatubo effect. Science, 296, 1687–1689.
Bonan, G.B. (2008). Forests and climate change: forcings, feedbacks, and the cli- Lucht, W., Schaphoff, S., Erbrecht, T., Heyder, U. & Cramer, W. (2006). Terrestrial
mate benefits of forests. Science, 320, 1444–1449. vegetation redistribution and carbon balance under climate change. Carbon Bal-
Craig, H. (1957). Isotopic standards for carbon and oxygen and correction factors ance Manage., 1, 6, 7 pp.
for mass spectrometric analysis of carbon dioxide. Geochim. Cosmochim. Acta, 12, Malmström, C.M. & Raffa, K.F. (2000). Biotic disturbance agents in the boreal
133–149. forest: considerations for vegetation change models. Glob. Change Biol., 6, 35–48.
! 2011 Blackwell Publishing Ltd/CNRSLetter Changes in forest productivity across Alaska 7
McGuire, A.D., Anderson, L.G., Christensen, T.R., Dallimore, S., Guo, L., Hayes, Zhang, K., Kimball, J.S., Hogg, E.H., Zhao, M., Oechel, W., Cassano, J.J. et al.
D.J. et al. (2009). Sensitivity of the carbon cycle in the Arctic to climate change. (2008). Satellite-based model detection of recent climate-drive changes in
Ecol. Monogr., 79, 523–555. northern high-latitude vegetation productivity. J. Geophys. Res., 113, G03033,
McGuire, A.D., Ruess, R.W., Lloyd, A., Yarie, J., Clein, J.S. & Juday, G.P. (2010). 13 pp.
Vulnerability of white spruce tree growth in interior Alaska in response to climate Zhao, M. & Running, S.W. (2010). Drought-induced reduction in global terrestrial
variability: dendrochronological, demographic, and experimental perspectives. net primary production from 2000 to 2009. Science, 329, 940–943.
Can. J. For. Res., 40, 1197–1209. Zhou, L., Tucker, C.J., Kaufmann, R.K., Slayback, D., Shabanove, N.V. & Myneni,
McKenney, D.W., Pedlar, J.H., Papadopol, P. & Hutchinson, M.F. (2006). The R.B. (2001). Variations in northern vegetation activity inferred from satellite data
development of 1901–2000 historical monthly climate models for Canada and of vegetation index during 1981 and 1999. J. Geophys. Res., 106, 20069–20083.
the United States. Agr. Forest Meteorol., 138, 69–81.
Myneni, R.B., Hall, F.G., Sellers, P.J. & Marshak, A.L. (1995). The interpretation of
spectral vegetation indices. IEEE Trans. Geosci. Remote Sens., 33, 481–486. SUPPORTING INFORMATION
Myneni, R.B., Keeling, C.D., Tucker, C.J., Asrar, G. & Nemani, R.R. (1997).
Increased plant growth in the northern high latitudes from 1981–1991. Nature,
Additional Supporting Information may be found in the online
386, 698–702. version of this article:
Peñuelas, J. & Boada, M. (2003). A global change-induced biome shift in the
Appendix S1 Background on the use of stable carbon isotopes in
Montseny mountains (NE Spain). Glob. Change Biol., 9, 131–140.
Rahmstorf, S., Cazenave, A., Church, J.A., Hansen, J.E., Keeling, R.F., Parker, D.E.
wood as indicators of drought conditions.
et al. (2007). Recent climate observations compared to projections. Science, 316, Figure S1 Map of growing season length in Alaska derived from
709. Moderate Resolution Imaging Spectroradiometer (MODIS) data.
Scholze, M., Knorr, W., Arnell, N.W. & Prentice, I.C. (2006). A climate-change risk Figure S2 Theoretical example of gross productivity (Prs) calculation
analysis for world ecosystems. Proc. Natl. Acad. Sci. USA, 103, 13116–13120. from yearly NDVI time series.
Sitch, S., Cox, P.M., Collins, W.J. & Huntingford, C. (2007). Indirect radiative Figure S3 Absolute difference in trends in radial growth and remotely
forcing of climate change through ozone effects on the land-carbon sink. Nature,
sensed gross productivity (|sRG ) sPrs|) as a function of tree-ring
448, 791–794.
Tape, K., Sturm, M. & Racine, C. (2006). The evidence for shrub expansion in sample size and area burned.
Northern Alaska and the Pan-Arctic. Glob. Change Biol., 12, 686–702. Figure S4 Time series of mean tree-ring widths and growing season
Tarnocai, C., Canadell, J.G., Schuur, E.A.G., Kuhry, P., Mazhitova, G. & Zimov, S. NDVI for individual stands.
(2009). Soil organic carbon pools in the northern circumpolar permafrost region. Figure S5 Daily tropospheric ozone measurements at Denali National
Global Biogeochem. Cycles, 23, GB2023. Park since 1998.
Tucker, C.J., Pinzon, J., Brown, M., Slayback, D., Pak, E., Mahoney, R. et al. (2005). Figure S6 Correlation between mean tree-ring width and monthly
Extended AVHRR 8-km NDVI data set compatible with MODIS and SPOT
vegetation NDVI data. Int. J. Remote Sens., 26, 4485–4498.
temperature.
Verbyla, D. (2008). The greening and browning of Alaska based on 1982–2003 Figure S7 Summer temperature and vapour pressure deficit from 1988
satellite data. Global Ecol. Biogeogr., 17, 547–555. to 2008 at the Bonanza Creek Long Term Ecological Research site.
Viereck, L.A., Dyrness, C.T. & Foote, M.J. (1993). An overview of vegetation and Figure S8 (a) Comparison of linear trends in Prs over the periods
soils of the floodplain ecosystem of the Tanana River, interior Alaska. Can. J. For. 1982–1991 and 1994–2008, and (b) the linear trend in Prs over the
Res., 23, 889–898. period 2000–2008.
Vingarzan, R. (2004). A review of surface ozone background levels and trends.
Table S1 Overview of tree-ring sampling sites and observed trends in
Atmos. Environ., 38, 3431–3442.
Vogelsang, T.J. (1998). Trend function hypothesis testing in the presence of serial
Prs.
correlation. Econometrica, 66, 123–148. As a service to our authors and readers, this journal provides
Way, D.A. & Oren, R. (2010). Differential responses to changes in growth tem-
supporting information supplied by the authors. Such materials are
perature between trees from different functional groups and biomes: a review
and synthesis of data. Tree Physiol., 30, 669–688. peer-reviewed and may be re-organized for online delivery, but are not
Wittig, V.E., Ainsworth, E.A., Naidu, S.L., Karnosky, D.F. & Long, S.P. (2009). copy edited or typeset. Technical support issues arising from
Quantifying the impact of current and future tropospheric ozone on tree bio- supporting information (other than missing files) should be addressed
mass, growth, physiology and biochemistry: a quantitative meta-analysis. Glob. to the authors.
Change Biol., 15, 396–424.
Yarie, J. (2008). Effects of moisture limitation on tree growth in upland and
Editor, Josep Penuelas
floodplain forest ecosystems in interior Alaska. For. Ecol. Manage., 256, 1055–
1063. Manuscript received 20 September 2010
Zhang, X., Friedl, M.A. & Schaaf, C.B. (2006). Global vegetation phenology First decision made 27 October 2010
from Moderate Resolution Imaging Spectroradiometer (MODIS): evaluation of Second decision made 6 January 2011
global patterns and comparison with in situ measurements. J. Geophys. Res., 111, Manuscript accepted 26 January 2011
G04017.
! 2011 Blackwell Publishing Ltd/CNRSYou can also read