INVESTOR PRESENTATION - Last Updated: June 2021 - The HEINEKEN Company

Page created by Darren Graves
 
CONTINUE READING
INVESTOR PRESENTATION - Last Updated: June 2021 - The HEINEKEN Company
INVESTOR PRESENTATION
Last Updated: June 2021

                          1
INVESTOR PRESENTATION - Last Updated: June 2021 - The HEINEKEN Company
Disclaimer
This presentation contains forward-looking statements with regard to the financial position and results of HEINEKEN’s activities.
These forward-looking statements are subject to risks and uncertainties that could cause actual results to differ materially from those
expressed in the forward-looking statements.

Many of these risks and uncertainties relate to factors that are beyond HEINEKEN’s ability to control or estimate precisely, such as
future market and economic conditions, developments in the ongoing COVID-19 pandemic and related government measures, the
behaviour of other market participants, changes in consumer preferences, the ability to successfully integrate acquired businesses
and achieve anticipated synergies, costs of raw materials, interest-rate and exchange-rate fluctuations, changes in tax rates, changes
in law, change in pension costs, the actions of government regulators and weather conditions. These and other risk factors are
detailed in HEINEKEN’s publicly filed annual reports. You are cautioned not to place undue reliance on these forward-looking
statements, which speak only of the date of this presentation.

HEINEKEN does not undertake any obligation to update these forward-looking statements contained in this presentation. Market
share estimates contained in this press release are based on outside sources, such as specialised research institutes, in combination
with management estimates.

                                                                                                                                          2
INVESTOR PRESENTATION - Last Updated: June 2021 - The HEINEKEN Company
Contents

   Group Overview   Our Strategy - EverGreen   Supporting Information

                                               Brew a Better World Targets,
                                                   Strategy & Progress

                                                Latest Results & Outlook

                                               Leverage & Financial Policy

                                                      Our Markets

                                                Governance, Ownership &
                                                Shareholder Information

                                                                              3
INVESTOR PRESENTATION - Last Updated: June 2021 - The HEINEKEN Company
Investment case: HEINEKEN - The Most International Brewer
    We bring ‘enjoyment of life’ to our customers all over the world by brewing high quality beers and building globally loved brands aimed at
    responsible and sustainable long term value creation for all our stakeholders

    HEINEKEN balanced growth algorithm
                                                              •   CONSUMERS and CUSTOMERS at its core

                                                                                    •    Progressing towards a NET
                                                                                         ZERO, HEALTHIER and FAIRER
•   Proud >150 YEAR OLD heritage as a
                                                                                         WORLD
    family owned, independent brewer              Superior growth
•   Strong TRACK RECORD delivering
                                                                                    •    DISCIPLINED
                                                                                         ENTREPRENEURIAL spirit with
    balanced and superior GROWTH                                                                                       Deliver SUPERIOR TOP-
                                                                                         a decentralized Opco model
                                                                                                                           LINE GROWTH
                                                    Raise the bar on
           Our unique strengths &                   Sustainability &                    Long-term value creation        Gear for OPERATING
           opportunities             Accelerated     Responsibility                                                      LEVERAGE beyond
                                     investments      and People      Continuous
                                      & sharper         strategy     productivity
•   ACCELERATE INVESTMENTS,            resource                    improvements     •   Initial €2bn GROSS COST         SUSTAIN HEALTHY
    including MARKETING and              allocation                                     SAVING programme               DIVIDEND PAY-OUT of
    DIGITALISATION                                                                                                      30-40% of Net Profit
                                                                                    •   COST-CONSCIOUS culture
•   DISCIPLINED use of capital                                                                                                (beia)

                                                                                                                                                 4
INVESTOR PRESENTATION - Last Updated: June 2021 - The HEINEKEN Company
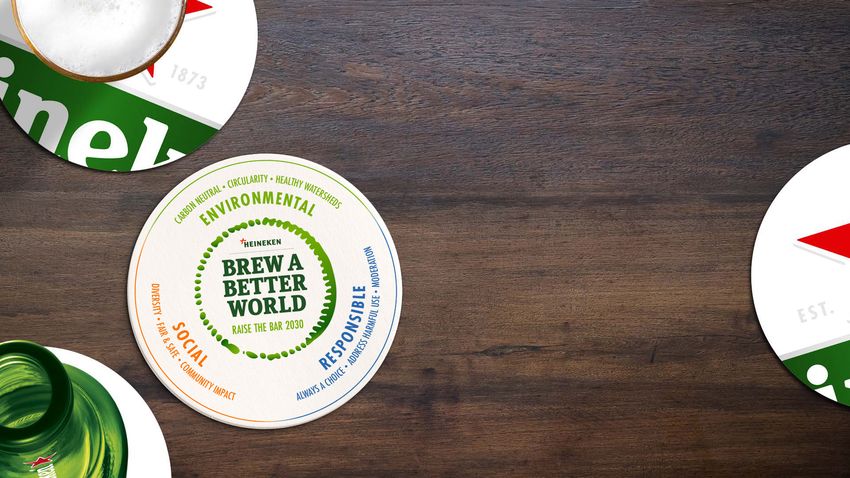
"In a year of unprecedented disruption and transition, our teams rose to the
                                                                                                                   occasion and quickly adapted while not losing sight of the need to continue
At a Glance1                                                                                                       investing for the future. The impact of the pandemic on our business was
                                                                                                                   amplified by our on-trade and geographic exposure. We took diligent cost
                                                                                                                   mitigation actions balanced with continued investment behind our growth
                                                                                                                   platforms. We gained share in most of our key operations, a testimony to our

     52.5                                                #1                                        #2
                                                                                                                   ability to adapt and stay close to our customers and consumers in these
                                                                                                                   turbulent times. The Heineken® brand was a bright star, with a continued
                                                                                                                   outstanding performance in Brazil. I applaud the dedication and resilience of our
       Market Cap                               Brewer in Europe                               Brewer Globally
              (€bn)                                                                                                employees and their commitment to support each other, our customers and
                                                                                                                   communities over the past year.
                                                                                                                   While navigating the crisis, we are building our future. EverGreen leverages both

     >190                                         >160                                         >300                our strengths and new opportunities to chart our next chapter of growth. We
                                                                                                                   aspire to deliver superior and profitable growth in a fast changing world. Firmly
 Countries in which                                                                           International and    putting customers and consumers at the core we aim to continually enhance
  our brands are                                       Breweries                              local beer & cider   and expand our portfolio and footprint. We are stepping up our focus on
     present                                                                                        brands         continuous productivity improvements and raising our environmental and social
                                                                                                                   sustainability ambitions. All of this gives us confidence that we will continue to
                                                                                                                   deliver long-term value for all our stakeholders."

       222                                        Most trusted                                >80,000
Total Beer Volumes                             international beer                             Direct Employees                                     FY2020 Results
                                                     brand                                                                                         Dolf van den Brink
                                                                                                                                                   Chairman Executive Board / CEO

1.   All info refers to FY2020 results. For Market Cap, it refers to status at 31 Dec 2020.
                                                                                                                                                                                                5
INVESTOR PRESENTATION - Last Updated: June 2021 - The HEINEKEN Company
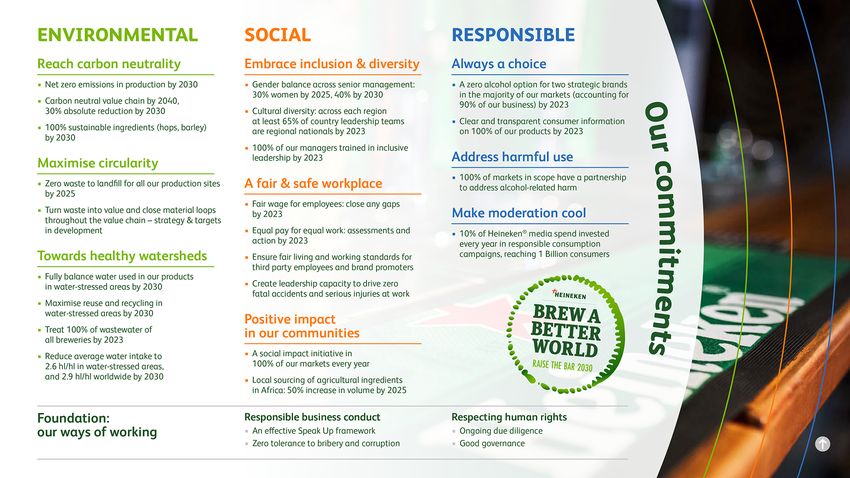
Track record of delivering superior
growth

Revenue OG
avg 2015-20191

HEINEKEN                                                                                                        5.0%
                                                                                                                                     +3.1%
                                                                                                                              Beer Volume OG (avg 2015-2019)

Other brewers                                                                                 3.9%

Spirits                                                                                       3.9%
                                                                                                                                     +5.0%
                                                                                                                              Net Revenue OG (avg 2015-2019)

Food                                                                               3.3%

                                                                                                                                     +7.3%
Soft Drinks                                                            2.6%
                                                                                                                             Operating Profit OG (avg 2015-2019)

1.   Other brewers (ABI, CARLB, STZ & TAP); Spirits (DGE, CPR, RCO & RI); Food (NESN, BN & ULVR); Soft Drinks (CCH, CCEP &
     BVIC). Organic revenue growth as reported by corporates in each year
                                                                                                                                                                   6
INVESTOR PRESENTATION - Last Updated: June 2021 - The HEINEKEN Company
Consolidated Beer Volumes (mhl)1
Diversified global footprint geared for growth
                                                                                                                           18%
                                                                                               34%

                                                                                                         241 mhl

                                           Operating Companies                                                                 36%
                                                                                                    13%
                                           Joint Ventures / Associates
                                           Licences
                                           Export
                                                                                  Operating Profit (beia; €m) 1

                                                                                                                      10%

                                                                                              35%

                                                                                                         €4,020m                    29%

Significant deals

                                                                                                             26%

                                                                                AMEE                Americas                   APAC                Europe
                                                                                                                                                       7
                                                                         1.   Data refers to FY2019 results & excludes Head-Office and eliminations.
INVESTOR PRESENTATION - Last Updated: June 2021 - The HEINEKEN Company
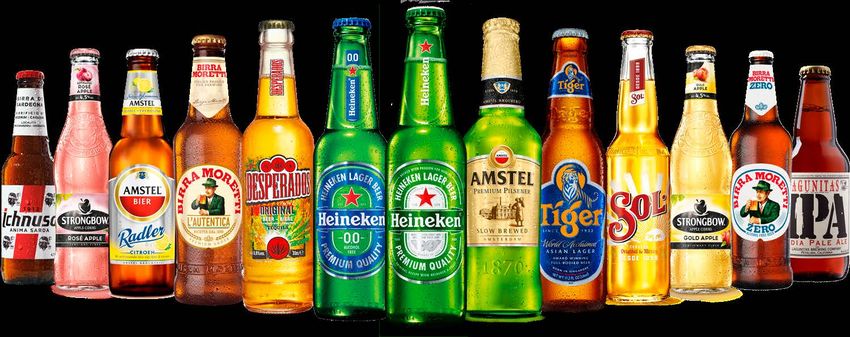
Heineken®: The most trusted international beer
  brand
                                                                            KEY FACTS

                                            Heineken® volume in 2020                # markets in which
                                            -0.4%                           >190    Heineken® is sold as the
                                                                                    most international beer
                                                                                    brand

                                                                                    Heineken® volumes as %
                                            Heineken® Silver more than
                                            doubled its volume in Vietnam   c.20%   of total volumes
                                            and was launched in China
                                                                                    # markets where
                                                                            12      Heineken® >1mhl
                                            Heineken® 0.0 grew double-
                                                                                    # markets where
                                            digits and was launched in 27
                                            new markets in 2020
                                                                            94      Heineken® 0.0 is
                                                                                    available

For more information: Our Heineken® Brand                                                                 8
INVESTOR PRESENTATION - Last Updated: June 2021 - The HEINEKEN Company
Winning portfolio and strong track record in
  building new categories
                                                                        KEY FACTS

                                                                        >300    Brands

                                                                        >40% Revenues from PREMIUM
                                                                               LONO volumes as % of
                                                                               total volumes winning in
                                                                        c.6%   traditional soft drink
                                                                               occasions
                                                                                CIDER as % of total
                                                                                volumes offering an
                                   Top premium beer portfolio
                                                                        c.2%    opportunity to leverage
                                                                                existing assets appealing
      Versatile international and domestic portfolios to successfully
             compete in a wide range of consumer occasions                      to additional consumers

For more information: Our Brands                                                                       9
INVESTOR PRESENTATION - Last Updated: June 2021 - The HEINEKEN Company
Contents

   Group Overview   Our Strategy - EverGreen   Supporting Information

                                               Brew a Better World Targets,
                                                   Strategy & Progress

                                                Latest Results & Outlook

                                               Leverage & Financial Policy

                                                      Our Markets

                                                Governance, Ownership &
                                                Shareholder Information

                                                                              10
HEINEKEN EverGreen growth algorithm

                                              Superior growth

    Our unique strengths                       Raise the bar on
                                                                                    Long-term value creation
    & opportunities        Accelerated         Sustainability &
                                                                      Continuous
                            investments       Responsibility and
                                                                     productivity
                             & sharper         People strategy
                                                                   improvements
                               resource
                                 allocation

                                                                                                               11
HEINEKEN is first and foremost a growth company
 Our 5 pillar growth strategy has consumers and customers at its core

     Footprint                   Portfolio            Route to consumer       Commercial execution   Resource allocation

Strengthen and            Focus and expand            Shape and               Scale execution        Drive intentional
optimise our              our portfolio to            strengthen our route    excellence through     resource allocation
footprint to maintain     better serve                to consumer digitally   commercial             towards growth
a growth advantage        consumers                                           capability building

                                                                                                                      12
Strengthen and optimise our global footprint to
maintain our growth advantage

                                                                                                                                            Strengthen our #1 and #2
                                                                                                                                            positions

                              2019    Colombia
                                                                                                                      2016 Philippines      Greenfield expansion into new
                                                                                                                                            growth markets
2019   Ecuador
                                                                                 2014   Ethiopia

                                                                                          2015     Myanmar                                  Resolve value dilutive
       2020      Peru                                                                                                                       operations
                                          2016    Ivory Coast

                                                                        2017    Mozambique
                                                                                                         2021 Australia

 Markets with #1 or #2 positions HEINEKEN and JV partners       Other markets    White spaces       Greenfield / acquisition market entry

                                                                                                                                                                       13
Amplify our strong premium position

         Heineken®               International brands         Local premium champions

  Win value share, everywhere   Scale and replicate success       Fewer, bigger bets

                                                                                        14
Global market leader in 0.0

     Make 0.0%
     Make 0.0% beer
               beeravailable
                     available everywhere,                                                               Significant 0.0
       everywhere, always
                    always                                                                                opportunity

           Scale Heineken® 0.0 leadership                                                                    5.2x
       Extend 0.0 options across entire portfolio                                           Non-alcoholic beer long term volume growth
                                                                                                            potential1
1.   Assumes closing the penetration gap vs. the benchmark; for FAB the US market is used
     as benchmark, for Low Alcohol Spain and for underserved segments gaps in
     consumption looking at gender, age and affluency
                                                                                                                                         15
Expand our portfolio and innovate
   to better serve consumers

                                                                                                        Significant opportunity
    Expand beer to new                                            Move beyond beer to serve          Blurring             New consumer
consumer needs & occasions                                           consumers better           beverage landscape     segments & occasions

                                                                                                                       Women, affluent, older and
                                                                                                                          young generation

                                                                   Expand leadership in Cider
     Step-up to meet the
                                                                  Speed up to take above fair
                                                                                                      5.5x                     1.2x
  growing demand for easy                                                                        Flavoured alcoholic      Penetration uplift
                                                                    share in Hard Seltzers
 to drink and refreshing beer                                                                    beverages volume      potential in the medium
                                                                           globally
                                                                                                  growth potential1         / long term1
   1.   Assumes closing the penetration gap vs. the benchmark; for FAB the US market is used
        as benchmark, for Low Alcohol Spain and for underserved segments gaps in
        consumption looking at gender, age and affluency
                                                                                                                                               16
Become the best-connected brewer
Strengthening our Route to Consumer, digitally enabled

                                                                                                    1   Digitally connect all our customers via
                        Distributors / Wholesalers           Channels                   Consumers
                                                                                                        B2B, with €10Bn revenue in 2025 (2020:
                                                                                                        >€1bn)
 1                                         2
                                                                                                    2   Full sales force digitally empowered
                                                                                                        by 2023
                                             Digitally   Modern Trade        eRetail
        B2B
                                           Empowered
     platforms
                                 1          Salesforce                                              3   Shaping our “Connected Bar” strategy,
                 Distributor /                                                                          which includes ePOS deployments in
                                     B2B                                3
                 Wholesalers                             Fragmented         Connected                   key markets
                                                            Trade              Bar

                                                                        4                           4   Invest selectively in D2C, with focus
                                                                              D2C                       on Beerwulf, SIX to Go and Drinkies

                                                                        5
                                                                                                    5   Touch all consumers with Individual
                                                                              iDDM
                                                                                                        Data Driven Marketing

                                                                                                                                          17
We see a path to continuous productivity
improvements

Building one company-wide productivity management system                        Starting with €2bn in
                                                                                gross savings initiatives
                  Digitalisation

                                                                                Mitigating cumulative inflation
                              Organisational                                    and transactional FX
    Process                      redesign
standardisation                                Productivity initiative funnel
                                                                                Re-investing in growth:

               Footprint
                                                                                    Restoring Marketing & Sales
              optimisation                                                          spend levels
                                                                                    Front-loading investments in
        Continuous renewal of global and local initiative funnel                    Digital & Technology

                    Embedded in performance management
                                                                                Gearing for operating leverage
                     Cross-OpCo learning and benchmarking                       when top-line recovers

                                                                                                                   18
Three key productivity areas to deliver the €2bn gross savings
Three year programme: implemented over 2021-2023

             Organisational redesign                                                              COGS efficiency             Commercial effectiveness

     ~8,000 FTE                     impacted                                                  Complexity reduction (SKUs)   Digital-enabled sales excellence
                                    direct personnel
              €350m                 cost savings1
                                                                                                 Conversion excellence                Media ROI

              €420m                 restructuring costs2                                         Logistics optimisation      Non-consumer facing spend

                                                                     Total cost to achieve: ~€500m OPEX and ~€400m CAPEX
1.   Excluding savings on other fixed costs (e.g. travel, infrastructure)
2.   In 2020 restructuring costs amounted to €331 million, mainly related to this programme
                                                                                                                                                               19
Accelerate our investments and make them work harder

              Marketing & Sales                              Digital & Technology
          Restore 2019 spend % by 2023                  Front-load investments to accelerate
   Fully reinvest commercial productivity gains   transformation & build a future-proof HEINEKEN

    New consumer propositions & occasions                    Digital core & backbone
              Fewer, bigger brands                           Advanced analytics & BI
        Growing customers and channels                      Digital route to consumer

                                                                                                   20
Sharper and more deliberate marketing and sales
spend allocation

     Optimise spend within OpCos                Focus spend between OpCos
                         Europe example                 APAC example1

                               ~25
                 BRANDS SELECTED                       +90bps
                   focusing on premium            QUICK RECOVERY markets,
                                                        2021 vs 2020

                      Up to 4x
                      INCREMENTAL
               marketing spend in each                 -110bps
                                                 DELAYED RECOVERY markets,
                                  60                    2021 vs 2020

           DEPRIORITIZED BRANDS

1.    Marketing & sales spend as % of revenue
                                                                             21
Disciplined use of capital

1 Improve operating capital efficiency and cash flow conversion

2 Rigorous financial discipline towards investments

3 Committed to Net Debt to EBITDA ratio
Sustainability & Responsibility focus areas in the next decade
Raising the bar with newly launched Brew a Better World 2030 ambitions

Environmental sustainability              Social sustainability          Responsible consumption

             Carbon                         Inclusion & Diversity             Always a Choice

              Water                          Fairness & Safety              Address Harmful Use

            Circularity                         Community                  Make Moderation Cool

                                                                                                   23
Raise the bar on our people strategy

     Strengthen culture             Boost capability building         Enhance OpCo centric model

    High speed and agility              Inclusion & diversity           Disciplined entrepreneurship

Consumer & external orientation      Strong local talent pipeline        Common ways of working

     Cost conscious culture       Foundational & spiky capabilities      Cross-silo learning culture

                                                                                                       24
Recover operating margin by 2023 and gear for operating leverage beyond
                                                     INDICATIVE
                                                                                                    Commercial productivity      Commercial productivity
                                                                                                          savings                  reinvestments

                                                                                                                                                               Margin
            16.8%                                                                                                                                              recovery
                                                                                                                                                              to +/-17%
                                         12.3%

     Operating Margin                   Operating     Topline Growth        Cumulative               Productivity               Reinvestments              Operating Margin
          2019                         Margin 2020                           inflation                 Savings1                                                 2023
                                                     COVID recovery     Includes transactional   €2bn gross savings           Restore Marketing &
                                                                        FX                                                    Sales spend levels
                                                     Gradual on-trade
                                                     recovery           Reversal cost                                         Front-load D&T
                                                                        mitigations 2020                                      investments
                                                     Accelerated
                                                     premiumisation

1.    Excludes 2020 cost mitigations
                                                                                                                                                                          25
Phasing

               2020-2021H1                      2021H2 - 2023                     2024 and beyond

               Mitigate                         Recover & Build                   Grow & Expand

Growth         Pandemic revenue impact          Post pandemic top-line recovery   Superior growth

Productivity   Short-term mitigation            €2bn productivity programme       Operating leverage
                                                                                  Cost-conscious culture

Investments    Reduce all discretionary spend   Restore M&S spend levels          Scale brand investment
               Selective capex investments      Frontload D&T investment          Leverage D&T investment

S&R and        Health & safety focus            Launch next level S&R programme   S&R delivery
People         New team                         Build spiky capabilities          Networked organisation

                                                                                                            26
Our renewed approach to long-term value creation and goals

Deliver SUPERIOR
             TOP-LINE GROWTH
 ACCELERATED INVESTMENT to meet
     fast-changing consumer and customer needs        Growth                    STEP UP capital efficiency
                                                                                Net debt / EBITDA ratio
Contents

   Group Overview   Our Strategy - EverGreen   Supporting Information

                                               Brew a Better World Targets,
                                                   Strategy & Progress

                                                Latest Results & Outlook

                                               Leverage & Financial Policy

                                                      Our Markets

                                                Governance, Ownership &
                                                Shareholder Information

                                                                              28
Brew a Better World 2030

       Path to
       zero impact

       Path to an inclusive,
       fair and equitable world

       Path to moderation and
       no harmful use
ENVIRONMENTAL
                         Base year                  2021                    2023                  2025                   2030                        2040
Reach                    2019                                                                                            • Net zero emissions in • Carbon neutral
                         • Total carbon emissions                                                                          production              across the value
carbon                     across value chain:                                                                                                     chain(1)
                                                                                                                         • 30% reduction in
neutrality                 19.8 CO2-e MT
                                                                                                                           emissions across the
                           69.9 CO2-e kg/hl
                                                                                                                           value chain(1)
                         2020
                                                                                                                         • 100% sustainable
                         • 58% agricultural raw
                                                                                                                           ingredients
                           materials from sustainable
                                                                                                                           (barley & hops)
                           sources, 62% for barley

Maximise                 2020                     • Develop a dedicated                           • Eliminate sending
                         • 118 of our 166 sites     strategy and related                            waste to landfills
circularity                were waste to landfill   targets to turn waste                           across all
                           free                     into value and close                            production sites
                                                    material loops
                         • 98% of our total         throughout our value
                           waste was reused or      chain
                           recycled

Towards                  2018                                               • 100% treatment of                          • Fully balance water
                         • 3.2 hl/hl average                                  wastewater of all                            used in our products
healthy                    water intake in                                    breweries                                    in water-stressed areas
watersheds                 water-stressed areas
                                                                                                                         • Maximise reuse and
                           (2020: 3.1 hl/hl)
                                                                                                                           recycling in water
                                                                                                                           stressed areas
                         • 3.5 hl/hl average
(1)   Scope 1, 2 and 3     water intake                                                                                  • Reduce average water
                           worldwide                                                                                       intake to 2.6 hl/hl in
                           (2020: 3.4 hl/hl)                                                                               water-stressed areas
                                                                                                                           and 2.9 hl/hl worldwide
SOCIAL
                        2020 (Base year)             2023                         2025                          2030
Embrace                 • 23% women represented      • At least 65% of country    • 30% women represented       • 40% women represented
inclusion & diversity     in senior management         leadership teams to be       in senior management          in senior management
                                                       regional nationals

                                                     • 100% of management
                                                       trained in inclusive
                                                       leadership

A fair & safe           • New metrics currently      • Close any gaps on fair
                          under development            wages for employees
workplace
                                                     • Equal pay for equal work
                                                       assessments and actions done
                                                     Continuous:
                                                     • Create leadership capacity to drive zero fatal accidents and serious injuries
                                                     • Fair living and working standards for 3rd party employees and brand promoters

Positive impact in      • 45% of agricultural raw                                 • In Africa, increase local
                          materials used in Africa                                  sourcing of agricultural
our communities
                          were regionally sourced                                   ingredients volumes by
                                                                                    50% (vs 2020)
                                                      Every year:
                                                      • A social impact initiative in 100% of our markets
RESPONSIBLE
                                                                  2020 (Base year)                          2023                                 2030
Always a choice                                                   • Heineken® 0.0 available in 84       • A zero alcohol option for 2
                                                                    markets; over 130 non-alcoholic       strategic brands in majority of our
                                                                    line extensions of brands available   markets (accounting for 90% of
                                                                                                          our business)
                                                                  • 89% of products included
                                                                    information on ingredients,         • 100% of products to include clear
                                                                    nutrition, alcohol content and        and transparent consumer
                                                                    allergens                             information

Address harmful use                                               • 65% in scope markets(1)                 Continuous:
                                                                                                            • 100% of markets in scope(1) have a partnership to address alcohol-
                                                                                                              related harm

Make moderation cool                                              • 55% of the 84 markets in scope(2)       Every year:
                                                                    invested at least 10% of                • 10% of Heineken® media spend invested in responsible consumption
                                                                    Heineken® media spend                     campaigns, reaching 1 billion consumers

(1) Markets where we consider our business to have an opportunity to make a positive difference
    in reducing harmful use of alcohol in partnership with other stakeholders (2020: 37 markets in scope)
(2) Every market where we sell and advertise Heineken®
More information on Brew a Better World
                                                                                                                     Brew a Better World
                                                                                                                          Strategy

Our Policies relating to Brew a Better World
Upholding our values means being crystal clear about how we do business and how we conduct ourselves as
individuals. Our Code of Business Conduct and its underlying policies are at the heart of Brewing a Better
World.
For more information: Our Policies

Our Ratings & Benchmarks                                                                                             Whats Brewing Seminar:
Our commitment is to create genuine shared value and improve transparency. We are constantly increasing
the quality and quantity of our data for stakeholders. This includes benchmarking our performance against              Raise the Bar 2030
other companies and openly sharing our results.
For more information: Ratings & Benchmarks

Our Brew a Better World Reporting Centre
For latest progress and reports, including the GRI reference table and Environmental Data Table.
For more information: Reporting Centre
                                                                                                             To listen to our panel discussion hosted on 11
                                                                                                                       May 2021: Panel Discussion

                                                                                                                                                      34
Contents

   Group Overview   Our Strategy - EverGreen   Supporting Information

                                               Brew a Better World Targets,
                                                   Strategy & Progress

                                                Latest Results & Outlook

                                               Leverage & Financial Policy

                                                      Our Markets

                                                Governance, Ownership &
                                                Shareholder Information

                                                                              35
Latest Results Announcement

   2021 Q1 Organic Growth %
                                                               Africa, Middle
                                                               East & Eastern
                                                 Heineken NV       Europe                Americas              Asia Pacific               Europe

  Consolidated beer volume                            0.0             9.9                     0.8                    5.4                    -9.7

  Heineken volume                                    12.1            22.4                    17.5                   21.8                    -4.6

  Key Highlights                                                 Dolf van den Brink, CEO:
  •    Beer volume stable organically                            “We had a solid start to the year, despite facing severe restrictions across many
                                                                 markets and the closure of the on-trade in Europe due to the pandemic. Overall
  •    Heineken® volume growth accelerated +12.1%                beer volume was in line with last year, with strong growth in Africa, Middle East &
                                                                 Eastern Europe and Asia Pacific and modest growth in the Americas. The
  •    Premium volume outperformed growing in the low-teens      Heineken® brand had a stellar performance, up 12.1%, with double-digit growth
                                                                 in more than 40 countries. I am proud of our employees' relentless resilience and
  •    Deployment of EverGreen growth strategy on track          agility in responding to the ongoing volatility. We are making great strides in the
                                                                 deployment of our EverGreen growth strategy on all fronts. Most recently, we
                                                                 announced our ambition to become carbon neutral by 2040.”

For more information: Q1 2021 Trading Update
Latest Financial Overview – FY 2020

  Key Financials                                               Total     Organic
  €m unless otherwise stated                       FY 2020    Growth     Growth
  Revenue                                            23,770     -16.7%

  Net revenue (beia)                                 19,724                -11.9%

  Operating profit (beia)                             2,421                -35.6%

  Operating profit (beia) margin                      12.3%   -455 bps

  Net profit (beia)                                   1,154                -49.4%

  Net loss                                             -204    -109.4%

  Diluted EPS (beia) in €                              2.00     -54.3%

  Free operating cash flow                            1,513

  Net Debt/EBITDA (beia) ratio                         3.4x
For more information: FY20 Results Press Release
                                                                                    37
Consolidated Beer Volumes Organic Growth %
                                                                             11.8%

                                                                    8.9%
                                                                           8.2%

                             5.0%                  5.4%
                        4.8%     4.6%
       4.2%
3.0%          3.1%                          3.3%
                                                          2.6%
                                                                                                 1.3%
                                                                                          0.2%
                                                                                                   -0.2%

                                                            -7.5%                 -7.9%
                -8.1%                                                                                   -8.2%
                                    -9.2%
       Group                 AMEE              Americas                    APAC                  Europe

                2017       2018         2019        2020
                                                                                                                38
Net Revenue Organic Growth %
                      13.5%
                          11.1%                                        10.9%
                                8.9%          8.3%
                                                     7.5%
       6.1% 5.6%                          6.0%                  6.2% 5.8%
5.0%
                                                                                         3.0%
                                                                                     1.4%     2.0%

                                                        -2.9%

                                  -9.5%
             -11.9%                                                         -11.5%

                                                                                                -18.8%
       Group              AMEE                Americas               APAC                Europe

               2017      2018          2019      2020
                                                                                                         39
Operating Profit (beia) Organic Growth %
                         33.8%

                             16.2%
                                                11.7%                      12.1%
9.3%                                               4.6%             9.5%                7.7%
       6.4%                                                             3.4%
              3.9%                                        4.6%                                 4.2%

                                 -0.2%                                                           -0.8%
                                                            -4.8%

                                                                               -16.4%

                -35.6%               -33.8%

                                                                                                      -68.6%
       Group                 AMEE                 Americas              APAC               Europe

                2017       2018          2019        2020
                                                                                                               40
Operating Margin development

                                                                                              33.8%
                                                                                    32.9%32.3%
                                                                                                   32.0%

                                                              18.8%
17.4%16.9%16.8%
                                                                  16.5%16.2%16.5%

                                     13.5%                                                                 13.7%14.0%13.5%
                   12.3%        12.8%
                                          12.1%

                                                       9.5%

                                                                                                                             5.2%

     Group                              AMEE                     Americas                 APAC                 Europe

              2017                2018               2019         2020
                                                                                                                                    41
      2017 restated for IFRS15 and 2018 restated for IAS37
Diluted EPS (beia)

                                     4.38 €
                            4.25 €
                   3.94 €
 3.57 €   3.68 €

                                              2.00 €

 2015     2016     2017     2018     2019     2020

                                                       42
Dividend per share and pay-out ratio

                                                                            Dividend Policy
                                            1.68 €            40%
                                   1.60 €
                                                                    Dividend pay-out ratio of 30%-40%
                          1.47 €
                                                              35%   of net profit before exceptional
                 1.34 €
1.30 €                                                              items and amortisation of brands
                                                              30%
                                                                    (net profit beia).
                                                              25%
                                                                    Dividends are paid as an interim
                                                              20%   dividend and a final dividend. The
                                                     0.70 €
                                                              15%   interim dividend is fixed at 40% of
                                                                    the total dividend of the previous
                                                              10%   year.
                                                              5%
                                                                    Annual dividend proposals will
                                                              0%    remain subject to shareholder
2015             2016     2017     2018     2019     2020           approval.

 Pay-Out ratio
                                                                                                     43
 DPS
For 2021, we expect

Pandemic to continue to impact first half of 2021

Conditions to gradually improve in second half 2021

Product & channel mix to continue to adversely impact results

A higher negative transactional currency impact on input costs

Revenue, operating profits and margin to stay below 2019 level

                                                                 44
Contents

   Group Overview   Our Strategy - EverGreen   Supporting Information

                                               Brew a Better World Targets,
                                                   Strategy & Progress

                                                Latest Results & Outlook

                                               Leverage & Financial Policy

                                                      Our Markets

                                                Governance, Ownership &
                                                Shareholder Information

                                                                              45
Committed to long term target
Overview of financial debt position

      Total Interest Bearing Debt1 of €18.2bn                                                                                                                Funding Sources

    Euro Medium Term Note program of €20 billion listed on Luxembourg stock exchange
    USD 4 billion of outstanding 144a notes issued in the US debt capital markets
    Group Revolving Credit Facility of €3.5 billion (currently undrawn) committed by 19 banks maturing in 2024
    Euro Commercial Paper program of €2 billion with a Short Term European Paper (STEP) label

        1 Reflects the impact of the change in accounting policy on netting of cash and overdraft balances in cash pooling arrangements. The amount subject to legal offset rights, but not netted in the statement of financial

        position is € 235m. If netted, Gross debt would amount to € 17,961m. Taking the cash balances into account as well, the net debt amounts to € 14,210m as per 31 Dec 2020.

                                                                                                                                                                                                                                   47
A well balanced bond maturity profile
    Optimise debt repayments via well balanced maturity profile

    As at 31 December 2020 (in €m) incl. the currency effect of cross-currency interest rate swaps

    In 2020, the following notes were issued under Euro Medium Term Note program:
          On 20 March 2020, CHF100 million of privately placed 5-year Notes with a coupon of 0.6375%
          On 30 March 2020, €600 million of 5-year Notes with a coupon of 1.625%
          On 30 March 2020, €800 million of 10-year Notes with a coupon of 2.25%
          On 7 May 2020, €650 million of 13-year Notes with a coupon of 1.25%
          On 7 May 2020, €850 million of 20-year Notes with a coupon of 1.75%
    From time to time HEINEKEN may repurchase notes maturing within 12 months for cash management purposes
                                                                                                              48
Conservative risk management policy
  In both currencies and interest rates

   Currency split of Net Debt (per 31 Dec 2020)

                                                                                                             HEINEKEN hedges up to 90% of its net US dollar cash flows
                                       7%                                                                     on the basis of rolling forecasts, for a period of up to 18
                                                                                                              months
                            11%
                                                                                                             Approximately 100% of average net debt is at fixed rates as
                                                                                                              per 31 December 2020 on the high end of the policy of
                                                                                                              “≥75% of interest on net debt is fixed”
                      18%
                                                                                                             The Group aims to match the currency split of net debt with
                                                              64%                                             the currency split of the EBITDA (beia) in order to match
                                                                                                              cash flows for certain currencies

                                                                                                             USD debts also aim to match EBITDA in currencies that are
                                                                                                              proxies of USD

* Includes CCIRS deals associated with the relevant debt amounts and includes IFRS 16 lease liabilities

                                                                                                                                                                        49
Solid Investment Grade Ratings
    Rated by Moody’s and S&P since 2012

                              Baa1 / stable outlook (17 July 2020)                             BBB+ / negative outlook (27 April 2020)

    “The rating takes into account the strong business profile and        “The negative outlook reflects significant pressure on 2020
     the resilient fundamentals of the beverage industry in times of        operating performance due to the COVID-19 pandemic and the
     economic stress. Credit metrics will weaken temporarily, recover       risk that the situation does not improve in 2021 once social
     in 2021, but only return within the Baa1 thresholds by 2022            distancing measures are relaxed
    Leading brewery company with broad geographical                       Lockdowns, social distancing, and the imminent economic
     diversification with a strong product portfolio and a higher           recession are reducing beer consumption. We therefore foresee a
     contribution from the premium segment                                  significant fall in Heineken's revenue and EBITDA in 2020
    Presence in emerging markets allows for higher-than-average           Credit metrics will likely deteriorate significantly in 2020 but at this
     growth rates in both volume and sales, while such also leaves          stage we assume a rebound in 2021
     the company exposed to more volatile market conditions and
     less predictable regulatory environments                              The company has been prudently managing risk to maintain
                                                                            adequate liquidity with prefinancing of debt maturities, the
    Excellent liquidity with available cash balances and a sizeable        absence of maintenance covenants on any credit facilities, and
     committed revolving credit facility of €3.5 billion and does not       easy access to capital markets.”
     contain financial covenants”

                                                                                                                                                50
Contents

   Group Overview   Our Strategy - EverGreen   Supporting Information

                                               Brew a Better World Targets,
                                                   Strategy & Progress

                                                Latest Results & Outlook

                                               Leverage & Financial Policy

                                                      Our Markets

                                                Governance, Ownership &
                                                Shareholder Information

                                                                              51
HEINEKEN Group
                                                                                                                                     70+
                                                                                                                                   Countries
     Consolidated Beer                                                Net Revenue                  Operating Profit (beia)
      Volumes (mhl)                                                       (€m)                              €m                      160+
                                                                                                                                   Breweries

                                18%                                                  14%                         10%
                                                                                                                                    300+
   34%                                                                                               35%
                                                                                                                                    Brands
                                                             43%
                   241                                                       23,894                        4,020       29%
                                                                                           30%                                    >80,000
                                                                                                                               Direct Employees
                                    35%
         13%
                                                                               13%                         26%
                                                                                                                                    54%
                                                                                                                             Group Operating Profit
                                                                                                                                     from
                                                                                                                              developing markets

                                                         AMEE                Americas      APAC   Europe
Source: 2019 Results
Regional Exposure per metric excludes effect of Head-Office & Eliminations
                                                                                                                                                  52
Limited reliance on individual markets

                                           100%
 >50
                                                  • Only two countries >10% of profits; Mexico &
                                           ~80%       Vietnam
                                                  •   Diversified mix of countries:
                                                  •   Established markets with steady improvements
  11                                       ~50%   •   Developing markets at different stages of growth
                                                  •   Large collection of small markets with growth
                                                      potential
                                           ~30%
   4
   2
         # markets         % share of Operating
                               Profit (beia)
    Source: 2019 Results
                                                                                                      53
AMEE Region                                                                      % Contribution to Group in
                                                                                             2019
Total Consolidated Vol (mhl)             Net Revenue Beia (€m)
                           49.9                             3,370
  45.7              47.9          45.4    3,031    3,051                                                       10%
                                                                     2,782
                                                                               18%              14%
                                                                                                              Operating
                                                                             Beer Volume      Net Revenue
                                                                                                                   Profit

                                                                                            Key Markets
2017              2018     2019   2020    2017     2018    2019      2020
                                                                                                       # market position
Operating Profit Beia (€m)               Operating Margin Beia (%)           Nigeria                          #1
                    411    408                                               Russia                           #3
  388
                                           12.8%   13.5%                     South Africa                     #2
                                                            12.1%
                                  264                                9.5%    Ethiopia                         #2
                                                                             Egypt                            #1
                                                                             DRC                              #1
                                                                             Mozambique                       #2
                                                                             Ivory Coast                      #2
2017              2018     2019   2020    2017     2018    2019      2020
                                                                                                                        54
2017 restated for IFRS15
AMEE Region – FY2020
                                                                                 “Despite the many challenges of
  Net Revenue (beia) OG                   Operating Profit (beia) OG            2020, the long term future for the
                                                                               region remains bright. We believe in
  -9.5%                                   -33.8%                                  the dynamism, resilience and
                                                                                entrepreneurial spirit of the Africa,
                                          Price Mix on constant geographic       Middle East and Eastern Europe
  Beer Volume OG
                                          basis                                region and are committed as a long
  -9.2%                                   +2.2%
                                                                                  term partner for recovery and
                                                                                             growth.”

Strong recovery in NIGERIA in second half, growing volume FY and winning                 Roland Pirmez
market share. Double-digit growth in premium, led by Heineken® and Tiger       President, Africa, Middle East and
                                                                                        Eastern Europe
SOUTH AFRICA strong momentum disrupted by alcohol bans and capacity
constraints. Heineken® 0.0 grew double-digits

PREMIUM PORTFOLIO outperformed broader portfolio in most key markets
like Nigeria, Ethiopia, Russia, the DRC, Ivory Coast, Burundi and Mozambique

                                                                                                                 55
Nigerian Breweries

                      Key Facts                              Comprehensive brand portfolio
   9 breweries and 2 malting plants                                                                • The Nigerian beer market remains
    #1 or #2 brands in all segments                               Segment            Core brands      attractive given its high growth
                                                                                                      potential and an improving
                                                             International premium                    macroeconomic environment
                                                                                                   FY2020:
                                     Kudenda Malting Plant
                                                               National premium
                                                                                                   • Beer volume recovered strongly in
                      Kudenda               Kakuri                                                    the second half of the year delivering
                                                                                                      low-single digit growth for the full
               ibada
                 n
                                           Makurdi
                                                                 Mainstream                           year, ahead of the market.
    Ota                     Onitsh
                              a              Ama
                                                                                                   • The premium portfolio grew double-
     Lagos
                                 Aba Malting Plant
                                                                                                      digits, led by Heineken® and Tiger.
                                                                   Discount
             Ljebu-
              Ode                    Aba
                                                                                                      Desperados was launched at the end
                                                                                                      of the year.
                   Awo-
                  Omamma                                                                           • Our low- and non-alcoholic portfolio
                                                                                                      grew by a mid-single-digit, with
    Source: Global data, Company data
                                                                                                      strong growth from Maltina including
                                                                                                      the launch of two new flavours.
For more information: https://nbplc.com/                                                                                                       56
Americas Region                                                                                       % Contribution to Group in
                                                                                                                  2019
Total Consolidated Vol (mhl)                                   Net Revenue Beia (€m)
                                      94.7
                                                                                                                                   29%
                    93.6                                                          7,429
                                                       86.0               6,781
                                                                                                      35%             30%
  79.0                                                           6,307                     6,319

                                                                                                                                  Operating
                                                                                                    Beer Volume     Net Revenue
                                                                                                                                    Profit

                                                                                                                  Key Markets
2017              2018              2019               2020     2017     2018     2019     2020

Operating Profit Beia (€m)                                     Operating Margin Beia (%)

  1,188                               1,204                      18.8%    16.5%    16.2%
                    1,118                              1,045                                16.5%

2017              2018              2019               2020     2017     2018     2019     2020
                                                                                                                                         57
2017 restated for IFRS15 and 2018 restated for IAS37
Americas Region – FY2020
                                                                                   “Our people have shown great
  Net Revenue (beia) OG                     Operating Profit (beia) OG             resilience throughout the crisis,
                                                                                  and together we have delivered
  -2.9%                                     -4.8%                                  strong growth in premium beer
                                                                                     led by Heineken®, launched
                                            Price Mix on constant geographic      successful innovations, and with
  Beer Volume OG
                                            basis                                     significant cost mitigations
  -7.5%                                     +6.8%
                                                                                 continued our profitable growth.”

                                                                                          Marc Busain
MEXICO government restrictions and dry laws eased in second half. Strong               President Americas
price mix c. 2x inflation. Amstel Ultra, Heineken® 0.0 and cider grew strongly

BRAZIL volume flat while hitting maximum capacity in Q4. Rev per hl growth in
the low teens. Premium and mainstream grew double-digits, now 50% of the
beer portfolio led by Heineken® with >40% growth

USA impacted by supply disruptions and on-premise closures. Heineken® grew
low single-digit, the best performance in a decade. Heineken® 0.0 is #1 in
non-alcohol
                                                                                                                  58
HEINEKEN Mexico

            Key Facts                               Comprehensive portfolio
             7 Breweries                                                                        •   HEINEKEN’s largest beer operation with
                                                                                                    positive underlying market fundamentals,
             #2 Position                             Segment                      Core brands
                                                                                                    including population growth, urbanisation,
                                                                                                    growing middle class, etc

                                                      Premium
                                                                                                •   Premium presents significant opportunity,
                                                                                                    currently accounting for only c.5% of total
                                                                                                    beer market.
                                                                                                •   Building a cider category growing double
                                                Affordable-Premium                                  digits in FY2020
                                                                                                •   Pure Piraña is the first nationwide seltzer
                                                                                                    brand available across all channels,
                                                    Mainstream
                                                                                                    complemented by Amstel Ultra Seltzer,
                                                                                                    launched in January 2021.
                                                                                                FY2020:

• Meoqui brewery, the largest greenfield in      Below Mainstream                               •   Beer volume declined in the mid-teens as our
                                                                                                    operations were suspended for most of the
   HEINEKEN’s history, opened in February                                                           second quarter and faced operating
   2018                                                                                             restrictions the rest of the year.
                                                       Value
                                                                                                •   Net revenue per hectolitre (beia) close to
                                                                                                    twice the inflation rate.
                                              Source: Global data, Company data

                                                                                                                                                  59
HEINEKEN Brazil

             Key Facts                                               Strong portfolio
  15 breweries; c.20% Market share;                                                                  •   Heineken® is most loved brand in Brazil
        #2 Position in market                             Segment                      Core brands   •   Focused on growing mainstream and
                                                                                                         premium portfolios (especially in the
                                                                                                         North/North East), whilst value brands
                                                         Premium and                                     provide increased scale to further develop
                                                                                                         premium
                                                        Super Premium
                                                                                                     •   February 2021, HEINEKEN, The Coca-Cola
                                                                                                         Company and the Coca-Cola System in Brazil
                                                                                                         announced the redesign of their long-
                                                      Upper Mainstream                                   standing distribution partnership.
                                                        & Mainstream                                 FY2020:
                                                                                                     •   Beer volume was flat, as we reached
                                                                                                         maximum capacity in the last quarter of the
                                                      Lower Mainstream                                   year and led the market with two price
                            São Paulo HQ
                                                           & Value                                       increases.
                                                                                                     •   Premium and mainstream portfolios grew
• Ponta Grossa brewery expansion expected to                                                             double-digits and now represent 50% of our
   be completed in Q3/Q4 2021.                                                                           total beer portfolio. Heineken® grew in the
                                                                                                         forties and. Heineken® 0.0 was successfully
• Announced intention to build its first brewery                                                         launched in July 2021 and is already the
   in the state of Minas Gerais.                   Source: Global data, Company data                     third largest market globally for Heineken®
                                                                                                         0.0.
                                                                                                                                                      60
HEINEKEN USA

     Key Facts                                               Strong portfolio
  9 Distribution Centres                                                                             • USA is largely an import market for
         8 Offices                                  Segment                            Core brands      HEINEKEN
  #2 Premium Position                                                                                FY2020:
                                                                                                     • Beer volume declined by a mid-
                                                                                                        single-digit, impacted by supply
                                                    Premium &
                                                                                                        disruptions from Mexico and on-
                                                  Super Premium                                         trade closures.
                           White Plains HQ
                                                                                                     • Heineken® delivered its best
                                                                                                        performance in >10 years growing by
                                                                                                        a low-single-digit. The growth came
                                                                                                        from both Original and the strong
                                                   Mainstream                                           performance of 0.0, now the number
                                                                                                        one non-alcoholic brand in the
                                                                                                        market.
                                                                                                     • Together with AriZona launched
                                                                                                        AriZona SunRise Hard Seltzer in
                                                                                                        2021. Testing other seltzers
                                                                                                        innovations in selected states.
                                             Source: Global data, Company data- 2018

                                                                                                                                             61
APAC Region                                                                      % Contribution to Group in
                                                                                             2019
Total Consolidated Vol (mhl)              Net Revenue Beia (€m)

                    29.7   31.8
                                   28.7     2,928    2,919
                                                             3,205
                                                                                                                26%
  27.6                                                                2,707
                                                                                 13%             13%
                                                                                                               Operating
                                                                               Beer Volume     Net Revenue
                                                                                                                    Profit

                                                                                             Key Markets
2017              2018     2019    2020    2017     2018     2019     2020
                                                                                                        # market position
Operating Profit Beia (€m)                Operating Margin Beia (%)            Vietnam                         #1

                           1,085                                               Cambodia                        #1
                     943                             32.3%    33.8%
   962                                      32.9%                      32.0%
                                    867                                        Malaysia                        #1
                                                                               Indonesia                       #1

2017              2018     2019    2020    2017     2018     2019     2020
                                                                                                                         62
2017 restated for IFRS15
APAC Region – FY2020
                                                                             “A challenging 2020 accelerated
  Net Revenue (beia) OG                   Operating Profit (beia) OG          our transformation into a more
                                                                               adaptable and agile business.
  -11.5%                                  -16.4%                               Whilst countries will recover at
                                                                               different speeds, this gives us
                                          Price Mix on constant geographic   renewed confidence in our long-
  Beer Volume OG
                                          basis                              term growth strategy in a region
  -7.9%                                   -2.4%
                                                                              that continues to be the world’s
                                                                                      growth engine.”

VIETNAM volume was stable, significantly outperforming the market and             Jacco van der Linden
confirming our market leadership. Mainstream grew double-digits with Larue        President Asia Pacific
and Bia Viet. Heineken® Silver doubled its volume.

CHINA strong double-digit Heineken® growth. Now in the top five markets
for the brand globally

INDONESIA heavily impacted by absence of tourism and on-trade
restrictions. Outperformed the market in all regions, except Bali

                                                                                                             63
HEINEKEN Vietnam

        Key Facts                                Strong portfolio
                                                                                   • Market leadership in a very
          6 Breweries                                                                 favourable beer market and
           #2 Position                 Segment                       Core brands      opportunity to further expand into
#1 position in premium segment                                                        rural areas and the North
                                                                                   FY2020:
                                                                                   • Beer volume was stable, significantly
                                        Premium                                       outperforming the market which
                                                                                      declined double-digits.
                                                                                   • In mainstream, Larue grew double-
                                                                                      digits and we launched Bia Viet, a
                                                                                      national mainstream.
                                                                                   • In premium, Tiger declined high-
                                                                                      single digits, outperforming the
                                 Mainstream & Economy                                 market.
                                                                                   • Heineken® Silver more than doubled
                                                                                      its volume and Heineken® 0.0 was
                                                                                      launched at the start of the year.

                                 Source: Global data, Company data

                                                                                                                             64
United Breweries Limited

                  Key Facts                                                            Strong portfolio
                21 Breweries
            12 contract breweries                                           Segment                Core brands
             #1 Market position                                                                                  • HEINEKEN’s stake in UBL 46.52%
                                                                                                                 • India beer PCC is slightly above 2L
                                                                                                                 • Strict regulations on the
                                                                                                                    production, transportation,
                                                                          Super Premium                             distribution, promotion, pricing
                                                                                                                    and sale of alcohol; albeit positive
                                                                                                                    trajectory on taxing of beer vs
                                                                                                                    spirits

                                           21 breweries
                                                                     Premium and Premium Plus
                                                                                                                 • UBL has the leading beer brand
                                       12 contract breweries                                                        with Kingfisher (UBL market share
                                                                                                                    48%)

                                                                              Value
Source: World Bank population estimates, Global data, Company data
PCC: Per Capita Consumption
                                                                                                                                                     65
China Resources Beer Holdings

           Key Facts                            Strategic collaboration
           70 Breweries                                                   • HEINEKEN’s stake in CR Beer 20.6%
Present in 25 out of 34 regions in                                        • PCC c.30l, with signficant growth potential
              China                                                          (predominantly in Premium)
       #1 Market position
                                                                          • Snow, No. 1 beer brand by volume in the
                                                                             world
                                                                          • Market leader with MS ~ 23%
                                                                          • Best-in-class, nationwide distribution
                                                                             network

                                                                          • Started distribution of Heineken® in May
                                                                             2019, launched Amstel as premium in
                                                                             December 2020

      Source: Global data, Company data- 2018

                                                                                                                     66
Europe Region                                                                         % Contribution to Group in
                                                                                                  2019
Total Consolidated Vol (mhl)               Net Revenue Beia (€m)

  97.4              98.6    99.7             10,014   10,348   10,629
                                                                                                                  35%
                                    88.8                                8,631
                                                                                  34%              43%
                                                                                                                 Operating
                                                                                Beer Volume      Net Revenue
                                                                                                                      Profit

                                                                                              Key Markets
2017              2018      2019    2020    2017      2018     2019     2020
                                                                                                          # market position
Operating Profit Beia (€m)                 Operating Margin Beia (%)            United Kingdom                   #1
                                                                                France                           #1
                    1,451   1,436                      14.0%    13.5%
  1,371                                       13.7%
                                                                                Spain                            #2

                                     447                                 5.2%   Italy                            #1
                                                                                Poland                           #2
                                                                                Netherlands                      #1

2017              2018      2019    2020    2017      2018     2019     2020
                                                                                                                           67
2017 restated for IFRS15
Europe Region – FY2020
                                                                                “The health and safety of our
  Net Revenue (beia) OG                   Operating Profit (beia) OG          people and partners was the first
                                                                               priority. This focus allowed us to
  -18.8%                                  -68.6%                                  ensure business continuity.
                                                                              With the implementation of strong
                                          Price Mix on constant geographic       plans, we were able to gain
  Beer Volume OG
                                          basis                                 value share in most markets.”
  -8.2%                                   -5.4%                                         Soren Hagh
                                                                                      President Europe
High exposure to ON-TRADE heavily impacted results, particularly in Q2
and Q4

OFF-TRADE continued to grow, driven by premium with strong performance
of Desperados, Birra Moretti and Sol. Outperformed the market in UK, Italy,
France, Spain, Poland and the Netherlands

NON-ALCOHOL portfolio outperformed the market led by Heineken® 0.0,
strengthening our leadership in the segment

                                                                                                              68
Wholesale strategically important in selected markets

               Key Facts                         Business model
 Wholesale operations focused on on-
                                                                    Off Trade
  trade service and particularly draught
 Providing synergies with commercial         Brewery
  brewing operations:
   Higher proximity to customer                                    On Trade
   Better access to broad range of data
   Reliable and secure access to markets
   Consumer touchpoints
                                            Cash &        HNV        3rd party
                                             Carry      Wholesale    Wholesale

                                                         Outlets
                                                                                 69
Star Pubs & Bars

        A highly successful & profitable                                Strategically important
                business model                                            to the UK business
   >2,500 leased and tenanted pubs since Punch
                                                          Hands-on experience & understanding of the On Trade
    acquisition
    with a wide UK footprint                              Unique consumer touchpoints
   Star Pubs & Bars strong investment & performance      Synergies with on trade brewing operations
    track-record                                          Unique platform for seeding innovations
   Attractive returns – Margin, Cashflow & RONA

                         Operating profit margin
                                 (2019)

                        UK Avg. Beer & Cider   Pubs                                                         70
Contents

   Group Overview   Our Strategy - EverGreen   Supporting Information

                                               Brew a Better World Targets,
                                                   Strategy & Progress

                                                Latest Results & Outlook

                                               Leverage & Financial Policy

                                                      Our Markets

                                                Governance, Ownership &
                                                Shareholder Information

                                                                              71
Renewed Executive Team

                                                 Dolf van den Brink                                                Harold van den Broek
                                                 Chief Executive Officer &                                         Chief Financial Officer &
                                                 Chairman of the Executive Board                                   Member of the Executive Board
                                                 ET member since: April 2018                                       ET member since: June 2021
                                                 Years in company: 23                                              Years in company: -

                          Marc Busain                                              Roland Pirmez                                     James Thompson
                          President Americas                                       President AMEE                                    Chief Commercial Officer
                          ET member since: July 2015                               ET member since: July 2015                        ET member from: March 2021
                          Years in company: 25                                     Years in company: 26                              Years in company: -

                                                                                   Stacey Tank
                          Søren Hagh                                                                                                 Magne Setnes
                                                                                   Chief Corporate Affairs &
                          President Europe                                                                                           Chief Supply Chain Officer
                                                                                   Transformation Officer
                          ET member since: June 2020                                                                                 ET member since: May 2020
                                                                                   ET member since: June 2020
                          Years in company: 7                                                                                        Years in company: 20
                                                                                   Years in company: 41

                          Jacco van der Linden                                     Yolanda Talamo                                    Ronald den Elzen
                          President Asia Pacific                                   Chief People Officer                              Chief Digital & Technology Officer
                          ET member since: June 2020                               ET member since: January 2021                     ET member since: March 2020
                          Years in company: 21                                     Years in company: 4                               Years in company: 26

1.   Previous experience in HEINEKEN 2012-2015
                                                                                                                                                                    72
Ownership Structure

 Heineken N.V. shares held by Heineken Holding N.V. equals the number of shares issued by Heineken Holding N.V.

               FEMSA                         L’Arche Green N.V.                           Public
                                                   52.599%

                        12.262%           HEINEKEN Holding N.V.                 35.139%

                                             Board of directors                           Public
                                                   50.005%

                        8.632%                 HEINEKEN N.V.                    41.363%

                                             Supervisory board

                                              Executive board
                                                                                                                  73
Sponsored Level 1 ADR Programmes

              Heineken N.V.                                        Heineken Holding N.V.

          Bloomberg ticker: HEINY                                   Bloomberg ticker: HKHHY
            ISIN: US4230123014                                        ISIN: US4230081014
              Cusip: 423012301                                          Cusip: 423008101
              Exchange: OTCQX                                           Exchange: OTCQX
       Ratio: 2 ADRs: 1 Ordinary Share                           Ratio: 2 ADRs: 1 Ordinary Share

                            Depositary bank: Deutsche Bank Shareholder Services
                            c/o American Stock Transfer & Trust Company
                            ADR broker helpline:
                            +1 866 249 2593
                            E-mail: db@amstock.com
                            ADR website: www.astfinancial.com
                            Depositary Bank’s local custodian: Deutsche Bank, Amsterdam
                                                                                                   74
Contact Us
E-mail: investors@heineken.com
Tel: +31-20-5239590

                         Federico Castillo             Janine Ackermann
                         Investor Relations Director   Investor Relations Manager

                       Robin Achten                    Mirjam Koersen
                       Investor Relations Analyst      Investor Relations Specialist

                                                                                       75
You can also read