Low Weight, Morbidity, and Mortality in Children With Cerebral Palsy: New Clinical Growth Charts
←
→
Page content transcription
If your browser does not render page correctly, please read the page content below
ARTICLES

Low Weight, Morbidity, and Mortality in Children With
Cerebral Palsy: New Clinical Growth Charts
AUTHORS: Jordan Brooks, MPH,a,b Steven Day, PhD,a                        WHAT’S KNOWN ON THIS SUBJECT: Weight-for-age percentiles of
Robert Shavelle, PhD,a and David Strauss, PhD,a                          children with cerebral palsy are lower than in the general
aLife Expectancy Project, San Francisco, California; and                 population. This is especially true in children with more severe
bDepartment of Biostatistics, University of California, Berkeley,        motor dysfunction. Poor growth, loosely defined, is associated
Berkeley, California
                                                                         with increased hospitalization and school absences.
KEY WORDS
growth charts, cerebral palsy, mortality, morbidity                      WHAT THIS STUDY ADDS: This article reports evidence-based
ABBREVIATIONS                                                            thresholds for low weight and provides estimates of associated
CDC—Centers for Disease Control and Prevention                           increases in mortality risk. These estimates are illustrated on
GMFCS—Gross Motor Function Classification System
CDER—Client Development Evaluation Report
                                                                         new clinical growth charts for children with cerebral palsy,
                                                                         stratified according to gender and Gross Motor Function
www.pediatrics.org/cgi/doi/10.1542/peds.2010-2801
                                                                         Classification System levels.
doi:10.1542/peds.2010-2801
Accepted for publication Apr 7, 2011
Address correspondence to Jordan Brooks, MPH, Life
Expectancy Project, 1439 17th Ave, San Francisco, CA 94122.
E-mail: brooks@lifeexpectancy.org
PEDIATRICS (ISSN Numbers: Print, 0031-4005; Online, 1098-4275).
                                                                    abstract
                                                                    OBJECTIVE: To determine the percentiles of weight for age in cerebral
Copyright © 2011 by the American Academy of Pediatrics
                                                                    palsy according to gender and Gross Motor Function Classification
FINANCIAL DISCLOSURE: The authors have indicated they have
no personal financial relationships relevant to this article to      System (GMFCS) level and to identify weights associated with negative
disclose.                                                           health outcomes.
COMPANION PAPER: A companion to this article can be found on        PATIENTS AND METHODS: This study consists of a total of 102 163
page e436 and online at www.pediatrics.org/cgi/doi/10.1542/
peds.2011-1472.                                                     measurements of weight from 25 545 children with cerebral palsy who
                                                                    were clients of the California Department of Developmental Services
                                                                    from 1988 through 2002. Percentiles were estimated using generalized
                                                                    additive models for location, scale, and shape. Numbers of comorbidi-
                                                                    ties were compared using t tests. The effect of low weight on mortality
                                                                    was estimated with proportional hazards regression.
                                                                    RESULTS: Weight-for-age percentiles in children with cerebral palsy
                                                                    varied with gender and GMFCS level. Comorbidities were more com-
                                                                    mon among those with weights below the 20th percentile in GMFCS
                                                                    levels I through IV and level V without feeding tubes (P ⬍ .01). For
                                                                    GMFCS levels I and II, weights below the 5th percentile were associated
                                                                    with a hazard ratio of 2.2 (95% confidence interval: 1.3–3.7). For chil-
                                                                    dren in GMFCS levels III through V, weights below the 20th percentile
                                                                    were associated with a mortality hazard ratio of 1.5 (95% confidence
                                                                    interval: 1.4 –1.7).
                                                                    CONCLUSIONS: Children with cerebral palsy who have very low
                                                                    weights have more major medical conditions and are at increased risk
                                                                    of death. The weight-for-age charts presented here may assist in the
                                                                    early detection of nutritional issues or other health risks in these
                                                                    children. Pediatrics 2011;128:e299–e307

PEDIATRICS Volume 128, Number 2, August 2011                                                                                           e299
                                   Downloaded from pediatrics.aappublications.org by guest on July 24, 2015
Growth charts are standard tools for tion charts are truly prescriptive or METHODS
monitoring pediatric growth, develop- in any sense more useful than the
Inclusion and Exclusion Criteria
ment, and overall health. They contain descriptive CDC reference curves is
estimated weight-for-age percentiles an open question.17 The study population included children
based on a reference population. If a with cerebral palsy who were clients
Whether such a select sample for
child’s weight falls well outside age of the California Department of Devel-
cerebral palsy growth curves would
norms, it may raise clinical concern. opmental Services between January
be helpful is far from clear. Cerebral
The standard charts in pediatric prac- 1988 and December 2002. Clients of the
palsy growth patterns are depen-
tices are those of the Centers for Dis- Department of Developmental Ser-
dent on the severity of disabilities,4
ease Control and Prevention (CDC) for vices are assessed annually with the
and children with more severe dis-
boys and girls in the US general popu- Client Development Evaluation Report
abilities are likely to have signifi-
lation.1 These charts may not be help- (CDER).18 This report contains over 200
cant comorbidities. Thus, defining a
ful for children with cerebral palsy, medical, functional, behavioral, and
“healthy” cerebral palsy population
whose growth patterns may be mark- cognitive items. For each client, a team
becomes a difficult and somewhat
edly different from those of the gen- headed by a pediatric neurologist
arbitrary task. Perhaps a more rea-
eral pediatric population.2–15 makes medical diagnoses, including
sonable approach to growth-chart
the assessment of cerebral palsy,
Krick et al2 produced the first cerebral construction is to begin with a clini-
whereas functional items (crawling,
palsy–specific growth charts based on cally appropriate reference popula-
walking, and feeding, etc) may be
the weight and stature of children with tion to the construct charts then
assessed by other professionals
severe quadriplegia. The North Ameri- analyze empirical data to determine
familiar with that aspect of the client’s
can Growth in Cerebral Palsy Research growth thresholds that are associ-
development.
Collaboration has produced curves for ated with good or bad health out-
several other growth parameters, in- comes in that population. This ap- Children who had a CDER with an Inter-
cluding weight, knee height, upper- proach was taken by Stevenson national Classification of Disease,
arm length, mid– upper arm muscle et al3 and Samson-Fang et al,5 who Ninth Revision19 code for any of several
area, triceps skinfold, and subscapu- showed that poor growth, measured degenerative conditions or condi-
lar skinfold.3 Recently, Day et al4 con- by a combination of weight and tions acquired after infancy were
structed a series of height, weight, and other parameters, was associated excluded from all analyses. The
BMI charts stratified by motor and with increased health care use inclusion-exclusion algorithm is
feeding skills. and decreased social-participation shown in Fig 1.
Some researchers and practitioners outcomes.
Gross Motor Classification
have raised concerns over the useful- The following were the goals of the
ness of growth charts as diagnostic or present study: Growth patterns in children with cere-
prognostic tools. One concern is that bral palsy vary with motor and feeding
1. Estimate reference weight-for-age
existing charts are descriptive refer- abilities.4 The classification system for
percentiles for children with cere- motor disability in children with cere-
ences rather than prescriptive stan- bral palsy at each Gross Motor
dards, showing how a particular group bral palsy used most commonly in clin-
Function Classification System ical and research settings is the 5-level
of children grew rather than how a (GMFCS) level.
particular child should grow. Recently, GMFCS20:
2. Test for associations between I. Walks without limitations
the World Health Organization at-
weight for age and morbidity and
tempted to address this concern by II. Walks with limitations
mortality and quantify those that
constructing growth charts based on III. Walks using a hand-held mobility
are significant.
a select sample of “healthy children device
living under conditions likely to favor 3. Construct cerebral palsy growth
charts that clearly illustrate poten- IV. Self-mobility with limitations, may
achievement of their full genetic
tially unhealthy low weights. use powered mobility
growth potential [and whose moth-
ers] engaged in fundamental health- 4. Design the charts to mimic the CDC V. Transported in a manual wheelchair
promoting practices, namely breast- charts so that they may easily be The specific criteria for each level are
feeding and not smoking.”16 Whether integrated into existing clinical age dependent and were developed
the resulting World Health Organiza- practice. with the intent that children would
e300 BROOKS et al
Downloaded from pediatrics.aappublications.org by guest on July 24, 2015ARTICLES
recorded weights that were well
Persons with CP, 1988–2002 Exclusion conditions: 8034
48 447 Chromosomal anomalies: 818 above or below biologically plausible
Degenerative conditions: 4295
Traumatic brain injury, limits. In addition, some assess-
motor vehicle accident, near drowning, or ments suggested extreme rates of
other acquired injury: 2034
No exclusion conditions
Autism: 532 weight change; for example, a 5-year-
Cancer: 355
40 413 old child gaining 50 pounds during a
Age 25 y
1-year period. Together, all such
10 950 doubtful observations made up less
Age 1–25 y
29 463 than 0.1% of our study sample and
Missing motor function or were excluded from additional
not classified by GMFCS
199 consideration.
Classified by GMFCS
29 264 Gender- and GMFCS-specific reference
Missing or implausible weight values
percentiles (growth curves) were esti-
18 mated for children with cerebral palsy
Weight percentile estimation who were aged 2 to 20 years (data on
29 246 children aged 1 to 25 years were used
Age < 2 or Age > 20 to improve the precision of weight per-
3701 centiles at ages 2 and 20). This age
Morbidity and mortality analysis range was selected to match the stan-
25 545
dard CDC charts. Percentiles were es-
FIGURE 1 timated with generalized additive mod-
Study population inclusion-exclusion algorithm. CP indicates cerebral palsy. els for location, scale, and shape
(GAMLSS), with a Box-Cox power expo-
nential distribution. This is a semipa-
maintain the same GMFCS level study. A relatively small number of rametric statistical-modeling tech-
throughout childhood and adoles- children (⬍1%) were not assigned to nique that allows estimation of
cence. Wood and Rosenbaum21 docu- any GMFCS level because they had age-specific percentiles and z scores.26
mented the reliability of GMFCS from missing functional assessments or be- Models were fit in accordance with
the age of 2 to 12 years to be 0.79. cause they had rare combinations of World Health Organization methodol-
For the present study, the age-specific abilities and disabilities. These chil- ogy using cubic smoothing splines.
GMFCS criteria were approximated dren were excluded from additional Model selection was based on penal-
with functional items from the CDER analysis. ized maximum likelihood.27
based on the classification algorithm
used in Krach et al.25 Functional-item Weight-for-Age Growth Curves Morbidity
data have been independently validat- Weight measures for the CDER were Separately for each GMFCS level, the
ed22–24 and have interrater reliability taken directly or, in some cases, re- mean number of chronic major medi-
exceeding 0.85.24 Because the pres- ported by a parent or other caregiver. cal conditions was calculated within
ence of a feeding tube may affect Discrepancies between weights re- weight-for-age quintiles. According to
growth, GMFCS level V was subdivided corded on the CDER and those in an the Department of Developmental Ser-
into children who fed orally without a individual’s actual medical records vices, chronic major medical condi-
feeding tube (GMFCS V-NT) and those were found in 9% of a random sample, tions are “major, chronic medical
who had a feeding tube (GMFCS V-TF). but these were small enough to be ig- problems that limit or impede the cli-
The vast majority of feeding tubes nored as immaterial.22 ent or significantly impact the provi-
(well over 90%) are gastrostomy For approximately one-third of the sion of service” and “include, but are
tubes. In the United States, nasogas- assessments, weight values were not limited to, diabetes mellitus, hyper-
tric feeding is rarely used for ex- carried over from a previous CDER. tension, congenital or arteriosclerotic
tended periods. Because such observations do not heart disease, upper respiratory infec-
Some children gained or lost abilities accurately represent age-specific tions, etc.”18 Differences in the mean
and were represented in 1 or more weights, we excluded them from ad- number of chronic major medical con-
GMFCS levels over the course of the ditional analysis. Few individuals had ditions, for people in the extreme
PEDIATRICS Volume 128, Number 2, August 2011 e301
Downloaded from pediatrics.aappublications.org by guest on July 24, 2015TABLE 1 Study Population
GMFCS Level
I II III IV V-NTa V-TFb
No. of assessments 14 030 31 808 13 994 24 744 11 919 5668
Male, % 61 57 55 57 54 54
Age, median (interquartile range), y 4.5 (1.7–6.8) 4.5 (2.7–6.4) 4.6 (3.2–6.5) 4.4 (2.6–6.4) 3.9 (2.2–6.3) 4.1 (2.4–6.4)
Has a feeding tube, % 1 2 5 9 0 100
Orally fed by others, % 1 2 11 33 85 0
Has severe (IQ 20–34) or profound 11 22 34 50 68 84
(IQ ⬍ 20) mental retardation, %
Low birth weight (⬍2500 g) or preterm 25 28 35 31 23 22
labor (⬍37 wk), %
Weight, median (interquartile range), kg 28 (16–50) 27 (19–44) 26 (18–39) 21 (15–32) 18 (13–26) 23 (16–31)
Observations are 102 163 CDERs from 25 545 subjects with cerebral palsy, who received services from the California Department of Developmental Services between 1988 and 2002. Some
children contributed observations to more than 1 group.
a Is fed orally.
b Dependent on a feeding tube.
weight quintiles versus those in the 3 RESULTS boys and girls were similar up to about
middle quintiles were assessed with t the age of 15 years. Girls plateaued
Descriptive Statistics
tests. earlier than boys, and between the
The study population included 25 545 ages of 15 and 20 years boys tended to
Mortality children (56% male, aged 2–20 years) weigh more than girls. Gender differ-
who contributed 102 163 weight mea- ences were smaller in the more se-
Electronic death records were ob-
surements (Table 1). Age, gender, pre- verely affected groups. For example, at
tained from the California Department
maturity or low birth weight, and cal- age 20 years the difference in median
of Health Services. Individuals surviv-
endar year of CDER did not vary weights for boys and girls in GMFCS
ing 3 or more years after their last
significantly by GMFCS level. The most level I was 7.3 kg; the difference was
weight measure were censored at 3
frequent level in our study population only 1.8 kg in the GMFCS V-TF group.
years. All individuals surviving to De-
was GMFCS level II (31%). This was fol- Figure 2A shows a scatter plot of weight-
cember 31, 2002, were administra-
lowed by levels IV (24%), V (17%), I for-age data in boys from GMFCS level I,
tively censored at that date. (14%), and III (14%). The proportion along with estimated weight-for-age per-
We used Cox proportional hazards re- with severe feeding and cognitive dis- centiles and the CDC percentiles for boys
gression analysis with time-varying co- abilities increased with increasing in the general population. The 90th per-
variates28 to relate survival time to GMFCS level. For example, 2% of chil- centile in GMFCS level I closely tracked
weight percentiles. This enabled us to dren in GMFCS level I were either tube that of the general population. The me-
control for other variables, such as fed or orally fed by others compared dian was lower, and the difference in me-
feeding skills, that might confound or with 42% of children in GMFCS level IV dians increased with age. The 10th per-
modify the effect of low weight on mor- and 90% in GFMCS level V. Eleven percent centile was markedly lower at all ages.
tality. Separate models were fit for of children in GMFCS level I had severe or Children in GMFCS level V exhibited more
GMFCS levels I and II and GMFCS levels profound mental retardation compared linear growth patterns (ie, no growth
III through V because children in these with 50% of children in GMFCS level IV spurt), with a plateau in late adoles-
groups tend to be different with re- and 73% in GFMCS level V. cence (Fig 2B).
spect to functional skills beyond gross
motor function, feeding and cognition, Weight-for-Age Morbidity
age-specific weight values, age- In all but the most severe group The mean number of chronic major
specific mortality patterns, and secu- (GMFCS level V), weight-for-age data medical conditions increased mod-
lar trends. Low-weight cutoffs were se- exhibited nonlinear dependence on estly with GMFCS level. The most strik-
lected on the basis of maximum age, with a visible growth spurt be- ing marker for chronic medical condi-
likelihood. Data were managed in SAS tween ages 9 and 13 years and plateau tions was the presence of a feeding
version 9.12,29 and analyzed by using R in late adolescence. For each GMFCS tube. For example, children in GMFCS
version 2.9.30 level, weight-for-age percentiles for V-TF had, on average, twice as many
e302 BROOKS et al
Downloaded from pediatrics.aappublications.org by guest on July 24, 2015ARTICLES
time. There were 1496 deaths, for an
overall mortality rate of 9 deaths per
1000 person-years. For GMFCS levels III
through V, children with weight for age
below the 20th percentile had signifi-
cantly higher mortality rates com-
pared with children with weight for
age in the 20th to 80th percentile range
(P ⬍ .01) (Fig 4). The excess death rate
in this lowest quintile increased steadily
with GMFCS level (0.3 per 1000 person-
years [GMFCS level I] up to 26 per 1000
person-years [GMFCS V-TF]). Weight
above the 80th percentile was not asso-
ciated with differential mortality.
Because mortality rates in children
FIGURE 2 with cerebral palsy vary strongly with
Weight-for-age data and fitted percentiles. the severity of disabilities, for model-
ing purposes the data were divided
into 2 groups: mild to moderate
major medical conditions as those in conditions than the middle 60% (P ⬍
(GMFCS levels I and II) and severe
GMFCS V-NT (Fig 3). Among children in .0001). The mean number of major med-
(GFMCS levels III through V). Within
the GMFCS levels I through IV and the ical conditions for children with weights
each group, we fit unadjusted Cox pro-
level V-NT groups, those with weights above the 80th percentile was not signif-
portional hazard regression models and
below the 20th percentile had more icantly different from that of children
also more complex models with baseline
major medical conditions than chil- with weights in the middle 60%.
hazard functions stratified by GMFCS
dren whose weights fell in the middle
Mortality level and adjusted for time-varying cova-
60% (P ⬍ .01). In contrast, children in
riates, including age, gender, mobility,
GMFCS V-TF who had weights below the Study participants contributed a total
feeding, mental retardation, low birth
20th percentile had fewer major medical of 166 327 person-years of follow-up
weight or prematurity, and calendar
year. Unadjusted and adjusted hazard
ratios from the models are given in Ta-
bles 2 and 3. For GMFCS levels I and II,
weight below the 5th percentile was
associated with an adjusted hazard ra-
tio of 2.2 (95% confidence interval: 1.3–
3.7). For GMFCS levels III through V,
weight below the 20th percentile was
associated with increased mortality
(adjusted hazard ratio: 1.5 [95% confi-
dence interval: 1.4 –1.7]). The relative
mortality risk associated with low
weight did not vary with gender, age,
or calendar year. Sensitivity analyses
confirmed that the pattern of missing
age-specific weights were noninforma-
tive with respect to survival and there-
fore did not influence these results.
FIGURE 3
Mean number of chronic major medical conditions according to weight quintile. a Significant differ- These mortality risk research findings
ence from the middle 3 quintiles (P ⬍ .01). are illustrated on newly developed
PEDIATRICS Volume 128, Number 2, August 2011 e303
Downloaded from pediatrics.aappublications.org by guest on July 24, 2015medical conditions for children in the
GMFCS V-TF group is unclear. It may be
that some very-low-weight children
have feeding tubes placed strictly to
address weight issues even in the
absence of comorbidities, whereas
heavier children have feeding tubes to
reduce risks from aspiration pneumo-
nias or to address other medical is-
sues. Additional research is necessary
to fully understand this.
The concept of failure to thrive is used
frequently in general pediatric prac-
tice without much evidence regarding
its associations with health out-
comes.31 It is interesting to note that
FIGURE 4 our evidence-based GMFCS levels I and
Crude mortality rates according to weight quintile. a Significant difference from the middle 3 quintiles II low-weight threshold (ie, the 5th per-
(P ⬍ .05). centile) is broadly consistent with an-
TABLE 2 Cox Regression Results for Children in GMFCS Levels I and II thropometric failure-to-thrive crite-
Hazard Ratio for Death and
ria.32 This threshold also is consistent
95% Confidence Interval with studies of the general population
Unadjusted Adjusteda that have found the 10th percentile of
Weight below the 5th percentileb 3.2 (1.9–5.3) 2.2 (1.3–3.7) adult BMI to be associated with mod-
Based on 45 838 evaluations of 13 118 individuals in GMFCS levels I or II. The cohort experienced 125 deaths over 76 733 estly increased mortality.33,34 That the
person-years of follow-up.
a Adjusted for gender, age, stair climbing ability, mental retardation, feeding, and low birth weight or prematurity.
low-weight percentile threshold for
b GMFCS- and age-specific 5th percentile. GMFCS levels I and II is lower than that
for GMFCS levels III through V (5th ver-
sus 20th percentile) reflects the fact
TABLE 3 Cox Regression Results for Children in GMFCS Levels III Through V
that children in GMFCS levels I and II
Hazard Ratio for Death and
95% Confidence Interval
weigh more than those in GMFCS levels
III through V.
Unadjusted Adjusteda
Weight below the 20th percentileb 1.6 (1.4–3.8) 1.5 (1.4–1.7) It may seem counterintuitive that
Both models account for functional skills that vary over time (ie, time-varying covariates). The baseline hazard functions high weights were not associated
were stratified by GMFCS level. Based on 56 325 evaluations of 14 688 individuals in GMFCS levels III through V. The cohort with increased mortality or morbid-
experienced 1371 deaths over 89 594 person-years of follow-up.
a Adjusted for gender, age, head-lifting ability, feeding, mental retardation, low birth weight or prematurity, and calendar ity, particularly because obese chil-
year. dren may be subject to additional
b GMFCS- and age-specific 20th percentile.
comorbidities and may require mod-
ified care regimes. The most likely
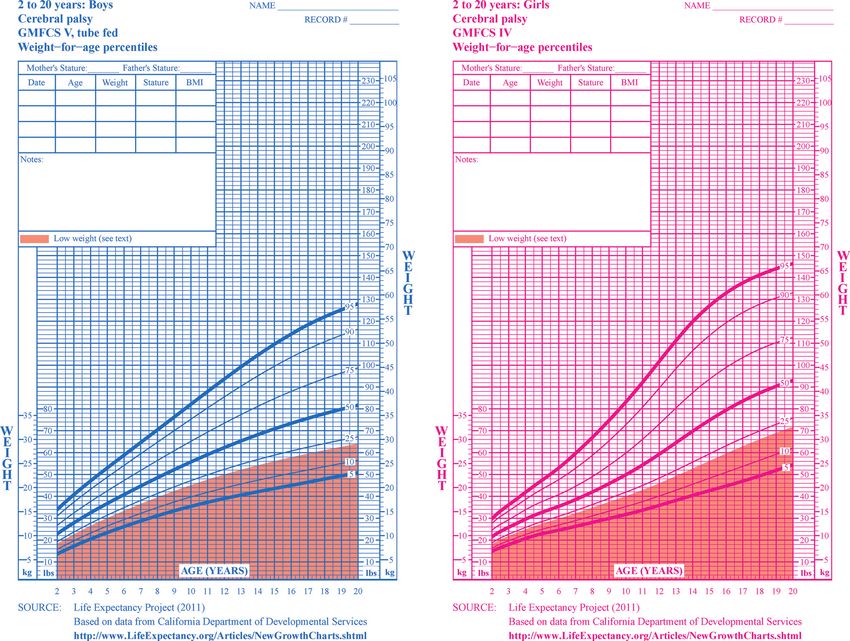
growth charts with shaded weight-for- available at www.lifeexpectancy.org/ explanation may be that the effects
age values where mortality risk is articles/newgrowthcharts.shtml. of overweight or obesity do not no-
significantly increased. Fig 5 shows ticeably increase mortality risk until
weight-for-age charts for girls in DISCUSSION adulthood. The impact of childhood
GMFCS level IV and boys in GMFCS level Among children in GMFCS levels I obesity on adult outcomes in people
V who are tube fed. The new charts are through IV, and level V who are not with developmental disabilities re-
styled after the standard CDC charts tube fed, low weight was, as expected, mains an open question.
and include designated areas to re- associated with an increase in the The proper clinical interpretation of
cord patient name, dates, parental number of concurrent chronic major the risks discussed here deserves ad-
height and weight, and general notes. medical conditions. Why very low ditional comment. A practicing clini-
The full set of growth charts is weight is associated with fewer major cian may ask, “Do these risks apply to
e304 BROOKS et al
Downloaded from pediatrics.aappublications.org by guest on July 24, 2015ARTICLES
FIGURE 5
Clinical growth charts for children with cerebral palsy.
my patient? And, if so, for how long?” The primary limitation of the study is ment of Developmental Services be-
The evidence presented here is the lack of information regarding the cause of a perceived lack of need.
generally applicable to all children etiology of low weight. Low weight is a Thus, our GMFCS level I findings may be
with cerebral palsy, but additional known marker for nutritional deficits valid only for children with ongoing
patient-specific features should al- and general frailty, which is a reason- needs for services.
ways be considered. One potentially able mechanism for increased mor-
The study has a number of strengths. The
benign reason for low weight may bidity and mortality. On the other hand,
simply be small parental stature. In children may lose weight or have trou- findings represent the first evidence-
cases where benign etiology has ble gaining it as a result of chronic or based link between low weight and mor-
been ruled out, the excess risks as- acute illness. A secondary limitation is tality risk in children with cerebral palsy.
sociated with low weight should be the apparent underrepresentation of The large sample size allowed percentile
interpreted as persistent for as long GMFCS level I (14%) in our study popu- estimates that are robust to modeling
as the child remains in the low- lation. In other population-based cere- assumptions. For example, the charts
weight category. On the other hand, bral palsy registries, the proportion of presented here have estimated weight-
for the reasons stated above clini- those in level I ranged from 30% to for-age percentiles that are consistent
cians should not take the findings of 40%.35–37 It may be that the most mildly with those in Day et al.4 The GAMLSS
this study to infer that overweight is affected individuals in California dis- growth chart methodology used here is
not a significant health risk in chil- proportionately choose not to seek consistent with that of both the CDC
dren with cerebral palsy. long-term services from the Depart- and World Health Organization. It al-
PEDIATRICS Volume 128, Number 2, August 2011 e305
Downloaded from pediatrics.aappublications.org by guest on July 24, 2015lows for the calculation of both per- dence to rely on, clinicians may be which to monitor a particular child’s
centiles and z scores, which have be- forced to make important treat- growth. To facilitate integration into
come popular in both the research ment decisions on the basis of subjec- current clinical practice, our growth
and clinical communities. Finally, the tive impressions. The extent to which charts are styled in accordance with
use of a simple and reliable mea- today’s clinicians can practice those of the CDC and include desig-
sure, weight, may have practical ben- evidence-based medicine depends nated areas to record patient char-
efits over using a more detailed but largely on the availability of tools acteristics and clinical notes. Ulti-
possibly unreliable combination of designed with these principles in mately, the utility of the charts will
measures, for example stature or mind. become more apparent as they are
skinfold thickness, in children with The new cerebral palsy growth used in clinical practice.
cerebral palsy. charts presented here are the first to
give a visual indication of potentially ACKNOWLEDGMENTS
CONCLUSIONS unhealthy weights. GMFCS is rela- Provision of data from the California
Evidence-based decision-making is tively stable throughout childhood Departments of Developmental Dis-
crucial in clinical and care-planning and adolescence and thus provides a abilities and Health Services is grate-
settings. Without sound empirical evi- useful stratification scheme from fully acknowledged.
REFERENCES
1. Kuczmarski RJ, Ogden CL, Grummer-Strawn Feeding dysfunction is associated with poor growth charts. J Pediatr. 2008;153(5):
LM, et al. CDC growth charts: United States. growth and health status in children with 592–594
Adv Data. 2000;314(314):1–27 cerebral palsy. J Am Diet Assoc. 2002; 18. California Department of Developmental
2. Krick J, Murphy-Miller P, Zeger S, Wright E. 102(3):361–373 Services. Client Development Evaluation
Pattern of growth in children with cerebral 11. Shapiro BK, Green P, Krick J, Allen D, Capute Report (CDER). Sacramento, CA: Califor-
palsy. J Am Diet Assoc. 1996;96(7):680 – 685 AJ. Growth of severely impaired children: nia Department of Developmental
3. Stevenson RD, Conaway M, Chumlea WC, et neurological versus nutritional factors. Dev Services; 1986
al. Growth and health in children with Med Child Neurol. 1986;28(6):729 –733 19. World Health Organization. International
moderate-to-severe cerebral palsy. Pediat- 12. Stallings VA, Charney EB, Davies JC, Cronk Statistical Classification of Diseases, Inju-
rics. 2006;118(3):1010 –1018 CE. Nutritional status and growth of chil- ries and Causes of Death, Ninth Revision.
4. Day SM, Strauss DJ, Vachon PJ, Rosenbloom dren with diplegic or hemiplegic cerebral Geneva, Switzerland: World Health
L, Shavelle RM, Wu YW. Growth patterns in a palsy. Dev Med Child Neurol. 1993;35(11): Organization; 1977
population of children and adolescents 997–1006 20. Palisano R, Rosenbaum P, Walter S, Rus-
with cerebral palsy. Dev Med Child Neurol. 13. Stallings VA, Charney EB, Davies JC, Cronk sell D, Wood E, Galuppi B. Development
2007;49(3):167–171 CE. Nutrition-related growth failure of and reliability of a system to classify
children with quadriplegic cerebral gross motor function in children with ce-
5. Samson-Fang L, Fung E, Stallings VA, et al.
palsy. Dev Med Child Neurol. 1993;35(2): rebral palsy. Dev Med Child Neurol. 1997;
Relationship of nutritional status to health
126 –138 39(4):214 –223
and societal participation in children with
cerebral palsy. J Pediatr. 2002;141(5): 14. Zainah SH, Ong LC, Sofiah A, Poh BK, Hussain 21. Wood EP, Rosenbaum PL. The Gross Motor
637– 643 IH. Determinants of linear growth in Malay- Function Classification System for cerebral
sian children with cerebral palsy. J Paedi- palsy. Dev Med Child Neurol. 2000;42(5):
6. Tobis JS, Saturen P, Larios G, Posniak AO.
atr Child Health. 2001;37(4):376 –381 292–296
Study of growth patterns in cerebral palsy.
Arch Phys Med Rehabil. 1961;42:475– 481 15. Shim ML, Moshang T Jr, Oppenheim WL, 22. Citygate Associates, LLC. Independent Eval-
Cohen P. Is treatment with growth hor- uation of the Department of Developmental
7. Krick J, Van Duyn MA. The relationship be-
mone effective in children with cerebral Services’ Community Placement Practices:
tween oral-motor involvement and growth:
palsy? Dev Med Child Neurol. 2004;46: Final Technical Report. Sacramento, CA:
a pilot study in a pediatric population with 569 –571 Citygate Associates, LLC; 1998
cerebral palsy. J Am Diet Assoc. 1984;84(5):
16. de Onis M, Onyango A, Borghi E, et al, eds. 23. Arias M, Ito E, Takagi N. Concurrent valid-
555–559
WHO Child Growth Standards: Length/ ity of the client development and evalua-
8. Stevenson RD, Roberts CD, Vogtle L. The ef- Height-for-Age, Weight-for-Age, Weight-for- tion report. In: Silverstein AB, ed. Pacific
fects of non-nutritional factors on growth in Length, Weight-for-Height and Body Mass State Archives VIII. Pomona, CA: University
cerebral palsy. Dev Med Child Neurol. 1995; Index-for-Age: Methods and Development. of California at Los Angeles, Developmen-
37(2):124 –130 Geneva, Switzerland: World Health Organi- tal Disabilities Immersion Program; 1983:
9. Motion S, Northstone K, Emond A, Stucke S, zation Press; 2006 28 –33
Golding J. Early feeding problems in chil- 17. Mei Z, Ogden CL, Flegal KM, Grummer- 24. Harris CW, Eyman RK, Mayeda T. An Interra-
dren with cerebral palsy: weight and neuro- Strawn L. Comparison of the prevalence of ter Reliability Study of the Client Develop-
developmental outcomes. Dev Med Child shortness, underweight, and overweight ment Evaluation Report: Final Report to the
Neurol. 2002;44(1):40 – 43 among US children aged 0 to 59 months by California Department of Developmental
10. Fung EB, Samson-Fang L, Stallings VA, et al. using the CDC 2000 and the WHO 2006 Services. UCLA Mental Retardation Re-
e306 BROOKS et al
Downloaded from pediatrics.aappublications.org by guest on July 24, 2015ARTICLES
search Center. Pomona, CA: Lanterman London, United Kingdom: Chapman and Hall; in a prospective cohort of U.S. adults. N Engl
State Hospital; 1983 1984 J Med. 1999;341(15):1097–1105
25. Krach LE, Kriel RL, Day SM, Strauss DJ. 29. SAS/STAT Software [computer program]. 34. Fontaine KR, Redden DT, Wang C, Westfall AO,
Survival of individuals with cerebral palsy Release 9.1. Cary, NC: SAS Institute; 2001 Allison DB. Years of life lost due to obesity.
receiving continuous intrathecal 30. R Development Core Team. R: A Language JAMA. 2003;289(2):187–193
baclofen treatment: a matched-cohort and Environment for Statistical Computing. 35. Nordmark E, Hagglund G, Lagergren J. Cere-
study. Dev Med Child Neurol. 2010;52(7): Vienna, Austria: R Foundation for Statistical bral palsy in southern Sweden II: gross mo-
672– 676 Computing; 2008 tor function and disabilities. Acta Paediatr.
26. Stasinopoulos DM, Rigby RA. Generalized 31. Wilcox WD, Nieburg P, Miller DS. Failure to 2001;90(11):1277–1282
additive models for location scale and thrive: a continuing problem of definition. 36. Howard J, Soo B, Graham HK, et al. Cerebral
shape (GAMLSS) in R. Stat Softw 2007; 23(7): Clin Pediatr (Phila). 1989;28(9):391–394 palsy in Victoria: motor types, topography
1– 46 32. Olsen EM, Petersen J, Skovgaard AM, et al. and gross motor function. J Paediatr Child
27. Borghi E, de Onis M, Garza C, et al. Construc- Failure to thrive: the prevalence and con- Health. 2005;41(9 –10):479 – 483
tion of the World Health Organization child currence of anthropometric criteria in a 37. Gorter JW, Rosenbaum PL, Hanna SE, et al.
growth standards: selection of methods for general infant population. Arch Dis Child. Limb distribution, motor impairment, and
attained growth curves. Stat Med. 2006; 2007;92(2):109 –114 functional classification of cerebral
25(2):247–265 33. Calle EE, Thun MJ, Petrelli JM, Rodriguez C, palsy. Dev Med Child Neurol. 2004;46(7):
28. Cox DR, Oakes D. Analysis of Survival Data. Heath CW Jr. Body-mass index and mortality 461– 467
PEDIATRICS Volume 128, Number 2, August 2011 e307
Downloaded from pediatrics.aappublications.org by guest on July 24, 2015Low Weight, Morbidity, and Mortality in Children With Cerebral Palsy: New
Clinical Growth Charts
Jordan Brooks, Steven Day, Robert Shavelle and David Strauss
Pediatrics 2011;128;e299; originally published online July 18, 2011;
DOI: 10.1542/peds.2010-2801
Updated Information & including high resolution figures, can be found at:
Services http://pediatrics.aappublications.org/content/128/2/e299.full.h
tml
References This article cites 28 articles, 3 of which can be accessed free
at:
http://pediatrics.aappublications.org/content/128/2/e299.full.h
tml#ref-list-1
Citations This article has been cited by 4 HighWire-hosted articles:
http://pediatrics.aappublications.org/content/128/2/e299.full.h
tml#related-urls
Subspecialty Collections This article, along with others on similar topics, appears in
the following collection(s):
Neurology
http://pediatrics.aappublications.org/cgi/collection/neurology
_sub
Neurologic Disorders
http://pediatrics.aappublications.org/cgi/collection/neurologic
_disorders_sub
Permissions & Licensing Information about reproducing this article in parts (figures,
tables) or in its entirety can be found online at:
http://pediatrics.aappublications.org/site/misc/Permissions.xht
ml
Reprints Information about ordering reprints can be found online:
http://pediatrics.aappublications.org/site/misc/reprints.xhtml
PEDIATRICS is the official journal of the American Academy of Pediatrics. A monthly
publication, it has been published continuously since 1948. PEDIATRICS is owned, published,
and trademarked by the American Academy of Pediatrics, 141 Northwest Point Boulevard, Elk
Grove Village, Illinois, 60007. Copyright © 2011 by the American Academy of Pediatrics. All
rights reserved. Print ISSN: 0031-4005. Online ISSN: 1098-4275.
Downloaded from pediatrics.aappublications.org by guest on July 24, 2015Low Weight, Morbidity, and Mortality in Children With Cerebral Palsy: New
Clinical Growth Charts
Jordan Brooks, Steven Day, Robert Shavelle and David Strauss
Pediatrics 2011;128;e299; originally published online July 18, 2011;
DOI: 10.1542/peds.2010-2801
The online version of this article, along with updated information and services, is
located on the World Wide Web at:
http://pediatrics.aappublications.org/content/128/2/e299.full.html
PEDIATRICS is the official journal of the American Academy of Pediatrics. A monthly
publication, it has been published continuously since 1948. PEDIATRICS is owned,
published, and trademarked by the American Academy of Pediatrics, 141 Northwest Point
Boulevard, Elk Grove Village, Illinois, 60007. Copyright © 2011 by the American Academy
of Pediatrics. All rights reserved. Print ISSN: 0031-4005. Online ISSN: 1098-4275.
Downloaded from pediatrics.aappublications.org by guest on July 24, 2015You can also read