Reducing Avoidable Injuries in Children and Young People: A Strategy for Nottingham and Nottinghamshire 2014-2020 - Nottinghamshire County ...
←
→
Page content transcription
If your browser does not render page correctly, please read the page content below
Reducing Avoidable Injuries in
Children and Young People: A
Strategy for Nottingham and
Nottinghamshire
2014-2020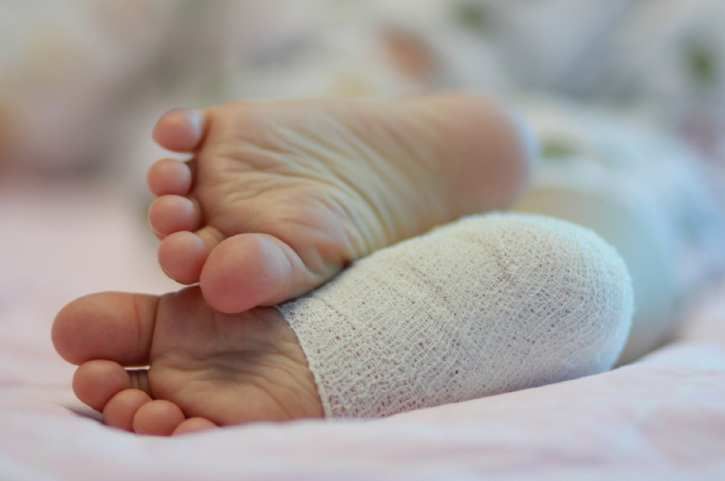
Contents
PLEDGES ......................................................................................................................................... 3
1. Executive Summary............................................................................................................. 4
2. Introduction .......................................................................................................................... 7
2.1. Scope & Definition ............................................................................................................. 7
2.2. The Guiding Principles for the Strategy ............................................................................ 8
2.3. The Aim ............................................................................................................................. 8
2.4. The Objectives .................................................................................................................. 8
2.5. Outcome measures ........................................................................................................... 8
3. Background and Context ..................................................................................................... 9
3.1. What is the issue? ............................................................................................................. 9
3.2. Categories of Injury ......................................................................................................... 10
3.3. Who is at increased risk of experiencing an Avoidable Injury? ....................................... 10
3.4. The cost of Avoidable Injury ............................................................................................ 10
3.5. The Human Cost of Avoidable Injury: Aimee’s Story ...................................................... 11
4. Policy Context: What are the Drivers ................................................................................ 12
4.1. Local Policy ..................................................................................................................... 12
5. The Local Picture ............................................................................................................... 12
5.1. Data Sources ................................................................................................................... 12
5.2. Fatally Injured .................................................................................................................. 13
5.3. Injuries resulting in Hospitalisation (Hospital Admissions or inpatients) ......................... 13
5.4. Hospital admissions by age............................................................................................. 13
5.5. Causes of Injury .............................................................................................................. 14
5.6. Injuries Resulting in Emergency Department (ED) Attendances/Treatment................... 16
5.7. Road Traffic Collisions .................................................................................................... 16
5.8. Seasonal variation ........................................................................................................... 17
5.9. Areas of Greatest Interest: Deprivation, Disadvantage and Geography......................... 17
6. Evidence Base: What works? ............................................................................................ 17
6.1. The 5 E’s of action ........................................................................................................... 17
7. Meeting local needs ........................................................................................................... 18
8. Informing the strategy to date ............................................................................................ 18
8.1. Stakeholder day .............................................................................................................. 18
8.2. Mapping Exercise ............................................................................................................ 18
8.3. Consultation and engagement ........................................................................................ 18
9. Monitoring of the strategy and reporting structure ............................................................ 19
9.1. Reporting Structure ......................................................................................................... 19
10. Evaluation .......................................................................................................................... 19
11. Action Plan ........................................................................................................................ 19
12. References ........................................................................................................................ 24
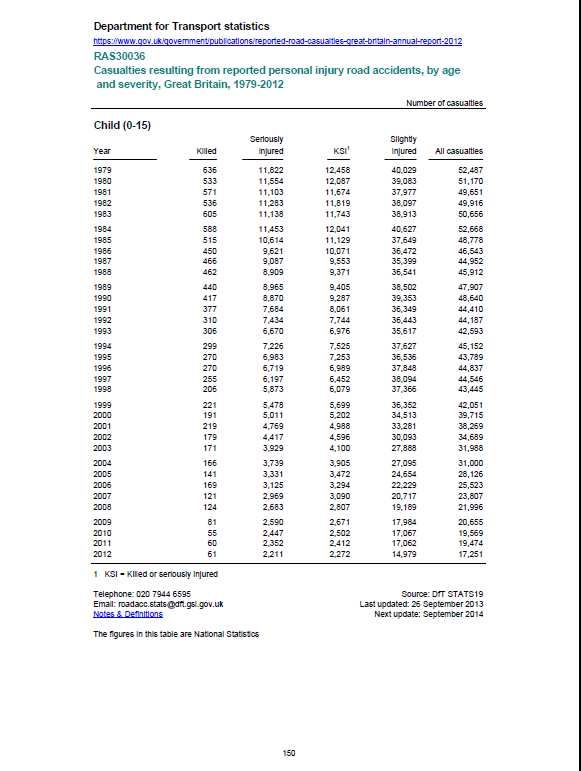
Appendix 1: Department for Transport Statistics-Road Casualties ............................................. 26
Appendix 2: Road Safety Data 2012 ........................................................................................... 27
2
The term ‘injury' is preferred to ‘accident’ as ‘most
 injuries and their preceding events are predictable and
                                  preventable.'
     The term ‘accident' implies an unpredictable and
                     therefore unavoidable event [1]

PLEDGES
 We collectively pledge to work in partnership:
  • To achieve the aims and objectives of the strategy
  • To share and make best use of local resources
  • To influence the agenda and ensure avoidable injuries are afforded the attention they
      require locally.

 The organisations making this pledge;
 Nottingham City Council, Nottinghamshire County Council, The University of Nottingham,
 Royal Society for the Prevention of Accidents (ROSPA), Childhood Accident Prevention
 Trust (CAPT), East Midlands Ambulance Service, Notts Fire and Rescue, Home Start,
 NHS Nottinghamshire County Clinical Commissioning Groups, Nottingham City Clinical
 Commissioning Group, Nottinghamshire Police, Nottingham University Hospitals,
 Nottingham Safeguarding board, Sure Start Children’s Centres, Notts City Care and
 Nottinghamshire Healthcare Trust.

 As well as partner agencies it is also of paramount importance that we acknowledge the
 dedication and support that will be required from groups of key professionals, these will
 include;

 Safety in the home
    • Health Visitors
    • Family Nurse Practitioners
    • Social Workers
    • Children’s Centres staff
    • Social Housing managers
    • Fire and rescue staff
 On the roads & leisure time
    • School staff
    • Police
    • Road safety team
    • Fire & Rescue
    • Anti-social behaviour officers & Community safety teams

                                               3
1.   EXECUTIVE SUMMARY

     Avoidable injuries in children and young people (CYP) are a serious public health issue and
     a leading cause of death and hospital admission for children in the United Kingdom. Injuries
     put more children in hospital than any other cause.

     The impact and consequences of avoidable injuries are major contributors to health
     inequalities with children from the most disadvantaged backgrounds at significantly
     increased risk.

     The long term effect of an injury can be significant, both physically and emotionally, for
     children. They may experience:
         • Disability or impairment (short or long term)
         • Scarring or disfigurement
         • Ongoing appointments and operations.

     Overall rates of death from injury in children have fallen in England and Wales over the past
     20 years. However, rates for children living in disadvantaged social and economic
     circumstances have not seen the same improvementi .

     Children from the most disadvantaged backgrounds are at significantly increased risk of
     injury. Compared to their peers, children from the poorest homes are (CAPT):
         • 13 times more likely to die in an accident
         • 21 times more likely to die as a pedestrian on the roads
         • 38 times more likely to die in a house fire

     Avoidable childhood injuries carry significant costs to the economy, the NHS and children
     and families. Admitting a child to hospital following avoidable injury in the home is estimated
     to cost £16,900. The same source puts the cost of a road traffic injury at three times this, in
     excess of £50,000. The NHS spends an estimated £131 m per year on emergency hospital
     admissions because of childhood injuries.

     There is a body of evidence to show that most injuries are preventable. Strategies to
     prevent injuries are usually relatively inexpensive to implement and are shown to
     have a beneficial return on investment.

     How many injuries could be prevented? If all the districts and boroughs in
     Nottinghamshire reduced the rate of accidents to that of the best performing borough/district
     in Nottinghamshire there would be 26,082 fewer Accident and Emergency (A&E)
     attendances and 1,321 fewer inpatient admissions over a four year period.

     If all the wards in Nottingham City reduced the rate of accidents to that of the best
     performing Ward there would be 8,303 fewer Accident and Emergency (A&E)
     attendances and 709 fewer inpatient admissions over a four year period.

     How much would this save ? Savings for the NHS alone in Nottingham and
     Nottinghamshire would be approximately £6.63million (based on National average tariffs
     2011/12 for A&E Attendance and Non elective inpatients [21]) this is a fraction of savings
     that could be realised as it only looks at point of care immediately after an injury and, does
     not include follow- up appointments, social care costs or ongoing care requirements.

                                                    4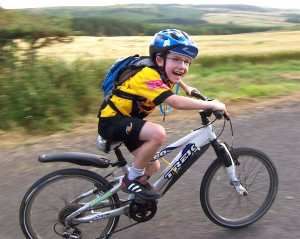
1.1.   MEASURING SUCCESS
       Outcomes will be delivered in the areas of home safety, road safety and leisure. All
       interventions developed and implemented to achieve the stated outcomes will be based on
       best practice, evidence and building on the good work already being achieved. The added
       value will be through the coordination of existing services and gaps identified being taken
       forward.

       The following national indicators will be used to measure success;

       Public Health Outcomes Framework (PHOF) Indicator ‘Hospital admissions caused by
       unintentional and deliberate injuries in children and young people aged 0-14 and 15-24
       years’

       National and local casualty reduction targets for road safety: A 50% reduction in the 2005-
       2009 average for child KSI by 2020.

1.2.   SNAP SHOT OF THE LOCAL PICTURE
       Fatalities: There were 8 fatalities due to avoidable injuries in Nottingham City and
       Nottinghamshire County over a 3-year period April 2010 - March 2013.

       Injuries Resulting in Hospitalisation (also known as admissions or inpatients): There was a
       total of 5,700 admissions to hospital as a result of avoidable injuries (April 2010 - March
       2013).
          • There were 44 admissions for burns and scalds and 88.5% of these where in the 0-
              5yr age group mostly 1-2 years.
          • There were 722 falls that resulted in admission to Nottingham and Nottinghamshire in
              2012/13, 45.5% of these occurred in the 0-5 age group.

       Injuries Resulting in Treatment/ Attendance at Emergency Departments (ED): There was a
       total of 102,354 ED attendances of which 4.2% (4,380) became inpatients during 2010 –
       2013.
          • 0-5 year olds have the highest incidence of injury in both the City and County as a
              rate per 100,000 population.
          • There were 3,322 ED attendances due to burns and scalds in Nottingham and
              Nottinghamshire in 2012/13, the equivalent of an average of 9.1 per day or 63.8 per
              week.

       The major causes of injury in 0-17 year olds are:
         • Falls followed by exposure to inanimate objects
         • Poisoning, burns and scalds for the under 5’s.
         • Road accidents for 6-17 year olds with a sharp increase from age 12.

       Road Traffic Injuries: (Hospital data only) Data is 0-17 years for both Nottingham and
       Nottinghamshire during 2010-2013;
        • Pedal cycles: A total of 361 of which, 275 were to county residents
        • Pedestrians: A total of 165 of which, 53 were to city residents
        • Car occupants: A total of 58, of which 48 were to county residents
        • Motorcycles: A total of 75, of which 8 were to city residents and 67 to County
             residents.
       Death and casualty rates from road traffic collisions (RTCs) in Nottinghamshire as a
       whole remain significantly higher than the England average.

       Deprivation and disadvantage: There is a clear association between injury and
       deprivation/disadvantage.
         • In Nottingham City, children in the most deprived quintile are 1.23 times more likely
             to be admitted as inpatients and 1.11 times more likely to attend A&E than those in
             the least deprived quintile (National Indices of Multiple Deprivation IMD Quintiles).
         • In Nottinghamshire County the gap is more pronounced with people in the most
             deprived quintile being 1.77 times more likely to be an inpatient and 1.74 times more
             likely to attend A&E than the least deprived quintile.

                                                     5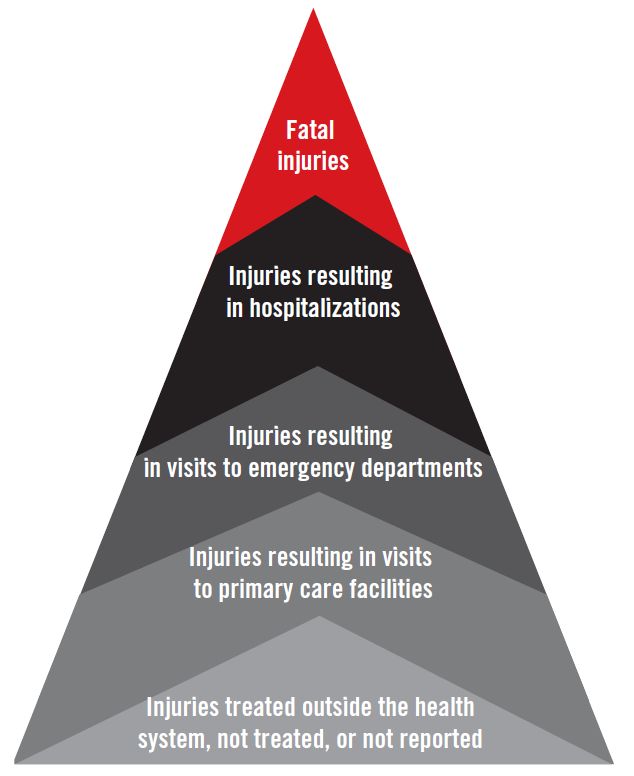
Geographies of increased interest: The rate of hospital admissions in Bassetlaw is very high
       in comparison with the other districts at 1,301 per 100,000 population. The 2nd highest is
       Newark & Sherwood at 981 per 100,000. [Data from 2010-2013]

       The districts with the highest incidence of ED attendance for avoidable injury are Newark &
       Sherwood followed by Bassetlaw.

       Nottingham City ward level data: the highest number of inpatient admissions for City was in
       Aspley Ward and it ranks 2nd by rate per 100,000 population.

1.3.   SUMMARY OF LOCAL ACTIONS: KEY DELIVERABLES
       To maintain a Strategic Group for Nottingham and Nottinghamshire to work collaboratively
       across agencies, districts, boroughs and wards to ensure a coordinated approach to
       avoidable injuries in CYP.

       To identify additional resources and funding to enable the implementation of interventions
       within the strategy and action plan.

       Actions for 0-17 years
         • To ensure education, enforcement and promotion of appropriate fitting and use of car
             seats, booster seats and seat belt fitting.

       Actions for 0-5 years
         • To establish consistent, equitable and sustainable home safety education and
             equipment schemes beginning in the areas of greatest need. This will require
             partnership working and identification of funding.
         • To ensure a consistent multiagency approach to risk assessment in the home, with
             development of improved referral pathways and communication channels.

       Actions for 5-17 years
         • Speed reduction schemes of maximum 20mph especially in urban areas and
             locations within proximity to schools.
         • Cycle training and education including helmet safety.

       A full action plan is available in Section 10.

                                                        6
2. INTRODUCTION
Injuries are the leading cause of death for children aged 1-4 and 15-19 and are the second
leading cause of death for children aged 5-14, second after all forms of tumours grouped
together in England and Wales [3].
There is a steep social gradient in childhood injuries with children from the most
disadvantaged backgrounds at significantly increased risk of injury.
Avoidable injuries in CYP have been identified as a local priority for Nottinghamshire County
and Nottingham City Public Health. This strategy describes how the agenda will be
addressed across key local partnerships for the period 2014-2020. The strategy should be
reviewed annually and revised in line with the latest evidence, evaluation and progress.
This strategy has been developed by Avoidable Injuries Strategic Partnership for Children &
Young People (Nottingham and Nottinghamshire) to:
• Raise the profile of avoidable injuries and highlight the possibilities for avoidable injury
reduction in 0-17 year olds in Nottingham and Nottinghamshire.
• Improve coordination of the work of individual agencies to optimise current resources
and establish a joint working approach to reducing the number of avoidable injuries.
• Increase stakeholder interest and involvement in reducing avoidable injuries in CYP.
2.1. SCOPE & DEFINITION
This strategy, the evidence, data and actions all relate to unintentional avoidable injuries,
which in layman’s terms are referred to as ‘accidents’. That is an incident which results in an
injury which was not deliberately caused and with the right risk assessment and intervention
could have been avoided. It does not refer in any part to injuries caused by the following
Self harm, abuse, assault or an intention to cause harm.
The Chief Medical Officer (CMO) & Public Health England (PHE) advocate an age range of
0-25 yrs for all interventions. This strategy’s evidence and data all relate to children and
young people aged 0-17yrs, the Strategic group took this decision based on the following;
The remit was preventing Avoidable Injuries in Children the Definition of this in the UK is a
person who has not yet reached their 18th Birthday [19, 20]. The World Health Organisation
(WHO) also advocate this and NICE strategies aimed at preventing avoidable injuries focus
on under 15’s.
The type and causes of injuries changes substantially in later teenage years and in the early
twenties as road traffic crashes predominate (drivers, passengers, motor cycle riders, also
intentional injuries (self-harm, assault and other violence) become much more common.
The prevention strategies, partnerships and services providing interventions to address
these injuries differ from those for unintentional injury in children and therefore require
separate strategies
The strategy is looking at prevention in 3 main areas;
In the home
• This predominantly covers the 0-5 age group and their parents to prevent falls, burns,
scalds, poisoning and drowning).
On the roads
• This predominantly covers the 6-17 age group and parent with information, education
and awareness about staying safe as a pedestrian, cyclist or passenger of a car (it will
cover 0-5yrs and parents in the passenger of a car theme)
During leisure time
• This predominantly covers all times when a child is not in school, nursery or in the
home (it is acknowledged that there is some overlap between this heading and the
other 2 headings) this heading does not relate specifically to leisure centres, sports
clubs or formal setting who should have their own risk assessment and mitigation in
place. It would include rail and water safety.
72.2. THE GUIDING PRINCIPLES FOR THE STRATEGY
The following are the guiding principles upon which all actions, developments and
interventions are based in order to have the greatest impact and ensure resources are
directed effectively:
• To take a proportionate universalism approach which means that education,
communication and engagement campaigns and avoidable injury prevention
programmes and interventions will be made universally available but increased effort
will be targeted at individuals, families and communities in the most disadvantaged
groups, as the evidence suggests.
• To provide road safety initiatives in schools that is age appropriate from the age of
5years and with an increased targeting of awareness raising and education at 10-17
year olds to include the use of social med [4].
• To focus intervention in the home for families with children in the 0-4 age range in the
key demographic target groups but not forgetting other groups.
• To enable parents, children and young people to make better risk assessment
judgements and be more aware of hazards and how to avoid injuries occurring.
• To ensure all prevention activity implemented is balanced with fun, physical activity
and learning.
• To direct attention to areas with the highest incidence/rates of injuries first.
• To ensure interventions are evidence-based, effective and value for money.
• To link with and support other local initiatives which support prevention activities
2.3. THE AIM
‘To reduce avoidable injuries in children and young people age 0-17 years, to minimise
inequalities and create safer environments for children’.
2.4. THE OBJECTIVES
• To demonstrate a sustainable reduction in the number and severity of avoidable
injuries in children and young people
• To reduce the social gradient in avoidable injuries and narrow the inequalities gap.
• To produce clear referral pathways and processes for partners to report risks
• To enable a coordinated approach to implementing preventative actions across
Nottingham and Nottinghamshire.
• To agree and determine a coordinated approach to surveillance, data collection,
sharing and reporting.
• To evaluate each agreed intervention.
2.5. OUTCOME MEASURES
Public health Outcomes Framework (PHOF) Indicator ‘Hospital admissions caused by
unintentional and deliberate injuries in children and young people aged 0-14 and 15-24
years’
National and local casualty reduction targets for road safety: A 50% reduction in the 2005-
2009 average for child KSI by 2020.
83. BACKGROUND AND CONTEXT
3.1. WHAT IS THE ISSUE?
Avoidable Injuries in CYP are a serious public health issue and a leading cause of death
and hospital admission for children in the United Kingdom aged between 1 and 14 years
[2].Most of these injuries happen in the home, outdoors or on the roads.
There are more deaths from avoidable injury than, for example, leukemia or meningitis and
the social class gradient in child injury is steeper than for any other cause of childhood
death or long-term disability [5].
Overall rates of death from injury in children have fallen in England and Wales over the past
20 years. However, rates for children living in disadvantaged social and economic
circumstances have not seen the same improvement [16].
The impact and consequences of avoidable injuries are a major contributor to health
inequalities with children from the most disadvantaged backgrounds at significantly
increased risk of injury. Compared to their peers, children from the poorest homes are:
• 13 times more likely to die in an accident
• 21 times more likely to die as a pedestrian on the roads
• 38 times more likely to die in a house fire (CAPT).
The long term effect of an injury can be significant both physically and mentally for children
(and their families), who may experience;
• Disability or impairment (short or long term).
• Scarring or disfigurement.
• Ongoing medical care.
• Ongoing emotional and psychological impact of sustaining and living with the
outcomes of an injury for both the child and wider family.
A study in 2014 [18] found that hot drinks and hair straighteners are leading cause of burns
and scalds in young children.
It also revealed that:
• Babies are 10 times more likely to be burned or scalded than older children.
• The most common injury is from babies and toddlers reaching up for a hot drink.
• Parents underestimate their child’s mobility and how far their baby or toddler can
reach.
Of the 1,215 children treated, over half had been scalded, three-quarters were under 5, with
most burns and scald injuries happening to one-year-olds.
93.2. CATEGORIES OF INJURY
Avoidable injuries can be categorised according to their severity, treatment type and
reporting. Figure 1: World Health Organisations (WHO) Injury Pyramid [6].
Fatalities from avoidable injuries
are only a small fraction of the total
number of children injured and the
pyramid highlights the burden of ill
health and utilisation of NHS and
non-NHS resources as well as an
indication of the number of injuries
not reported.
Exploration and experiencing risk
are a normal part of healthy child
development. However all sections
of the community have a
responsibility to ensure that
children are able to grow up in an
environment that does not expose
them to unreasonable hazards.
3.3. WHO IS AT INCREASED RISK OF EXPERIENCING AN AVOIDABLE INJURY?
NICE (2010) recognises that those who are at greater than average risk include; under 5’s
being more at risk of injuries in the home and over 11’s being more vulnerable to road
injuries. Other factors are as follows [7]:
• Children who have a disability or impairment (physical or learning).
• Children from some minority ethnic groups.
• Children from low income families.
• Children who live in accommodation which potentially puts them more at increased
risk (this includes multiple occupied housing; social and privately rented housing;
temporary accommodation and high rise).
Deprivation and social class gradient are also identified as significant risk factors for
avoidable injuries in the Marmot review [5].
3.4. THE COST OF AVOIDABLE INJURY
Admitting a child to hospital following avoidable injury in the home is estimated to cost
£16,900 [2]. The same source puts the cost of a road traffic injury at three times this, in
excess of £50,000 [2]. Avoidable injuries in children and young people follow a life course
approach so early interventions and preventative strategies that target individuals, families,
communities and society at large are important to stop this ripple effect.
The NHS spends an estimated £131 m per year on emergency hospital admissions
because of childhood Injuries. The approximate lifetime medical, educational and social
costs for one child with a severe traumatic brain injury is £4.89 million.
Most injuries are preventable and strategies to prevent injuries are usually relatively
inexpensive to implement and are shown to have a beneficial return on investment [7].
10Bath water scalds: Hot bath water is the leading cause of serious scalding injuries among
young children and the annual cost of treatment for 0-14 year-olds can be £39.2 million.
For a parent who is employed full-time, taking two weeks off work while their child is in
hospital costs the economy £7,600.
Hot drink scalds: Hot drink scalds are one of the most common childhood injuries and the
leading cause of children being admitted to burns services.
The average cost of inpatient treatment for an uncomplicated minor scald from a hot drink
is £1,850. Each year the NHS spends around £2.2 m on inpatient treatment for children and
young people with hot drink scalds CAPT (Childhood Accident Prevention Trust).
3.5. THE HUMAN COST OF AVOIDABLE INJURY: AIMEE’S STORY
Aimee (aged 2) was staying at a relative’s house. The relative was running a bath and
Aimee was in the bathroom with her. The relative turned around to take a towel off the rail
(within the same room) and as she turned Aimee jumped into the bath.
Aimee considers herself lucky in that while growing up she has been surrounded by an
amazing group of friends, and never experienced any issues or bullying. The following are
her own words:
“At secondary school I missed a lot of the summer breaks with friends and spent the
majority recovering from operations and going backwards and forwards to hospital
appointments.
In year 8/9 at school I had 2 tissue expands inserted into my stomach which I had to attend
hospital for twice a week. I had this done as I had a band of skin across the middle which as
I've grown in height got tighter and I was gradually unable to stand up perfectly straight.
After having the balloons in for 6 weeks and having people stare at me out with my family
thinking I was pregnant at a young age, they pulled the stretched skin up, grafted some skin
from my thigh. I had numerous operations to change the dressings on my stomach and
remove staples and had to spend 10 days bed rest lying flat unable to walk around or sit up.
In college I had an operation on my foot due to the skin on the tops of my feet becoming
tighter in age which had started to pull my toes up over time gradually fracturing the bones
in my foot. The operation included a graft on top of my foot taken from my legs wires in
my toes to fix the bones back in my foot. I had the wires in for 6 weeks and had to wear a
cast, then had another operation to remove the wires.
Other recent surgeries include grafts and skin releases to arms and shoulder; these are
because as I'm growing up skin gets tighter making it uncomfortable to do certain tasks. All
operations have been by choice to make things easier. I am still within the outreach clinic at
hospital”.
In terms of the effect on Aimee’s family she states; “I have always wondered how it has
affected my younger brother with my parents spending a lot of time with me in hospital and
running me to the hospital for appointments. Obviously missing out at work and having to
have time off for my appointments would have been tough on my parents.”
Aimee is now aged 21
www.cbf-uk.org for Aimee’s website and further information
Case study Courtesy of CAPT
Advice to avoid bath time scalds;
• run the bath before bringing the child into the bathroom
• never run the hot water tap first
• where possible get thermostatically controlled water heaters and mixer taps
• Ensure a responsible adult is present in the bath room at all times
114. POLICY CONTEXT: WHAT ARE THE DRIVERS
The Chief Medical Officer (CMO) Report: Prevention Pays; Our Children Deserve
Better October 2013 [9] highlights childhood accidents as a leading cause of death and
disability.
The Public Health Outcomes Framework (PHOF) contains an injury indicator for CYP [10].
The Marmot Report, “Fair society, Healthy Lives [5] highlights the impact of inequalities
when looking at accidental deaths among children.
• The single major avoidable cause of death in childhood in England is unintentional
injury – death in the home for under-5s and on the roads for 5-17year olds.
National Casualty Reduction Targets for Road Safety: A 50% reduction in the 2005-
2009 average for child KSI by 2020.
Public Health England: are currently producing guides for Local Government and CCG
regarding Avoidable Injuries these should be published in March 2014.
NHS England policies for the Midlands and South Yorkshire and Bassetlaw.
4.1. LOCAL POLICY
Nottinghamshire Early Help Strategy
Child Poverty Strategy
Children, Young people and families plan
Nottingham City CCG has a specific target to reduce all hospital admissions in children
and young people by 5% in three years.
Joint Strategic Needs Assessment (JSNA): Nottingham City and Nottinghamshire County
have JSNA chapters dedicated to reducing avoidable injuries in CYP.
5. THE LOCAL PICTURE
The data presented in this section provides a local context of the impact and effects of
avoidable injuries. The data presented follow the course of the Injury Pyramid (Fig 1)
starting at fatalities and moving down the tiers as far as attendances/treatment at ED.
The true figure of injuries and resulting morbidities in Nottingham and Nottinghamshire are
not reflected in this report as the figures exclude children who are treated at home, in
primary care and walk in centres as this data is currently unavailable.
5.1. DATA SOURCES
The statistics quoted in this document have been compiled from a variety of sources
including mortality statistics from ONS, road traffic accidents from STATS 19 data1, hospital
admissions data from Hospital Episode Statistics (HES)2 and A&E attendance statistics.
Hospital data are residence based and are an indication of the population in each area
admitted to or attending hospital as a result of being injured, regardless of the location of the
event or the hospital.
1
In Great Britain information on mortality and morbidity resulting from road traffic incidents, involving vehicles on public
highways, is collected by the police and collated by the Department for Transport
2
The Department of Health collects data on hospital admissions. Diagnosis and external cause are coded using the
International Classification of Disease coding, and ICD-10 codes have been in use since 1995.
125.2. FATALLY INJURED
There were eight deaths resulting from avoidable injuries in CYP living in Nottingham and
Nottinghamshire in the period 1st April 2010 to 31st March 2013. All deaths were in
children aged 12-17 years, with 4 being the result of road traffic incidents.
The incidence of death was slightly higher in boys than girls, which is in line with the
national picture.
5.3. INJURIES RESULTING IN HOSPITALISATION (HOSPITAL ADMISSIONS OR INPATIENTS)
There were a total of 5,700 admissions to hospital as a result of avoidable injuries between
April 2010 - March 2013.
There were 44 admissions for burns and scalds, 88.5% of which were in the 0-5yr age
group but mostly 1-2 yrs.
During financial year 2012/13 there were 722 falls in Nottingham City and Nottinghamshire
County that were severe enough to require admission to hospital as inpatients. 45.5% of
these occurred in the 0-5 age band.
The data in Table 1 shows that the rate of avoidable injury per 100,000 population for
Nottinghamshire County is significantly lower than the England average and significantly
lower than the average of 8 peer counties (of a similar socio-demographic make-up). This is
an average and some wards or districts are significantly worse than the Nottingham and
Nottinghamshire averages.
In Nottingham City the rate is comparable with the England average and significantly lower
than the average of 10 other similar cities.
Table 1: Comparative Emergency Hospital Admission Rates for Avoidable Injuries in
CYP Aged 0-17yrs in Financial Year 2011-12
Rate of admissions per 100,000 population
England 123
East Midlands 112
Nottinghamshire County 106
Nottingham City 122
Average of 8 comparable Counties 124 (range 80-156)
Average of 10 comparable Cities 151 (range 98-181)
Note all figures rounded
5.4. HOSPITAL ADMISSIONS BY AGE
A child’s age and stage of development has a bearing on the setting where injuries take
place, e.g. under-5’S are more likely to have avoidable injuries in the home environment.
School-age children are much more likely to have injuries in the road environment [6]. The
age group with the highest rate of injury is the under-fives in both city and county see figure
2.
Hospital admissions vary by age group with 0-5 year olds experiencing a higher proportion
of all admissions for avoidable injuries: See Table 2 and Figure 2.
Table 2: Rate of Avoidable Injury per 100,000 by Age Groups in City and County
Rate of injury per 100,000 population
Age group City County
0-5 1,371 1,089
6-17 1,235 1,493
13Figure 2: Rate of Injuries per 100,000 Population by Age Band (Data from April 2010 -
March 2013)
5.5. CAUSES OF INJURY
The most common cause of injuries in 0-17yr age groups in both City and County is falls
and the second most common cause is contact with non-living objects - such as furniture,
sports equipment sharp glass, pins, nails (list not exhaustive) officially termed ‘exposure to
inanimate mechanical forces’. The causes tend to split by age group after this with
poisonings, burns and scalds being more predominant in the 0-5 and transport accidents in
the 6-17 age group (See Table 3)
Table 3: Causes of Injuries by Age and Area in 2012/13.
Nottinghamshire Nottingham City
County
0-5 yrs 6-17yrs 0-5 yrs 6-17yrs
Falls 43% 46% 34% 38%
Contact with non-living objects - such as 22% 18% 29% 24%
furniture, sports equipment sharp glass, pins,
nails (list not exhaustive
Poisoning 15% 3% 13% 6%
Burns 4% 6%
Transport 4% 19% 4% 18%
Contact with a living object (official title ‘exposure 5% 8% 3% 6%
to animate mechanical forces’) includes being
accidentally hit or struck by a living object such
as a person, animal etc.
Figure 3 shows the percentage of injuries by cause for children and young people aged 0-
17yrs as rate per 100,000 for Nottinghamshire and Figure 4 shows the same data for
Nottingham City.
14Figure 3: Nottingham City: Hospital Admissions by Cause of Injuries City 0-17 years
(Rate per 100,000 population)
Other Accidental
3% exposure to
Burns unspecified
4% factors
6%
Exposure to
animate
Falls Poisoning mechanical
36% 10% forces
Transport 4%
accident
Exposure to 10%
inanimate
mechanical
forces
27%
Figure 4: Nottinghamshire County: Hospital Admissions by Cause of Injuries City 0-
17 years (Rate per 100,000 population)
Other Burns Accidental
3% 2% exposure to
unspecified
factors
4%
Exposure to
Poisoning animate
8% mechanical
Falls forces
44% Transport 7%
accident
12%
Exposure to
inanimate
mechanical
forces
20%
155.6. INJURIES RESULTING IN EMERGENCY DEPARTMENT (ED) ATTENDANCES/TREATMENT
There were a total of 102,354 ED attendances for injury of which 4.2% (4,380) became
inpatients during 2010 – 2013.
0-5 year olds have the highest incidence of injury in both the City and County as a rate per
100,000 population.
During financial year 2012/13; there were 3,322 ED attendances due to burns and scalds in
Nottingham City and Nottinghamshire County which is an average of 9.1 per day or 63.8 per
week.
Table 4: The Number of ED Attendances that became Inpatient Admissions for
Avoidable Injuries 0-17years as Whole Numbers and as a Percentage
% of ED
Other attendances
ED sources of that % of
ED inpatient inpatient became Total # of admissions
attendances admissions admission admissions admissions via A&E
City 27,117 1,384 305 5.10 1,689 81.94
County 75,237 2,996 1,015 3.98 4,011 74.69
Total 102,354 4,380 1,320 4.28 5,700 76.84
The overall rate of ED attendances in both City and County is not significantly different from
the national average. However, ED attendances for 0-4’s in the City are significantly worse
than the England average with 588.2 per 100,000 compared with 483.9.
In Nottingham City the majority of attendances to ED are due to bruises and wounds
(31.2%). In Nottinghamshire County the majority of ED attendances are due to fractures,
dislocation and joint injuries (24.8%).
In Nottingham and Nottinghamshire the four main reasons for attendances to ED are
bruising/abrasions, fractures, ligament sprain and cuts.
5.7. ROAD TRAFFIC COLLISIONS
Nationally: mobile phones and other smart devices have been attributed to increased
unintentional injuries. The AXA Roadsafe report [4] states that:
“Texting, tweeting, checking Facebook, surfing the internet and playing games on mobile
phones could be responsible for a rise in the number of 11-12 year old children suffering
road traffic accidents.
32% of all pedestrians seriously injured or killed during school run time are 11-12
years old and an 11 year old pedestrian is three times more likely to be killed or
seriously injured during the school run than a 10 year old.”
Locally: Data is 0-17 years for both Nottingham and Nottinghamshire during 2010-2013
taken from Hospital Data;
• Pedal cycles: A total of 361, 275 of which were to county residents
• Pedestrians: A total of 165, 53 of which were to city residents
• Car occupants: A total of 58, 48 of which were to county residents
• Motorcycles: A total of 75, 8 of which were to city residents.
Road Safety Data for 2012 show that for the 0-15 yr group there were there were 4
fatailities, 52 Serious Injuries and 278 slight injuries. 0-5 yrs pedestrians there were 34 KSI
and 102 Slight injuries; More details are in Appendix 2.
Data from the Department For transport (appendix 1) shows that since 1979 there has been
a steady decrease in the rate of children killed and seriously injured (KSI) on the county’s
roads. However, death and casualty rates from road traffic collisions (RTCs) in
Nottinghamshire as a whole remain significantly higher than the England average. The
areas with the highest rate of KSI are rural areas with rural road networks and A roads.
165.8. SEASONAL VARIATION
There are seasonal variations for both admissions and attendances to ED in under 18’s in
both Nottingham City and Nottinghamshire County. ED attendances and admissions are
highest throughout the spring and summer months.
5.9. AREAS OF GREATEST INTEREST: DEPRIVATION, DISADVANTAGE AND GEOGRAPHY
There is a clear association between injury and disadvantage. In Nottingham City, children
in the most disadvantaged quintile are 1.23 times more likely to be admitted as inpatients
and 1.11 times more likely to attend ED than those in the least deprived quintile (National
IMD Quintiles).
In Nottinghamshire County the gap is more pronounced with people in the most deprived
quintile being 1.77 times more likely to be an inpatient and 1.74 times more likely to attend
ED than the least deprived quintile.
The rate of hospital admissions in Bassetlaw is very high in comparison with the other
districts at 1,301 per 100,000 population. The 2nd highest is Newark & Sherwood at 981 per
100,000 (Data from 2010-2013).The districts with the highest incidence of ED attendance
for avoidable injury are Newark & Sherwood followed by Bassetlaw.
Nottingham City ward level data: the highest number of inpatient admissions for City was in
Aspley Ward and it is ranked 2nd by rate per 100,000 population.
6. EVIDENCE BASE: WHAT WORKS?
NICE Guidance recommended the following:
• Coordinating avoidable injury prevention activities:
- Ensure there is a CYP injury prevention coordinator
• Installation and maintenance of permanent safety equipment in social and rented
dwellings
• Incorporating home safety assessments and equipment provision within local plans
and strategies for CYP health and wellbeing
There is strong evidence to suggest that reducing speed limits in built up urban areas will
have a significant impact on reducing injuries on the roads and outdoors for anyone under
the age of 25 [11, 12, 13, 15, 17].
6.1. THE 5 E’S OF ACTION
The Centre for Disease Control [14] details 5 actions that need to be addressed to have the
greatest impact to reduce and prevent serious unintentional injuries:
• Environment: Improvement in planning and design which results in safer homes,
routes to school, leisure areas and roads. Adaptations to the environment such as
fireguards, stair gates and cupboard locks help to make the home safer. Cycle lanes,
speed limits and pedestrian crossings may make roads safer.
• Education: Increased awareness of the risk of accidents in a variety of settings for
children, parents and carers and providing information on ways of minimising these
risks.
• Empowerment: Local consultation and community involvement can generate a
strong sense of commitment and ownership. Avoidable injury prevention initiatives
that involve the community, have been influenced by a community and that are owned
by a community have been shown to result in better outcomes and commitment.
• Enforcement: There is legislation which relates to child safety e.g. child car seats.
These regulations ensure that the products we buy meet a reasonable level of safety
performance, that road regulations are adhered to and that new dwellings meet an
acceptable level of safety
• Engineering: This relates to the design and development of products, housing etc,
taking safety into account.
These five approaches should not be considered in isolation. Successful strategies will
consider all of them in the planning and development stages. A combination of approaches
may be needed.
177. MEETING LOCAL NEEDS
7.1. GAPS IN PROVISION
A range of local interventions delivered by agencies aim to reduce avoidable injures in
children and young people. These interventions are not equitably distributed (do not cover
all areas or necessarily areas of greatest need). Many are funding-dependent and not
mainstreamed or have sustainability issues. There is a requirement to improve coordination
and communication between agencies.
7.2. RESOURCES
It should be recognised there is a commitment to reducing avoidable injuries in many
agencies across Nottingham and Nottinghamshire. All of these have some resource, mostly
staff time.
The coordination of avoidable injuries within City and County is being led by Public Health
Consultants and staff in Nottingham City and Nottinghamshire County.
The agencies who have made pledges and others are all participating in delivering this
strategy and its resulting actions in a coordinated way.
It is recognised that in order to have a substantial impact upon this most important of issues,
further financial resources will be required and explored.
8. INFORMING THE STRATEGY TO DATE
8.1. STAKEHOLDER DAY
Public Health Nottingham City and Nottinghamshire County hosted a stakeholder day on
13th July 2013, to galvanize stakeholder interest in preventing avoidable injuries in children
and young people.
8.2. MAPPING EXERCISE
Following the stakeholder day, an avoidable injuries intervention mapping exercise was
undertaken (See Appendix 2). The intervention mapping exercise was sent to all the
stakeholders who attended the event and other key agencies who were unable to attend the
stakeholder day. The results of the mapping indicated:
• There are many avoidable injuries interventions focusing on the under 5’s. However,
many of the agencies who are delivering them are working in silos.
• There is potential to utilise the statutory agencies more, for example Nottinghamshire
Fire & Rescue in the delivery of avoidable injuries interventions.
• Nottingham City Council and Nottinghamshire County Council have excellent road
safety partnerships
• The voluntary sector is an important contributor to tackling avoidable injuries within
Nottinghamshire County.
8.3. CONSULTATION AND ENGAGEMENT
The strategy was developed in partnership by the strategic group and was widely consulted
upon prior to the Health and Wellbeing Board’s approval (both City and County).
The draft was put out to full public consultation and received 268 Reponses from
individuals, organisations and groups, a detailed report is available.
Team members also attended meeting of the following groups;
• Health and wellbeing implementation group (Nottinghamshire)
• Children Trust Board
• Children’s Safe Guarding Board
• Commissioning Executive Group (City)
Or invited/received formal feedback from the following separate to the consultation
questionnaire;
18• Children’s integrated commissioning hub (Nottinghamshire)
• CCGs
• District councils
• Police
• Fire
• Road Safety Partnership
9. MONITORING OF THE STRATEGY AND REPORTING STRUCTURE
The Nottinghamshire County and City Avoidable Injuries Steering Group and the Health &
Wellbeing Implementation Groups will monitor delivery of the strategy on behalf of the
Nottinghamshire and Nottingham Health and Well-being Groups.
Each organization involved in the delivery of the strategy will have a mechanism to ensure
delivery of the strategy.
9.1. REPORTING STRUCTURE
Health & Wellbeing Boards (Both
Nottingham & Nottinghamshire)
Health & Wellbeing Commissioning
Implementation Group Executive Group
(Nottinghamshire) (Nottingham City) Children’s Trust Boards
Children’s Safeguarding
Avoidable Injuries Strategic Partnership Group Boards
Children’s
integrated
Home Safety Road Safety Leisure Safety commissioning
Sub Group Partnership Sub Group hubs
Dotted lines are indirect reports or kept informed of progress
10. EVALUATION
This strategy will be subjected to regular review in order that progress is assessed and
priorities redefined. The first major review will take place one year from launch.
11. ACTION PLAN
The partner organisations committed to the strategy are to take forward a programme of
activity to reduce avoidable injuries in CYP. It is anticipated that the action plan will be a live
plan which will be updated and amended throughout the course of the strategy.
11.1. SUB GROUPS
A series of sub groups will be identified or established to lead on the key objectives from
this strategy.
It is envisaged that the following will happen;
Home: Establish a group to focus on interventions to improve home safety and reduce risks
in the home setting
Road: Link in with the existing road safety partnership group
Leisure: A longer term aim is to establish a group to focus on risk reduction in the leisure
setting.
19Objectives Actions Outcomes Possible Timescales Progress
Lead/stakeholders
To coordinate all services 1. Undertake multi- Public Health
who have a role to play in agency mapping Nottingham City
preventing avoidable exercise, followed by Council/
injuries gap analysis in line Nottinghamshire
with gaps in services. County Council
Road Safety: 2.
To ensure education,
enforcement and promotion
of appropriate road safety to
include;
• Fitting and use of car
seats, booster seats
and seat belt fitting.
• Speed reduction
schemes of maximum
20mph especially in
urban areas and
locations within
proximity to schools.
• Education in schools
that is age appropriate
• Cycle training and
education including
helmet safety. (this
overlaps with leisure
and off road cycling)
Home Safety: 3. Develop business Feb 2014 – Feb
To establish consistent, cases and Sustainable provision of 2020
equitable and sustainable project/action plans to interventions to reduce
home safety education and establish funding or to AI in the home setting.
equipment schemes mainstream key
beginning in the areas of services; In relation Parents enabled
greatest need. This will home safety empowered to be aware
Author Sonya Clark, Public Health Manager Page 20 of 27Objectives Actions Outcomes Possible Timescales Progress
Lead/stakeholders
require partnership working equipment schemes of risk and how to
and identification of funding. aiming for a mitigate against them
To cover; proportionate and provided with
Falls universalist approach, equipment to support
Poisoning Work with northern these mitigation
Burns district CCGs, strategies.
Scalds voluntary sector and
Accidental asphyxiation community providers to
(drowning and strangling) develop plans for local
delivery.
4. Work with City CCG to
achieve the best
approach to
commissioning home
equipment scheme
services
5. To ensure that the
communications plan
incorporates all
aspects of home safety
and covers all groups
are required.
6. Develop a Available July 2014-on going
To raise awareness of types communications plan Parents, children and communications
of injuries and how they can with partners, based carers are better leads from
be avoided – linked with on social marketing informed about risk and stakeholder
other initiatives such as and market how to make a risk agencies.
equipment schemes and segmentation assessment and avoid
road safety education. techniques as well as potential scenarios that Public Health
mass media for a may lead to injury. Nottingham City
range of messages in Council/
relation to avoidable Nottinghamshire
injuries County Council –
7. Communicate services stakeholders
available to all people relevant to each
who work front line segment this will
Page 21 of 27Objectives Actions Outcomes Possible Timescales Progress
Lead/stakeholders
• Set up sub group include children’s
• Development of centres, schools,
Task and finish health visiting
groups services police and
• focusing on home fire and rescue
safety, road safety among others.
and outdoor safety
• Training for
professionals and
volunteers
8. Adopt a standardised
checklist for avoidable
injuries in the home
To develop a Consultation with children
communication plan that and parents through the
will; City Council and the
engage all relevant partners County Council groups
deliver key messages to Target partners
appropriate segments of the Target population
community on various Develop media material
prevention activities Develop subgroup to
including home safety, road develop and integrate
safety and safety in leisure comms plan
time Ensure AI pathway is
included on Information
Prescription website,
nottsinfoscript
To maximise and prioritise To identify sources of Public Health
resources to achieve the set funding and look for Allocation of funding to Nottingham City
objectives and outcomes sustainable methods of appropriate Council/
delivery. developments for Nottinghamshire
example home safety County Council
equipment scheme)
Page 22 of 27Objectives Actions Outcomes Possible Timescales Progress
Lead/stakeholders
To review training needs for
frontline staff in organisation
who will deliver
improvements in this area
and suggest a program of
ongoing training and
support.
To ensure evaluation is built All sub groups look at
into all developments at the evaluation and coordinate
onset of each project and develop regular
evaluation reports
To develop and implement All partners to commit to Avoidable injuries Public Health July 2013-on going
a coordinated approach to data sharing and make dashboard for the city Nottingham City
surveillance, data collection, data available and the county which Council/
sharing and reporting. includes all relevant Nottinghamshire
avoidable injuries data County Council
from all stakeholders
To develop evidence- All projects developed to July 2013-on going
based be in line with the best
approach/programme to available evidence
avoidable injuries Development of a home
safety equipment scheme
Page 23 of 2712. REFERENCES
1. Davis R, P. B. (2001). BMJ bans accident. BMJ, 322: 132
2. The Audit Commission. Better safe than sorry, Preventing unintentional injury to
Children. London : s.n., 2007
3. Office of National Statistics.(2010)
4. Report carried out by AXA and Roadsafe
(http://www.roadsafe.com/news/article.aspx?article=2073
5. The Marmot Review. Fair Society. Healthy Lives: Strategic Review of Health
Inequalities in England post-2010. London : s.n., 2010.
6. WHO. Injury Pyramid. http://www.who.int/violence_injury_prevention/key_facts/en/
(Accessed 06-01-2014)
7. NICE. (2010). New NICE guidance to reduce number of child injuries and deaths
http://www.nice.org.uk/newsroom/pressreleases/preventingunintentionalinjuriesun
der15s.jsp
8. Elizabeth Towner, Therese Dowswell, Gail Errington, Matthew Burkes, John
Towner. Injuries in children aged 0–14 years and inequalities. s.l. : Health
development Agency, 2005.
9. CMO report October 2013 https://www.gov.uk/government/news/chief-medical-
officer-prevention-pays-our-children-deserve-better.
10. Department of Health. Improving outcomes and supporting transparency (a public
health outcomes framework for England). 2012.
11. Dorling, D. 2014. 20mph Speed Limits for Cars in Residential Areas, by Shops and
Schools, in British Academy, If you could do one thing…" Nine local actions to
reduce health inequalities. London: BA.
12. Wang, J., Poulter, D., Purcell, C. 2011 Reduced Sensitivity to Visual Looming
Inflates the Risk Posed by Speeding Vehicles When Children Try to Cross the
Road, Psychological Science, 22, 4, 429-434.
13. LGIU Policy Briefing 2012 Area-wide 20mph neighbourhoods: a win, win, win for
local authorities http://www.lgiu.org.uk/wp-content/uploads/2013/12/Area-wide-
20mph-neighbourhoods-a-win-win-win-for-local-authorities.pdf accessed 13th
January 2014.
14. Center for Disease Control and Prevention, National Center for Injury Prevention
and Control. National Action Plan for Child Injury Prevention. Atlanta(GA): CDC,
NCIPC; 2012.
www.cdc.gov/safechild/pdf/National_Action_Plan_for_Child_Injury_Prevention.pdf
(Accessed 16-01-2014)
15. Dorn, D. L. The Young Novice Driver Brain. s.l. : Cranfield University, 2009.
16. The Royal Society for the prevention of Accidents, PHE. Delivering Accident
Prevention at local level in the new public health system. 2013.
17. British Academy. 2014. If you Could Do One thing….9 local actions to reduce
health inequalities. http://www.britac.ac.uk/policy/Health_Inequalities.cfm
Author Sonya Clark, Public Health Manager Page 24 of 2718. A M Kemp, S Jones, Z Lawson and S A Maguire. 2014. Patterns of Burns and Scalds in
Children. Arch Dis Child 2014;99:316-321 doi:10.1136/archdischild-2013-304991
http://adc.bmj.com/content/99/4/316
19. Legal definition of a child NSPCC factsheet July 2013
20. England’s Child Protection Guidelines
21. Department of Health: Reference Costs 2011-12.
https://www.gov.uk/government/uploads/system/uploads/attachment_data/file/213
060/2011-12-reference-costs-publication.pdf
13. SUPPORTING MATERIAL & ADDITIONAL READING
UK Government, Making roads safer https://www.gov.uk/government/policies/making-roads-
safer
The updated Strategic Framework for Road Safety
https://www.gov.uk/government/publications/strategic-framework-for-road-safety
Think Education road safety booklet http://think.direct.gov.uk/education/early-years-and-
primary/docs/booklet_senior_managers.pdf
European child safety alliance Good practice guide
http://www.childsafetyeurope.org/publications/goodpracticeguide/info/good-practice-
guide.pdf
Walter, R. Re-evaluting Home Accidents. London : TRL, 2012.
Sex differences in child and adolescent mortality in the Nordic countries, 1981–2000.
Gissler M, Rahkonen O, Mortensen L, et al. s.l. : Scand J Public Health 37: 340–346,
2009, Scand J Public Health 37, pp. 340–346.
Shakiba Habibula (2013) , Consultant in Public Health, Buckinghamshire County Council:
Avoidable Injury in Children
Page 25 of 27You can also read