How do governments perform in facing - COVID-19? - Munich ...
←
→
Page content transcription
If your browser does not render page correctly, please read the page content below
Munich Personal RePEc Archive

How do governments perform in facing
COVID-19?

Ghasemi, Abdolrasoul and Boroumand, Yasaman and
Shirazi, Masoud

Allameh Tabataba‘i University

15 April 2020

Online at https://mpra.ub.uni-muenchen.de/99844/
MPRA Paper No. 99844, posted 24 Apr 2020 16:01 UTC
How Do Governments Perform in Facing COVID-19?

                   Abdolrasoul Ghasemi1, Yasaman Boroumand2, Masoud Shirazi3

Abstract

The issue of coronavirus outbreak in the world, though new, is equally pervasive. It has posed a
new and ambiguous challenge to the economic growth of countries around the world.
Undoubtedly, the efforts of countries to curb the spread of this virus and reduce the number of
deaths are necessary for other strategies that will be taken in other areas, especially in the economic
field. Comparing countries only based one the statistics on virus spread and mortality without
considering the contextual variables, can be misleading. Thus using dynamic data envelopment
analysis, this study calculated the performance of 19 selected countries in two dimensions:
inefficiency of preventing coronavirus spread and inefficiency of preventing deaths caused by
coronavirus from February 2 to April 12. According to the study, the inefficiency trend of
preventing coronavirus spread in Singapore, South Korea, China and Australia are decreasing
during the period under review and the inefficiency trend of other countries, which of course differ
in terms of inefficiency, are increasing with different slopes. Also, Australia, Finland, Japan,
Malaysia, Singapore and Thailand have experienced less inefficiency in preventing deaths caused
by coronavirus compared to other countries. Stringency index and global health security (GHS)
index have been used as well, to analyze the findings and at the end some suggestions have been
presented.

Key Words: Coronavirus, Covid19, DEA, Window Analysis, Efficiency, Government

JEL Classification: C61, I18, H11

1
  Associate Professor, Faculty of Economics, Allameh Tabataba’i University, Tehran, Iran, Postal Code:
1513615411 (Corresponding Author), Email: a.ghasemi@atu.ac.ir
2
  Researcher, Tehran, Iran, Email: boroumand.yasaman.er@gmail.com
3
 PhD Student, Faculty of Economics, Allameh Tabataba’i University, Tehran, Iran, Email:
shirazy.masoud@gmail.com

                                                        1
Introduction
During the last months, people and governments in various countries, one after another, have been
challenged by the fast spread of COVID-19 and its consequences. The health risk of the virus is
undoubtedly the most important challenge in hand that has vast consequences both in the near and
far future. It also raises many questions regarding other aspects of the disease, one of which is
about the economic consequences. What will be ahead of those countries involved in short-term
and long-term? How have been the governments responding to this? And more importantly, in
what quality are they handling the negative consequences?
In order to anticipate the future economic status of these countries, their current situation has to
be taken into account; which is highly influenced by the response of each government to
COVID-19 outbreak. How they have perceived the status change, how they planned to face it,
and how at the end they applied their plans, will all be the matters of interest. Since law
enforcement and the level of stringency both influence the government performance (Platform,
2015), they should be taken into consideration in this analysis. Moreover, studying the
government performance in each country will give a good comparison tool. So the countries can
learn from each other in a more systematic way, while they do not repeat the mistakes of the
others, or at least try not to do so. In fact, evaluating performance of various governments have
been in the center of attention before this pandemic, as the countries like US, Canada, and
Australia have been investing in designing performance frameworks (Arah, Westert, Hurst, &
Klazinga, 2006). But now it is more important to focus on this topic.
Government performance evaluation requires a careful consideration of the factors that could
influence the spread of this disease, such as population density and the percentage of elderly in
each of the affected countries (Singh & Adhikari, 2020), (Liu, Chen, Lin, & Han, 2020), (Gaeta,
22020). But regardless of these factors, looking at the raw data and statistics on the spread of the
COVID-19 and the mortality caused by it can be misleading, which means a comprehensive
analysis is needed. Therefor this research concentrates on the performance of involved
governments when facing the spread of coronavirus in their countries.
Aiming to estimate the governments’ performance, two dimensions are chosen for the model of
this research; prevention of COVID-19 spread and prevention of mortality caused by the disease.
While designing our model, a necessary step was considering the similar experiences in the past,
one of which was the Spanish flu from January 1918 to December 1920. Comparing the economic
consequences of COVID-19 with Spanish flu; the estimates of Barro et al show that there is the
possibility of a global economic contraction, because of a reduction in both GDP and private
consumption in affected countries. They also state that in short term, there is the possibility of a
reduction in real returns on stocks as well as government bills (Barro, Ursúa, & Weng, 2020).
When the health of many people all around the world is at stake because of a disease, eliminating
it becomes a global public good (L. C. Chen, Evans, & Cash, 1999), (Dayrit & Mendoza, 2020).
While the detailed effects of the current situation is developing to this moment and yet to be
studied, the vast influence of the pandemic on the economy of various countries is undeniable. In
general, a pandemic would make the involved countries face economic difficulties including a
decrease of labor force and a change in the risk of investment (McKibbin & Sidorenko, 2006). But
this particular case has influenced G7 and China, which translates into the involvement of 60%
world GPD and 40% world manufacturing exports (Baldwin & di Mauro, 2020). Needless to say
that the rest of the world is also struggling with COVID-19 now and its effects are even larger.
Given the possibility of such a vast impact, the current study tries to respond to the necessity of
3evaluating how governments have performed in both preventing the spread of the virus and
preventing the mortality.
Literature Review
As a public health emergency is occurring, one aspect of it is how one’s mind perceives the crisis,
and more importantly, when it is taken seriously. To put it simply, in the early stage of this
pandemic, many citizens seemed to underestimate it (Baldwin & di Mauro, 2020). So, on top of
taking care of people’s lives, the behavior of involved citizens turns out to be an additional
challenge for the governments. In order to overcome this outbreak, it is not only the behavior of
the disease itself that has to be studied, but also the behavioral patterns of people in involved
countries (Haushofer & Metcalf, 2020). Hence this multi-dimensional issue in hand needs to be
taken care of with multi-dimensional studies.
The consequences of previous viruses like Ebola on one hand, and the various scenarios of what
comes ahead because of this pandemic on the other hand, show the necessity of prioritizing global
investment in healthcare; as it is necessary to avoid further costs caused by COVID-19,(Yazbeck
& Soucat, 2019) (McKibbin & Fernando, 2020). Without doing so, the developing countries with
high population density will face higher costs than the others (McKibbin & Fernando, 2020).
Considering the level of development and its influence on the current crisis, the institutional
structure of the economy in involved countries is also worthy of note. As more inclusive
institutions associate with a higher level of economic development (Acemoglu, Gallego, &
Robinson, 2014), they also lead to better outcomes for healthcare system (Miller, Toffolutti, &
Reeves, 2018). Here, the situation we aim to analyze is subject to an ongoing crisis that is very
4new and rather shocking to the world. So the model is designed to take one step toward evaluating
how various countries with various qualities of healthcare system are responding to the pandemic.
When concentrating on health system and how efficient it has been, the expectations about the
system vary from those of totally normal situations. Before this pandemic, what one had in mind
about proper access to healthcare system was mainly based on the normal conditions (Dayrit &
Mendoza, 2020). However, studying the effects of a pandemic communicable disease requires a
model that takes into account the critical situation of now; in which the efficient respond of
governments play a more important role than before.
The different expectations aside, we need to consider that the healthcare systems are trying so hard
to overcome this pandemic, but they are not fundamentally different than some months before
COVID-19 outbreak. So, when analyzing their success in handling the situation, it is useful to go
back to the criticisms that have been made before. In low-income developing countries, providing
proper public healthcare has been challenging before (Woolcock, 2018). In some developed
countries, however, the challenge is at a different level and for other reasons. In the United States
of America, the absence of universal healthcare seems to cause an inequality in receiving the
primary healthcare for all the Americans (Rashford, 2007). The inequality of accessing healthcare
is also addressed by the researchers in other countries like Taiwan (Kuo & Lai, 2013). The
extraordinary nature of this situation translates into a shock to the global economy as well as the
health system. As these two go hand in hand, we have to pay a close attention to both of them.
Therefore, an economic analysis can help find a way out of this crisis only if the valuable points
made by the previous studies that worked on the weaknesses of the health system are considered.
5In a qualitative analysis of government performance, Bardhan concentrates on Chinese governance
system in three main aspects; internal organization of government, corruption, and de-centralized
structures. He mentions that in analyzing the former, the behavior of government regarding
information transparency must be considered, as suppressing the information regarding a shock to
the economy like COVID-19 affects the dimensions of the crisis(Bardhan, 2020). Thus, we try to
apply inclusive criteria that show the governments’ efficiency in dealing with this shock.
Various factors are said to affect the risk level of COVID-19 outbreak; and the population
characteristics is one of them. Due to the nature of COVID-19, the population age plays a role in
the spread of the disease, as the elderly mortality because of the virus seems to be higher than
young patients (Liu et al., 2020) (Z. Chen et al., 2020) (Shim, Tariq, Choi, Lee, & Chowell, 2020).
In China, to begin with, the potential risk factor of older people was higher (Zhou et al., 2020)
(Verity et al., 2020). Also, in Italy 42·2% of the patients who passed away were 80–89 years old,
and 32·4% of them were 70–79 years old, and the mean mortality age was 81 until March 12th
(Remuzzi & Remuzzi, 2020). also In other countries like US, UK, Brazil, and Nigeria the mortality
risk is much higher for older people (Dowd et al., 2020). In addition to age structure, population
density is considered to affect the risk of spreading this disease. For instance, in Milan area that
the population density is high, the virus has a high growth rate (Gaeta, 2020).
Public health infrastructure, particularly laboratory capabilities would be the other factor that is
said to have an influence on the current pandemic (Smith & Fraser, 2020). For example, one of the
challenges that Wuhan dealt with was the limited capacity of testing (Xie et al., 2020). A laboratory
capacity limitation can easily lead to an underestimation of the fertility rate (Sohrabi et al., 2020),
which then leads to an underestimation in macro-level analysis of the disease’s impacts.
6A necessity in the process of designing the model for government performance evaluation was to
review the methods that have been used in this area before. The measurement of government
performance in previous studies has been examined under topics such as government efficiency,
governments’ performance, Public Sector Performance (PSP) and Public Sector Efficiency (PSE)
by application of a verity ranges of methods such as ratio analysis, Least-squares Regression
(LSR), Total Factor Productivity (TFP), Stochastic Frontier Analysis (SFA), and Data
Envelopment Analysis (DEA) (Ozcan, 2008), (Afonso, Schuknecht, & Tanzi, 2010), (Hauner &
Kyobe, 2010), (Asandului, Roman, & Fatulescu, 2014) (Ahmed et al., 2019). Generally, these
methods are known as benchmark analysis techniques. These techniques are about the
measurement of the output(s) level that are provided for inputs level, which are used based on the
benchmark (Peacock, Chan, Mangolini, & Johansen, 2001). Benchmarks Analysis Techniques
mainly fall into two main categories include parametric methods and non-parametric methods.
To choose a method for estimating government performance in this specific pandemic, it is
important to keep in mind that the disease is very new to the human societies, and as a result the
body of research is still young. But a comparison between various methods in previous research
on health economics and healthcare system efficiency led to paramedic methods and amongst them
DEA was chosen based on the advantages it provides here. (DEA) is the method mainly used in
measuring healthcare system efficiency (Stefko, Gavurova, & Kocisova, 2018), (Ozcan, 2008),
(Asandului et al., 2014), (Galterio, Helton, Langabeer 2nd, & DelliFraine, 2009), (Dacosta-Claro
& Lapierre, 2003). In general, this non-parametric method gives the chance to estimate the
inefficiency of healthcare system and it allows for using multiple inputs and outputs
simultaneously (Ozcan, 2008), (Stefko et al., 2018).
7In this particular research, DEA is chosen for three reasons. First, it allows to measure efficiency,
comparing the best practice and not the average one. Second, it neither requires the use of a pre-
specified functional form nor distributional assumptions about error terms. And finally, it does not
require as much data as other parametric methods do (Emrouznejad & Podinovski, 2004), which
makes it stand out because the world is still in an early stage of dealing with this disease. Thus, a
two-stage DEA model is applied in this study to identify the efficient and inefficient performance
of governments in each dimension. Using the results, the research then compares different
countries and analyzes their characteristics and policies to highlights improvement capacities.
One last point that is considered in this study is to provide a comparable time frame due to the
different time of virus spread in different countries. In the results analysis section, the research
describes the performance of governments in preventing the outbreak. An important aspect is the
level of public support for the implementation of these laws and another one is the law enforcement
applied by the governments, because the legal tools like quarantine need to be secured by the law
enforcement in involved countries (Wilder-Smith & Freedman, 2020), (Gostin, Friedman, &
Wetter, 2020). Also, as the level of strictness can have an influence on the results of a policy
(Fadlallah et al., 2018), the strictness of applied policies is another aspect to consider in analyzing
the results. Accordingly, the research conclusion provides suggestions for the policymakers as well
as other researchers. We try to address some of the questions that need to be answered, as we are
still in the beginning of this road.
Methodology
Although in small cases, the performance of a system could be presented by relative criteria, but
with increasing the dimensions and complexity of the system, other performance measurement
approaches have been developed. Data Envelopment Analysis is a data-oriented method and is
8widely used as a data-driven approach for evaluating and enhancing performance (Cook & Zhu,
2006).
In 1978, Charnes, Cooper and Rhodes introduced DEA as a non-parametric approach based on
linear programming technique. A DMU is a decision-making unit in order to transform multiple
inputs into output(s) (Emrouznejad & Podinovski, 2004), and evaluating the performance of a unit
by comparing its performance with the best performing units of the sample. Unlike the parametric
models and based on a set of inputs and outputs, DEA is used to optimize each DMU individually,
calculating an empirical efficient frontier (Mantri, 2008).
The technical component of economic efficiency refers to the ability of a DMU to either maximize
output(s) as technology and inputs usage needed or minimize inputs use as technology and
output/service production required. (Fried, Lovell, Schmidt, & Schmidt, 2008). Thus the analysis
of technical efficiency could have an output augmenting orientation or an input conserving
orientation. An input- oriented DEA manages the input reduction, which is necessary for the
measure to become efficient, keeping the output constant. On the other hand, an output oriented
measure is related to output expansion, holding the input constant. Moreover, a non-oriented
measure quantifies the improvements when both inputs and outputs can be modified
simultaneously Input or output orientation is selected based on those ones over which the managers
have the most control. (Coelli, Rao, O'Donnell, & Battese, 2005)
DEA gives inputs/outputs targets for inefficient units as benchmarks, since the outputs and inputs
of such a virtual unit are linear combinations of corresponding outputs and inputs of all other units.
Specifically, the benchmark represents the peer group for the inefficient DMU (Thanassoulis,
Portela, & Despic, 2008).
9The performance measurement is indicated by efficiency score. Based on evaluation of relative
efficiency of the suggested set of units, the analysis expresses the interaction between inputs and
outputs to be changed in order to maximize the efficiency of the target DMU. Moreover, the
benchmark for each inefficient DMU at the level of its individual combination of inputs and
outputs is considered with DEA. Furthermore, the main features of DEA are as follows: First, it
classifies each DMU as inefficient or efficient (the DMU that makes up the efficient frontier),
based on individual observations, instead of mean values. Then, DEA incorporates inputs and
outputs with different units of measures identifying optimal production and consumption values.
The next DEA feature is to determine the inefficiency measure for every unit away from the
frontier and work without converting all inputs and outputs in monetary units. Finally, considering
discrepant values as comparison parameters for DMUs are mentioned (De Souza, Moreira, Avelar,
de Faria Marques, & Lara, 2014). Based on a CCR model, the efficiency of k -the decision making
unit DMU k k 1, 2, , n to determine the weight coefficients of output and input variables to
which the value of the relationship will be maximized is as follows:
s
u r y rk
max hk r 1
m
v x
i 1
i ik
Subject to:
s
u r y rj
r 1
m
1, j 1,2,, n
v x i ij
i 1 (1)
u r 0, r 1,2,, s
vi 0, i 1,2,, m
10where: hk - the relative efficiency of the k -the decision-making unit; n - the number of decision-
making units; m - the number of inputs; s - the number of outputs; vi - weight coefficients for
input i ; u r - weight coefficient for output r ; xij - the amount of input i for the j -the decision-
making unit, DMU j ; y rj - the amount of output r for the j -the decision-making unit, DMU j
.The linear programing technique is supposed to make the efficiency of the unit as large as possible.
In other words, DEA mentions the weights of inputs and outputs leading to the calculated
efficiency. Then, the unit is efficient if the efficiency is equal to 1 and of course inefficient for
lower than 1 level. So, the efficient units combine inputs better than inefficient ones or the efficient
units follow to produce more outputs using a given combination of inputs.
Data envelopment analysis exploits the ability to calculate the efficiency of N decision making
units in T time periods. To overcome this limitation of DEA, several options are available (Fried
et al., 2008):
Estimation of a single grand frontier for all of data as a pool: efficiency trends in short run when
the technology doesn’t vary and analyzing decision making of unit’s efficiency is preferred, this
method can be considered a good option. In long run with technological change assumption, this
method may be untenable (Fried et al., 2008).
Estimation of T separate frontier for T periods: Choosing this method when we want to compare
the performance of decision-making units at any time which should reflect local progress of DMUs
but when excessive variation of local frontier c, can impose the volatility of efficiencies, can be
problematic (Fried et al., 2008).
11Window DEA analysis: This name and the basic concept are introduced by G. Klopp (1985) who
developed these techniques in his capacity as chief statistician for the U.S. Army Recruiting
Command (Cooper, Seiford, & Zhu, 2011). Charnes et al. (1985) proposed a dynamic DEA to
measure the efficiency level of DMUs with respect to its own performance over time as well as
comparison with other DMUs in defined window (Pulina, Detotto, & Paba, 2010). In this method
with estimation of a sequence of overlapping pooled panels, each polled panel consists of a few
time known as “window” and the efficiency of each DMU is calculated in each period in each
window. This method provides a compromise between the estimation of a single grand frontier for
all of data as a pool and the estimation of T separate frontier for T periods.
Malmquist index: this index as a “comparative statics" analysis, quantifies the productivity change
of a DMU between two time periods as a “comparative statics" analysis by define Catch-up and
Frontier-shift terms. The catch-up (or recovery) term relates the efficiency change that a DMU
improves or worsens its efficiency, while the frontier-shift (or innovation) term reflects technical
change that is the change in the efficient frontiers between the two time periods (Cooper et al.,
2011). The efficiency and technology change between two periods calculate as follows:
,
Efficiency Change (EC) = ( ( , )
), (2)
, ,
Technical Change (TC) = ( × ( , )
) , (3)
,
In this study, due to the use of weekly data in short run and the possibility of comparing each
country’s performance with its own and other countries' performance during the time periods on
one hand, and the impossibility of changing technology over this time on the other hand, a window
data envelopment analysis model has been used with window width one. This model actually
12works as the estimation of a single grand frontier for all of data as a pool for using data
envelopment analysis over time.
Data and variables
In this study, according to the available data, the performance of governments was measured in
two dimensions: controlling the prevalence of Coronavirus and preventing the mortality caused by
Coronavirus.
Due to data limitation, only 19 countries were selected for which, coronavirus cases information
existed at least for a period of 70 days in internationally reputable databases. The selected countries
are Australia, Canada, China, Finland, France, Germany, India, Malaysia, Russia, Singapore,
Sweden, Thailand, The United States, Italy, Spain, Japan, Philippines, Korea South and The United
Kingdom.
Models:
Model (1): Inefficiency of preventing coronavirus spread
In the first step, a DEA model with one (undesirable) output and two inputs was designed to
investigate the inefficiency of countries in preventing the spread of coronavirus.
Output: corona confirmed cases in each time
The data on cases of coronavirus are weekly and start on February 2 and last until April 12.
Coronavirus cases in selected countries over this time period are shown in table (1).
13Table (1): Confirmed coronavirus cases in selected countries
Time Period
Country 2/2 2/9 2/16 2/23 3/1 3/8 3/15 3/22 3/29 4/5 4/12
Australia 12 15 15 15 27 76 297 1549 3984 5687 6315
Canada 4 7 7 9 24 64 252 1469 6280 15756 24298
China 16630 39829 70513 77022 79932 80823 81003 81435 82122 82602 83134
Finland 1 1 1 1 6 23 244 626 1240 1927 2974
France 6 11 12 12 130 1126 4499 16018 40174 92839 132591
Germany 10 14 16 16 130 1040 5795 24873 62095 100123 127854
India 2 3 3 3 3 39 113 396 1024 3588 9205
Italy 2 3 3 155 1694 7375 24747 59138 97689 128948 156363
Japan 20 26 59 147 256 502 839 1101 1866 3139 6748
Korea,
South 15 25 29 602 3736 7314 8162 8961 9583 10237 10512
Malaysia 8 16 22 22 29 99 428 1306 2470 3662 4683
Philippines 2 3 3 3 3 10 140 380 1418 3246 4648
Russia 2 2 2 2 2 17 63 367 1534 5389 15770
Singapore 18 40 75 89 106 150 226 455 844 1309 2532
Spain 1 2 2 2 84 673 7798 28768 80110 131646 166831
Sweden 1 1 1 1 14 203 1022 1934 3700 6830 10483
Thailand 19 32 34 35 42 50 114 599 1388 2169 2551
United
Kingdom 2 3 9 9 36 273 1140 5683 19522 47806 84279
US 8 11 13 15 74 518 3499 33276 140909 337072 555313
Source: Johns Hopkins University (coronavirus resource center), 2020
Inputs: Population and Population density are the most important that could affect the coronavirus
cases in each country. The number of Corona cases is directly related to the population of
countries. Population density is measured by the number of human inhabitants per square
kilometer. Given the emphasis on social distancing for reducing the spread of the virus, it is
expected that the higher the population density in a country is, the higher the chances of spreading
the virus are. Among the selected countries in our study, China and India have the largest
populations, and Finland and Singapore have the lowest populations. In our sample, Singapore and
14India have the highest population density and Australia and Canada have the lowest population
density. Table (2) shows the status of the first DEA model's inputs and output for each country.
Model (2): inefficiency of preventing deaths caused by coronavirus
Other objective that was investigated in this research is calculating the inefficiency of countries in
reducing the mortality of coronavirus cases. Based on this, a dynamic DEA model with an
(undesirable) output and three inputs is designed as follows:
Output: Coronavirus confirmed deaths
The coronavirus confirmed death is limited to four weeks due to zero mortality cases in some
selected countries, starting March 22 and continuing until April 12. The total number of deaths at
the end of each week is shown in the table (2):
Table (2): Coronavirus deaths in selected countries
Country/Region 3/22/2020 3/29/2020 4/5/2020 4/12/2020
Australia 7 16 35 60
Canada 21 64 259 714
China 3274 3304 3333 3343
Finland 1 11 28 56
France 674 2606 8078 14393
Germany 94 533 1584 3022
India 7 27 99 331
Italy 5476 10779 15887 19899
Japan 41 54 77 108
Korea, South 111 152 183 214
Malaysia 10 35 61 76
Philippines 25 71 152 297
Russia 1 8 45 130
Singapore 2 3 6 8
Spain 1772 6803 12641 17209
Sweden 21 110 401 899
Thailand 1 7 23 38
15Country/Region 3/22/2020 3/29/2020 4/5/2020 4/12/2020
United
Kingdom 281 1228 4934 10612
US 417 2467 9619 22020
Source: Johns Hopkins University (coronavirus resource center), 2020
Inputs: Undoubtedly, one of the factors influencing the number of coronavirus deaths is the way
countries operate in preventing the coronavirus spreading. Therefore, the countries’ inefficiency
in preventing the coronavirus spread, which is the result of the first model, was used as an input in
the second model. According to a study by (Jung et al., 2020) , which estimates the average time
from illness onset to death 20.2 days, the inefficiency of preventing coronavirus spread with
three time intervals has been used as an input in the second model.
The number of population, as well as the population aged 65 and above (% of total population) in
each country, are other inputs used in the second model.
Table (3): inputs statistical data in selected countries
Population
Age 65 and
Density (people
Country Population above (% of
per square
population)
kilometer)
Australia 24992369 3.2 15.7
Canada 37058856 4.1 17.2
China 1392730000 148.3 10.9
Finland 5518050 18.2 21.7
France 66987244 122.3 20.0
Germany 82927922 237.4 21.5
India 1352617328 454.9 6.2
Italy 60431283 205.5 22.8
16Population
Age 65 and
Density (people
Country Population above (% of
per square
population)
kilometer)
Japan 126529100 347.1 27.6
Korea 51635256 529.7 14.4
Malaysia 31528585 96.0 6.7
Philippine 106651922 357.7 5.1
Russia 144478050 8.8 14.7
Singapore 5638676 7953.0 11.5
Spain 46723749 93.5 19.4
Sweden 10183175 25.0 20.1
Thailand 69428524 135.9 11.9
UK 66488991 274.8 18.4
US 327167434 35.8 15.8
Source: World Bank, 2018
17Results and discussions
Inefficiency of preventing coronavirus spread
The study used a dynamic data envelopment analysis model within the Malmquist index to
calculate the inefficiency of preventing coronavirus spread of each country at the end of each week.
Based on the inefficiency trend, countries could be categorized in 5 groups as follows:
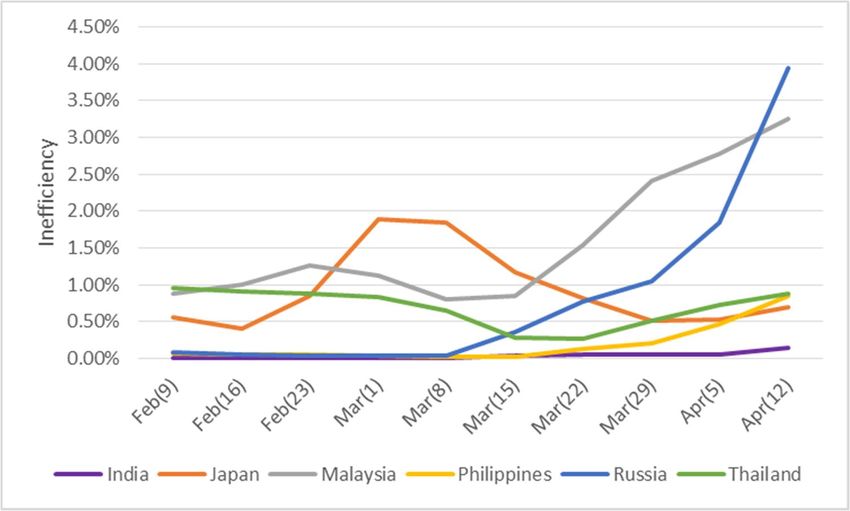
The first group includes countries whose inefficiency of preventing coronavirus spread is
declining. Australia, China, South Korea and Singapore fall into this category. However, Australia
has experienced low inefficiency compared to the other three countries from the beginning.
Changes in the inefficiency of these countries in different time periods are shown in the chart
below:
Figure 1. Inefficiency trend of preventing coronavirus spread in the first group
18The second group includes countries that experience very low inefficiency in preventing the spread
of the virus, but their inefficiency is increasing. India, Japan, Malaysia, the Philippines, Russia and
Thailand fall into this category. The chart below shows the changes in inefficiency over time:
Figure 2. Inefficiency trend of preventing coronavirus spread in the second group
The third group, which includes Finland, Sweden, and the United Kingdom, although relatively
inefficient in preventing coronavirus spread, has seen an increase in their inefficiency. The chart
below shows the trend of changes in inefficiency in this group of countries:
19Figure 3. Inefficiency trend of preventing coronavirus spread in the third group
The fourth group, which includes Canada, France and Germany, has lower-than-average
inefficiencies, but their inefficiencies are increasing. The process of changing their inefficiency
over time is shown in the chart below:
Figure 4. Inefficiency trend of preventing coronavirus spread in the fourth group
20The fifth group includes the United States, Italy and Spain, which, despite high inefficiency,
continue to see an increase in inefficiency. The chart below shows the trend of changing the
inefficiency of these countries during the period under review:
Figure 5. Inefficiency trend of preventing coronavirus spread in the fifth group
90.00%
80.00%
70.00%
60.00%
Inefficiency
50.00%
40.00%
30.00%
20.00%
10.00%
0.00%
Italy Spain US
In describing the spread prevention inefficiency, two groups of factors can be considered
important: First, the actions that governments take in facing this problem, and second the behavior
of the people in each country in response to government actions (regulations, recommendations or
campaigns). In general, these two factors could be classified into stringency and enforcement of
rules and regulations. Oxford University has developed a stringency index which includes 7 sub-
indices with different weights include school closing, workplace closing, public events
cancellation, closing public transport, public information campaigns, restrictions on internal
movement and international travel controls (Hale & Webster, 2020).
21To analyze the stringency degree of laws and regulations in each of the selected countries, we
categorized countries in the previous five groups. The question is whether countries with similar
Inefficiency of preventing coronavirus spread, have similar behavior in stringency of law and
regulations?
To answer this question, the trend of changing the stringency degree of laws and regulations in
each of the five groups is shown as below:
In the first group of countries (Australia, China, South Korea and Singapore) where inefficiency
has increased and then the downward trend has taken place, strict policies have been intensified
by all countries from one period to the next.
Figure 6. Stringency index trend in the first group
90
80
70
Stringency Index
60
50
40
30
20
10
0
Australia China South Korea Singapore
For the second group of countries (India, Japan, Malaysia, the Philippines, Russia and Thailand)
with the lowest levels of inefficiency, they have enacted stricter rules and regulations much faster
than other countries.
22Figure 7. Stringency index trend in the second group
120
100
Stringency Index
80
60
40
20
0
India Japan Malaysia Philippines Russia Thailand
Countries in the third (Finland, Sweden, and the United Kingdom), fourth (Canada, France and
Germany), and fifth (United States, Italy and Spain) groups, where inefficiency is on the rise, have
not usually tightened rules and regulations from the beginning and have delayed tightening with a
delay.
23Figure 8. Stringency index trend in the third group
100
90
80
70
Stringency Index
60
50
40
30
20
10
0
Finland Sweden United Kingdom
Figure 9. Stringency index trend in the fourth group
120
100
Stringency Index
80
60
40
20
0
Canada France Germany
24Figure 10. Stringency index trend in the fifth group
120
100
Stringency Index
80
60
40
20
0
Italy Spain United States
Regarding the behavioral analysis of involved people, the way people of each country respond to
these new government decisions depend of various factors and can be classified as behavioral
analysis. It reflects the enforcement degree of rules and regulations, which will be addressed in
our next research.
Inefficiency of preventing deaths caused by coronavirus
Due to data limitation, the countries' death prevention inefficiency is calculated in a 3 time period
(4-week data) as follows:
The first period is the week ending March 29, the second period is the week ending April 4 and
the third period is the week ending April 12.
According to the Inefficiency of preventing deaths caused by coronavirus calculation, countries
can be classified into 5 groups as follows:
25The first group, which includes South Korea and Russia, has low inefficiency compared to other
selected countries and has a declining inefficiency trend in the periods.
Figure 11. Inefficiency trend of preventing coronavirus deaths in the first group
The second group, which includes the three countries of China, India and the United States, has
experienced high inefficiency, but by the end of the period, their inefficiency has decreased.
Figure 12. Inefficiency trend of preventing coronavirus deaths in the second group
120.00%
100.00%
80.00%
Inefficiency
60.00%
40.00%
20.00%
0.00%
Mar(29) Apr(5) Apr(12)
China India US
26The third group includes France, Italy, Spain, the Philippines and the United Kingdom, whose
inefficiency is rising at higher levels than in other countries. However, for the Philippines, the
inefficiency trend is more than other countries, and Spain has had the highest level of inefficiency
among the selected countries in all three periods.
Figure 13. Inefficiency trend of preventing coronavirus deaths in the third group
120.00%
100.00%
80.00%
Inefficiency
60.00%
40.00%
20.00%
0.00%
Mar(29) Apr(5) Apr(12)
France Italy Philippines Spain United Kingdom
The fourth group includes Australia, Finland, Japan, Singapore, Malaysia, and Thailand. The
inefficiency of these countries is very low and there is little growth in their inefficiency. In this
group, Finland and Thailand have higher inefficiency growth than other countries in the same
group.
27Figure 14. Inefficiency trend of preventing coronavirus deaths in the fourth group
2.50%
2.00%
Inefficiency
1.50%
1.00%
0.50%
0.00%
Mar(29) Apr(5) Apr(12)
Australia Finland Japan
Malaysia Singapore Thailand
The fifth group includes Germany, Canada and Sweden, whose inefficiency is low but higher than
the fourth group and their inefficiency is increasing. In this group, Sweden has a higher
inefficiency growth rate than other two countries.
Figure 15. Inefficiency trend of preventing coronavirus deaths in the fifth group
14.00%
12.00%
10.00%
Inefficiency
8.00%
6.00%
4.00%
2.00%
0.00%
Mar(29) Apr(5) Apr(12)
Canada Germany Sweden
28When it comes to saving the patients already suffering from the disease, healthcare system with
its capabilities in particular is involved. It plays the key role in different stages of a pandemic, from
surveillance to controlling the disease and helping the patients recover from it. In 2018, the Joint
External Evaluation have indicated that many countries are not fully prepared for a possible
pandemic in the future (Gupta et al., 2018). Now that the world is battling against COVID-19,
even though each healthcare system indicates some level of inefficiency, the differences in the
capabilities of healthcare systems become vivid.
The selected countries in this study have different levels of death prevention inefficiency; ergo
different levels of capability in saving COVID-19 patients. As explained before, the previous
performance of the healthcare system, its strengths and weaknesses, all come together to describe
their current inefficiency in saving lives. Going back to see their performance in the past, a
comprehensive index is Global Health Security (GHS) index that compares 195 countries.(Johns
Hopkins Center for Health Security with NTI and the Economist Intelligence Unit, 2020) In its
overall score, GHS 2019 defines three main groups of most prepared, more prepared, and less
prepared countries. In addition to previous preparedness, a comparison between these groups in
the current situation is also needed to explain their different performance. The table (4) shows that
some of the most prepared countries based on GHS 2019 are now facing an increasing inefficiency
death prevention caused by the virus, while some other not ranked as most prepared have managed
to decrease this type of inefficiency. Also, the healthcare policies that are applied seem to be more
or less similar, as the majority of countries have decided to allocate additional funds to the
hospitals.
29Table (4): Healthcare policies comparison
Group Countries Current healthcare‐related policies GHS 2019
Tested over 14 000 people per day
South Korea Drive‐through testing and phone booth testing Most prepared
Group 1
was introduced
Russia Emergency hospitals set up by local authorities More prepared
Healthcare workers are exempt of personal
income tax
China Medical equipment are exempt from registration More prepared
fees
Supporting medicine‐related research
Hospitals deferred elective surgeries
Group 2
USD 2 billion allocated for treating COVID‐19
India More prepared
patients
Restrictions on diagnostic testing kits export
Allocated $3 billion on relevant research
US Cover costs of testing for all Americans Most prepared
home hospitalization and distance monitoring
Allocated financial support to the healthcare
system and equipment
France Postponing non‐urgent surgeries to free the Most prepared
facilities for COVID‐19 patients
Developing a military health service hospital
Funds allocated to healthcare system
Prioritizing COVID‐19 patients for using hospital
Italy facilities More prepared
Increased medical equipment and material
Encouraging retired medical personnel to work
Group 3 Relevant medical research are fee exempt
Allocated fund for covering healthcare
expenditure
Spain More prepared
Allocated funds to R&D
Government price intervention in medicines
Easing purchase of relevant medical goods
Philippines More prepared
‐
Allocated funds to National Health Service
UK Waived VAT tax on medical imports like Most prepared
ventilators and testing kits
Allocated funds to healthcare system
Prioritizing hospital equipment for the COVID‐19
Group 4 Australia patients Most prepared
Cancelling elective surgeries
Allocated funds to mental health services
30Group Countries Current healthcare‐related policies GHS 2019
Government partnership with private health
providers
Allocated funds to healthcare system
Finland restrictions on the sales of medical supply Most prepared
Allowing forced hospitalization
The government covering medical care costs
Japan More prepared
Allocating funds for increasing test capacity
Prioritizing medical service for vulnerable groups
Singapore ‐ More prepared
Malaysia ‐ More prepared
Thailand ‐ Most prepared
Allocated funds for needed equipment
Expand hospital capacities
Germany More prepared
Postponing elective treatments
Additional funds for health insurance
A boost to medical research funding
Group 5 Canada Most prepared
Increasing health spending transfers
Government prepared for extra costs in health
and medical care and allocating grants
Sweden Most prepared
Paying sickness benefit for the first day of
sickness
Source: OECD, 2020
As the table shows, a simple comparison is not sufficient to find out which policies and methods
are better than the others. Similar policies and mechanisms can lead to various outcomes in
different countries. What can be said for now is that in the absence of COVID-19 medicine, the
sooner the patients are diagnosed, the higher the chances are for the healthcare system to be able
to save them. So while the hardworking medical experts all around the world are trying to find the
proper medicine but have not yet achieved it, the role of other factors has to be tested to see which
ones would facilitate the diagnosis procedure and which ones would cause a delay in it. For
example, countries like Australia and US have been criticized for not being able to provide enough
testing kits in some regions (Tanne et al., 2020), which is understandable due to the high rate of
virus spread. But the factors such as medical shortage and the mechanisms that each country
31applies as a respond still have to be analyzed and evaluated. These are the factors that will be taken
into consideration in our next research.
Conclusion and Suggestions
According to the measurements, the inefficiency of preventing coronavirus spread and preventing
coronavirus deaths can provide a beneficial pattern to determine critical success factors in
benchmark countries. Paying attention to the policies in two groups of countries in this
benchmarking is useful; first countries with a stable low inefficiency in two dimensions and the
second countries that have managed to reduce inefficiency after a period of high inefficiency.
Also the capability of analyzing current situation needs various aspects, one of which is the
behavioral analysis of people involved. How the governments are handling COVID-19 can only
be comprehensively analyzed when we take into account how well they communicate with their
people. This means the way people perceive this reality and how their behavior is forming around
it is a necessity for future studies. Thus, we aim to take the next step toward a comprehensive
analysis by focusing on this aspect in our upcoming research.
The current analysis has taken one step towards finding the proper mechanisms that can help the
governments improve their performance regarding this pandemic. However, further research must
be conducted to find out which policy would work in which context. We hope to take this further,
and we encourage other researchers to do so as well.
32References
Acemoglu, D., Gallego, F. A., & Robinson, J. A. (2014). Institutions, human capital, and development. Annu.
Rev. Econ., 6(1), 875‐912.
Afonso, A., Schuknecht, L., & Tanzi, V. (2010). Public sector efficiency: evidence for new EU member states
and emerging markets. Applied Economics, 42(17), 2147‐2164.
Ahmed, S., Hasan, M. Z., MacLennan, M., Dorin, F., Ahmed, M. W., Hasan, M. M., . . . Khan, J. A. (2019).
Measuring the efficiency of health systems in Asia: a data envelopment analysis. BMJ open, 9(3),
e022155.
Arah, O. A., Westert, G. P., Hurst, J., & Klazinga, N. S. (2006). A conceptual framework for the OECD health
care quality indicators project. International Journal for Quality in Health Care, 18(suppl_1), 5‐13.
Asandului, L., Roman, M., & Fatulescu, P. (2014). The efficiency of healthcare systems in Europe: A data
envelopment analysis approach. Procedia Economics and Finance, 10, 261‐268.
Baldwin, R., & di Mauro, B. W. (2020). Economics in the Time of COVID‐19: l CEPR Press VoxEU. org.
Bardhan, P. (2020). The Chinese governance system: Its strengths and weaknesses in a comparative
development perspective. China Economic Review, 101430.
Barro, R. J., Ursúa, J. F., & Weng, J. (2020). The coronavirus and the great influenza pandemic: Lessons
from the “spanish flu” for the coronavirus’s potential effects on mortality and economic activity:
National Bureau of Economic Research.
Chen, L. C., Evans, T. G., & Cash, R. A. (1999). Health as a global public good. Global public goods, 284‐304.
Chen, Z., Fan, H., Cai, J., Li, Y., Wu, B., Hou, Y., . . . Xuan, W. (2020). High‐resolution computed tomography
manifestations of COVID‐19 infections in patients of different ages. European Journal of
Radiology, 108972.
Coelli, T. J., Rao, D. S. P., O'Donnell, C. J., & Battese, G. E. (2005). An introduction to efficiency and
productivity analysis: Springer Science & Business Media.
Cook, W. D., & Zhu, J. (2006). Modeling performance measurement: applications and implementation
issues in DEA (Vol. 566): Springer Science & Business Media.
Cooper, W. W., Seiford, L. M., & Zhu, J. (2011). Handbook on data envelopment analysis (Vol. 164):
Springer Science & Business Media.
Dacosta‐Claro, I., & Lapierre, S. D. (2003). Benchmarking as a tool for the improvement of health services'
supply departments. Health Services Management Research, 16(4), 211‐223.
Dayrit, M., & Mendoza, R. U. (2020). Social Cohesion vs COVID‐19. Available at SSRN 3555152.
33De Souza, A. A., Moreira, D. R., Avelar, E. A., de Faria Marques, A. M., & Lara, A. L. (2014). Data
envelopment analysis of efficiency in hospital organisations. International Journal of Business
Innovation and Research, 8(3), 316‐332.
Dowd, J. B., Rotondi, V., Adriano, L., Brazel, D. M., Block, P., Ding, X., . . . Mills, M. C. (2020). Demographic
science aids in understanding the spread and fatality rates of COVID‐19. medRxiv.
Emrouznejad, A., & Podinovski, V. (2004). Data envelopment analysis and performance management (Vol.
421): Aston Business School, Aston University Birmingham.
Fadlallah, R., Alkhaled, L., Brax, H., Nasser, M., Rajabbik, M. H., Nass, H., . . . Akl, E. A. (2018). Extent of
physician–pharmaceutical industry interactions in low‐and middle‐income countries: a systematic
review. The European Journal of Public Health, 28(2), 224‐230.
Fried, H. O., Lovell, C. K., Schmidt, S. S., & Schmidt, S. S. (2008). The measurement of productive efficiency
and productivity growth: Oxford University Press.
Gaeta, G. (2020). Data analysis for the COVID‐19 early dynamics in Northern Italy. arXiv preprint
arXiv:2003.02062.
Galterio, L., Helton, J., Langabeer 2nd, J., & DelliFraine, J. (2009). Data envelopment analysis: performance
normalization and benchmarking in healthcare. Journal of healthcare information management:
JHIM, 23(3), 38‐43.
Gostin, L. O., Friedman, E. A., & Wetter, S. A. (2020). Responding to COVID‐19: How to Navigate a Public
Health Emergency Legally and Ethically. Hastings Center Report.
Gupta, V., Kraemer, J. D., Katz, R., Jha, A. K., Kerry, V. B., Sane, J., . . . Salminen, M. O. (2018). Analysis of
results from the joint external evaluation: examining its strength and assessing for trends among
participating countries. Journal of global health, 8(2).
Hale, T., & Webster, S. (2020). Oxford COVID‐19 Government Response Tracker. URL https://www. bsg.
ox. ac. uk/research/research-projects/oxford-covid-19-government-response-tracke r [accessed
26 March 2020].
Hauner, D., & Kyobe, A. (2010). Determinants of government efficiency. World Development, 38(11),
1527‐1542.
Haushofer, J., & Metcalf, J. (2020). Combining behavioral economics and infectious disease epidemiology
to mitigate the COVID‐19 outbreak: Working Paper, Princeton University.
Johns Hopkins Center for Health Security and NTI and the Economist Intelligence Unit. (2020). Global
health security Index. Retrieved from: https://www.ghsindex.org/news/inaugural‐global‐health‐
security‐index‐finds‐no‐country‐is‐prepared‐for‐epidemics‐or‐pandemics/
Jung, S.‐m., Akhmetzhanov, A. R., Hayashi, K., Linton, N. M., Yang, Y., Yuan, B., . . . Nishiura, H. (2020).
Real‐time estimation of the risk of death from novel coronavirus (COVID‐19) infection: Inference
using exported cases. Journal of clinical medicine, 9(2), 523.
34Kuo, R. N., & Lai, M.‐S. (2013). The influence of socio‐economic status and multimorbidity patterns on
healthcare costs: a six‐year follow‐up under a universal healthcare system. International journal
for equity in health, 12(1), 69.
Liu, K., Chen, Y., Lin, R., & Han, K. (2020). Clinical features of COVID‐19 in elderly patients: A comparison
with young and middle‐aged patients. Journal of Infection.
Mantri, J. K. (2008). Research methodology on data envelopment analysis (DEA): Universal‐Publishers.
McKibbin, W. J., & Fernando, R. (2020). The global macroeconomic impacts of COVID‐19: Seven scenarios.
McKibbin, W. J., & Sidorenko, A. (2006). Global macroeconomic consequences of pandemic influenza:
Lowy Institute for International Policy Sydney, Australia.
Miller, M., Toffolutti, V., & Reeves, A. (2018). The enduring influence of institutions on universal health
coverage: An empirical investigation of 62 former colonies. World Development, 111, 270‐287.
OECD . (2020). Country policy tracker. Rerieved from: https://www.oecd.org/coronavirus/en/
Ozcan, Y. A. (2008). Health care benchmarking and performance evaluation: Springer.
Peacock, S., Chan, C., Mangolini, M., & Johansen, D. (2001). Techniques for measuring efficiency in health
services. Productivity Commission: Staff Working Paper.
Platform, G. G. K. (2015). Measuring environmental action and economic performance in developing
countries.
Pulina, M., Detotto, C., & Paba, A. (2010). An investigation into the relationship between size and
efficiency of the Italian hospitality sector: A window DEA approach. European journal of
operational research, 204(3), 613‐620.
Rashford, M. (2007). A universal healthcare system: is it right for the United States? Paper presented at
the Nursing Forum.
Remuzzi, A., & Remuzzi, G. (2020). COVID‐19 and Italy: what next? The Lancet.
Shim, E., Tariq, A., Choi, W., Lee, Y., & Chowell, G. (2020). Transmission potential and severity of COVID‐
19 in South Korea. International Journal of Infectious Diseases.
Singh, R., & Adhikari, R. (2020). Age‐structured impact of social distancing on the COVID‐19 epidemic in
India. arXiv preprint arXiv:2003.12055.
Smith, N., & Fraser, M. (2020). Straining the system: novel coronavirus (COVID‐19) and preparedness for
concomitant disasters: American Public Health Association.
35Sohrabi, C., Alsafi, Z., O’Neill, N., Khan, M., Kerwan, A., Al‐Jabir, A., . . . Agha, R. (2020). World Health
Organization declares global emergency: A review of the 2019 novel coronavirus (COVID‐19).
International Journal of Surgery.
Stefko, R., Gavurova, B., & Kocisova, K. (2018). Healthcare efficiency assessment using DEA analysis in the
Slovak Republic. Health economics review, 8(1), 6.
Tanne, J. H., Hayasaki, E., Zastrow, M., Pulla, P., Smith, P., & Rada, A. G. (2020). Covid‐19: how doctors and
healthcare systems are tackling coronavirus worldwide. Bmj, 368.
Thanassoulis, E., Portela, M. C., & Despic, O. (2008). Data envelopment analysis: the mathematical
programming approach to efficiency analysis. The measurement of productive efficiency and
productivity growth, 251‐420.
Verity, R., Okell, L. C., Dorigatti, I., Winskill, P., Whittaker, C., Imai, N., . . . Fu, H. (2020). Estimates of the
severity of coronavirus disease 2019: a model‐based analysis. The Lancet Infectious Diseases.
Wilder‐Smith, A., & Freedman, D. (2020). Isolation, quarantine, social distancing and community
containment: pivotal role for old‐style public health measures in the novel coronavirus (2019‐
nCoV) outbreak. Journal of travel medicine, 27(2), taaa020.
Woolcock, M. (2018). Enhancing public health outcomes in developing countries: From good policies and
best practices to better implementation. Scandinavian journal of public health, 46(22_suppl), 10‐
18.
Xie, Q., Wang, J., You, J., Zhu, S., Zhou, R., Tian, Z., . . . Xiao, L. (2020). Effect of large‐scale testing platform
in prevention and control of the COVID‐19 pandemic: an empirical study with a novel numerical
model. medRxiv.
Yazbeck, A. S., & Soucat, A. (2019). When both markets and governments fail health. Health Systems &
Reform, 5(4), 268‐279.
Zhou, F., Yu, T., Du, R., Fan, G., Liu, Y., Liu, Z., . . . Gu, X. (2020). Clinical course and risk factors for mortality
of adult inpatients with COVID‐19 in Wuhan, China: a retrospective cohort study. The Lancet.
36You can also read