Defining a historic football team: Using Network Science to analyze Guardiola's F.C. Barcelona
←
→
Page content transcription
If your browser does not render page correctly, please read the page content below
www.nature.com/scientificreports

                        OPEN       Defining a historic football team:
                                   Using Network Science to analyze
                                   Guardiola’s F.C. Barcelona
Received: 30 May 2019              J. M. Buldú1,2,3, J. Busquets4, I. Echegoyen1,2 & F. Seirul.lo5
Accepted: 3 September 2019
Published: xx xx xxxx              The application of Network Science to social systems has introduced new methodologies to analyze
                                   classical problems such as the emergence of epidemics, the arousal of cooperation between individuals
                                   or the propagation of information along social networks. More recently, the organization of football
                                   teams and their performance have been unveiled using metrics coming from Network Science,
                                   where a team is considered as a complex network whose nodes (i.e., players) interact with the aim of
                                   overcoming the opponent network. Here, we combine the use of different network metrics to extract
                                   the particular signature of the F.C. Barcelona coached by Guardiola, which has been considered one of
                                   the best teams along football history. We have first compared the network organization of Guardiola’s
                                   team with their opponents along one season of the Spanish national league, identifying those metrics
                                   with statistically significant differences and relating them with the Guardiola’s game. Next, we have
                                   focused on the temporal nature of football passing networks and calculated the evolution of all network
                                   properties along a match, instead of considering their average. In this way, we are able to identify those
                                   network metrics that enhance the probability of scoring/receiving a goal, showing that not all teams
                                   behave in the same way and how the organization Guardiola’s F.C. Barcelona is different from the rest,
                                   including its clustering coefficient, shortest-path length, largest eigenvalue of the adjacency matrix,
                                   algebraic connectivity and centrality distribution.

                                   Social systems have been one of the fields that has benefited the most from the wide variety of methodologies
                                   comprised under the umbrella of Network Science1–5. Using such an approach, it is possible (i) to identify the
                                   most influential individuals of a social network6–11, (ii) to detect the existence of communities of people and the
                                   common interests that tie them more tightly than individuals in other communities12–14, (iii) to explain the prop-
                                   agation of rumors/diseases15–18 or (iv) to analyze the bursting activity of individuals when communicating with
                                   others19, just to cite a few examples. Furthermore, the areas of application and systems under study are as diverse
                                   as (i) on-line social networks (e.g., Facebook or Twitter)20–25, (ii) interactions between companies and sharehold-
                                   ers26,27, (iii) crime networks28, (iv) collaborations between scientists1,11, or (v) scaling laws in cities29.
                                       From the diversity of applications of Network Science, here we are concerned about the analysis of football
                                   matches and, specifically, the way players interact with each other by passing the ball, ultimately creating what is
                                   known as a football passing network. Passing networks are constructed from the observation of the ball exchange
                                   between players, where network nodes (or vertices) are football players and links (or edges) account for the num-
                                   ber of passes between any two players of a team. This way, we can construct football passing networks, weighted
                                   and unidirectional, which in turn are spatially embedded30–32 (see Methods for an example about how passing
                                   networks are built). The seminal paper by Gould and Gatrell33, published in the late seventies, introduced the
                                   concept of passing networks associated to a football match. However, it did not obtain the relevance it deserved,
                                   both in the scientific and sports communities. More than thirty years later, the work of Duch and collaborators34
                                   marked the start of a decade that is witnessing how the analysis of passing networks (by means of Network
                                   Science) is unveiling crucial information about the organization, evolution and performance of football teams
                                   and players30.

                                   1
                                    Complex System Group & GISC, Universidad Rey Juan Carlos, Madrid, Spain. 2Laboratory of Biological Networks,
                                   Center for Biomedical Technology, Universidad Politécnica de Madrid, Madrid, Spain. 3Institute of Unmanned System
                                   and Center for OPTical IMagery Analysis and Learning (OPTIMAL), Northwestern Polytechnical University, Xi’an,
                                   710072, China. 4ESADE Business School, Barcelona, Spain. 5Departamento de Metodología, F.C. Barcelona, Barcelona,
                                   Spain. Correspondence and requests for materials should be addressed to J.M.B. (email: jmbuldu@gmail.com)

        Scientific Reports |   (2019) 9:13602 | https://doi.org/10.1038/s41598-019-49969-2                                                           1
www.nature.com/scientificreports/                                                                www.nature.com/scientificreports

                               For example, inspecting the organization of passing networks, it is possible to detect recurring pass sequences
                           and relate them to the playing style of a team35. Passing networks, taken as whole, exhibit a small-world topol-
                           ogy36, typically with high clustering coefficient (i.e., a tendency to create triangles of passes between three players)
                           when compared to a random null model37, and where the number of steps to go from one node to any other is
                           much lower than the number of nodes of the network38. It is also possible to detect the existence of motifs39, con-
                           sisting in the overabundance of certain kinds of passes between groups of three/four players40 or even communi-
                           ties of players tightly connected between them41. When the focus is placed at the player level, we can use network
                           motifs to characterize the role of a player in a team or even to find players (in other teams) with similar features42.
                           Furthermore, importance of players in a passing network can be quantified using the betweenness or closeness
                           parameters, which show that passing networks are prone to find a balance between all players43.
                               Taking advantage of this new point of view that Network Science can give to the analysis of football data-
                           sets, we are going to analyze the particular organization of F.C. Barcelona (FCB) during the supervision of Pep
                           Guardiola, considered as the referent team during the last decade44. Going back in time, modern football was
                           invented in England and we can trace its rules back to 1863. In the beginning, team strategy consisted in moving
                           forward the fastest and getting rid of the ball as soon as possible: having the ball, specially close to your goal, was
                           seen as something “dangerous”. Teams were originally organized in a “static” manner with clear and specialized
                           roles of defenders, midfielders and forwards. In the 1950s, the Hungarian national team started to consider the
                           ball as ‘not dangerous’ and organized the game around it. This led to a more dynamic approach in the 1970s, giv-
                           ing birth to a new game system played by AFC Ajax, and the Dutch national team, which was called “total football”
                           (totaalvoetbal in Dutch). Rinus Michels and Johan Cruyff were responsible for this new style. Its development in
                           F.C. Barcelona gradually appeared when Michels served as the club’s manager/coach (1971–1975 and 1976–1978)
                           followed by others such as Johan Cruyff (1988–1996) and, definitively, Frank Rijkaard (2003–2008) and Pep
                           Guardiola (2008–2012)45,46. The style of the Spanish national team (2008–2012) was also similarly influenced.
                               The tactical ability of Guardiola, which relied on a sophisticated combination of possession and pressing that,
                           in turn, were synchronized to the positional play of the team, leaded to the most fruitful period of F.C. Barcelona,
                           both in reputation and in the number of titles achieved, including 14 titles during 4 seasons. In a more general
                           framework, Guardiola was not the first coach who focused on pressing and possession or any of the other princi-
                           ples that, as he admitted, were extracted from the philosophy of his former coach Johan Cruyff46.
                               Despite there exists a vast literature about the particular features of Guardiola’s teams47–49, quantitative analy-
                           ses of their game style are still scarce. With the aim of supporting the evidence with numbers, we are going to use
                           Network Science to provide a different perspective of FCB style of playing, a perspective focused on the organiza-
                           tion of FCB passing networks and their differences with the rest of the teams paying in the Spanish national
                           league. We are going to focus on the season 2009/2010, probably the most fruitful season of Guardiola’s period,
                           achieving the titles of six major competitions (Spain’s Super Cup, UEFA Super Cup, FIFA Club World Cup, King’s
                           Cup, La Liga, and the UEFA Champions League). First, we will obtain the passing networks corresponding to the
                           380 matches of “La Liga” national league during the 2009/2010 season. Next, we will analyze the differences
                           between Guardiola’s team and the rest of Spanish teams, identifying similarities and differences at the network
                           parameters and linking them with the particularities of Guardiola’s principles. At this point, we will discuss the
                           influence of the temporal fluctuations of the network parameters along a match and will propose a temporal anal-
                           ysis of passing networks. With this aim, we will introduce the concept of 50-pass networks and recalculate all
                           network parameters at different moments of the match, giving special attention to scored/received goals. When
                           time is taken into account, our results show that (i) passing networks unveil additional information not contained
                           in the average network and, in addition, (ii) temporal analysis highlights some of the particular features of
                           Guardiola’s game.

                           Results
                           Average passing networks. Figure 1 shows an example of a football passing network, in this case the aver-
                           age network of FCB against Real Madrid in the season 2009/2010. Note that links are unidirectional (from player
                           A to player B) and weighted according to the number of passes between players. In the figure, nodes (i.e., players)
                           are placed in the average position from where their passes were made and the width of the links is proportional to
                           the number of passes between players. Also note that both the x and y coordinates of the field are bounded
                           between [0,100] and are measured in “field units” (f.u.), since not all fields have exactly the same dimensions.
                           Finally, the radius of the nodes is proportional to their importance in the passing network, quantified by means of
                           the eigenvector centrality (see Methods).
                               First, we analyzed the average passing networks of all matches played by FCB during season 2009/2010 (38 in
                           total), obtaining the networks of FCB and their rivals. Specifically, we obtain 2 average passing networks for each
                           match (1 per team), both of them including all passes and positions along the match and projecting them into a
                           single network for each team. See the Methods section for details about the construction of average passing net-
                           works. Previous literature about average passing networks has shown that they reveal information about the way
                           a team is organized50 and are also related with team performance51.
                               Figure 2 shows the comparison between 8 different parameters obtained for FCB and its rivals. Four of them,
                           (a) the number of passes L, (b) the number of shots to goal Mshots , (c) the number of goals Mgoals and (d) the num-
                           ber of points Mpoints (at the end of the season) are classical metrics of the team performance. Note that, in order to
                           compute these 4 variables, there is no need to obtain and analyze the network structure of each team, despite
                           some of them (i.e., the number of passes) can affect the organization of the passing networks. The other 4 param-
                           eters of Fig. 2 are related to the spatial properties of the networks: (e) x -coordinate of the network centroid ⟨X⟩,
                           (f) y-coordinate of the network centroid ⟨Y⟩, (g) dispersion of the position of the players around the network
                           centroid NCdisp and (h) average ratio between the passing distance parallel and perpendicular to the opponent’s

Scientific Reports |   (2019) 9:13602 | https://doi.org/10.1038/s41598-019-49969-2                                                               2
www.nature.com/scientificreports/ www.nature.com/scientificreports
(0.0,100.0) (100.0,100.0)
Abidal
Keita Henry
Iniesta
Busquets
Puyol
Messi
Xavi
Alves
y (0.0,0.0) (100.0,0.0)
x
Figure 1. Schematic illustration of a football passing network. In the plot, players are represented by circular
nodes, whose size is proportional to their eigenvector centrality, a mesure of importance in the network
structure. The position of each player is given by the average of the positions of all passes made by the player
along the match. The width of the links is proportional to their weights, which account for the number of passes
between players. Note that links are unidirectional. In this example, we plot the average passing network of
the match between F.C. Barcelona and Real Madrid, played during the season 2009/2010 at Santiago Bernabeu
Stadium. Datasets leading to the passing network were provided by Opta.
goal ⟨Δy⟩/⟨Δx⟩ (see Methods for details). Left bars in all plots correspond to the average values of these metrics
for all matches of FCB along the season, while right bars are the same metrics obtained for the rivals at the same
matches. FCB is always averaged with itself, while all other teams are averaged together, the reason being that we
are only interested in observing differences between the FCB and all other teams. Error bars account for the
standard deviations of each metric. Plots in yellow highlight statistically significant differences (see Methods for
details about the statistical analysis).
As we can see in Fig. 2A, the number of passes made by FCB is much higher than the average of their rivals.
This fact is a consequence of Guardiola’s playing style, focused on keeping the ball as much as possible (“In foot-
ball, I am very selfish: I want the ball for me”, “take the ball, pass the ball”52). The high number of passes una-
voidably leads to passing networks with links that have higher weights and, as we will see, this fact will have
consequences on the network parameters. The number of shots to goal is also higher in FCB (Fig. 2B), leading to
a higher number of goals (Fig. 2C) and, ultimately to a high number of points accumulated during the analyzed
matches (Fig. 2D). In fact, FCB won the league with 99 points (31 wins, 6 ties and only 1 loss). Note that these four
metrics (passes, shots, goals and points), specially the last three, are traditionally considered as indicators of the
team performance, thus revealing that FCB was the best team during season 2009/2010.
Bottom plots of Fig. 2 are related with the spatial features of Guardiola’s team. The ⟨X⟩ and ⟨Y⟩ average coor-
dinates of all passes made during the match define the network centroid (or the network center of mass). We can
observe in Fig. 2E how FCB played closer to the opponents goal (⟨X⟩FCB > ⟨X⟩rivals), while no differences are found
at the ⟨Y⟩ coordinate (Fig. 2F), indicating no preference for any of the sides of the pitch. Interestingly, the disper-
sion of the position of the players around the centroid (see Methods) is slightly higher for FCB, which indicates
that the area covered by the initial position of the passes made by all players is wider (Fig. 2G). Finally, it is worth
analyzing the ratio of advance ⟨Δy⟩/⟨Δx⟩, which is an indicator of the direction of the passes of a team, since the
Δy = y2 − y1 of a pass is the difference between the y-coordinates at the final (y2) and initial points (y1) of a pass,
while Δx is defined, accordingly, for the x-coordinate. In Fig. 2H, we can observe how FCB has a ratio of advance
much higher than the rivals, which reveals that passes are more parallel to the opponent’s goal than the rest of the
teams. Note that this metric is independent from the number of passes, and it is an indicator of how “direct” the
game of a team is. Clearly, FCB is not concerned about advancing directly towards the goal, but on moving the
ball in parallel, probably to find the most adequate moment to advance.
But, how is the structure of the average passing networks? And, more importantly, are there differences
between FCB and the rest of the teams? Figure 3 shows the comparison of 6 parameters directly related with
the topological organization of the average passing networks (see Methods for a detailed description of all these
network parameters). In Fig. 3A, we plot the clustering coefficient C, which is related to the amount of triangles
created between any triplet of players. Clustering coefficient is an indicator of the local robustness of networks31,
since when a triangle connecting three nodes (i.e. players) exists, and a link (i.e., pass) between two nodes is lost
(i.e., not possible to make the pass), there is an alternative way of reaching the other node passing through the
other two edges of the triangle. In football, the clustering coefficient mesures the triangulation between three play-
ers. As we can observe in Fig. 3A the value of C is much higher in FCB, which reveals that connections between
Scientific Reports | (2019) 9:13602 | https://doi.org/10.1038/s41598-019-49969-2 3www.nature.com/scientificreports/ www.nature.com/scientificreports
Figure 2. Comparison of 8 classical football metrics. In all plots, left bars are the average (during the whole
season) of a given metric for FCB, while right bars correspond to the average of the rivals in the matches played
against FCB. Metrics are, specifically: (A) number of passes, (B) number of shots, (C) number of goals, (D)
number of points at the end of the season, (E) x-coordinate of the network centroid ⟨X⟩, (F) y-coordinate of the
network centroid ⟨Y⟩, (G) the spatial dispersion (in field units) of the players around the network centroid and
(H) the advance ratio ⟨Δy⟩/⟨Δx⟩, obtained as the ratio between the total length ⟨Δy⟩ of the y-coordinate of all
passes divided by the total length ⟨Δx⟩ of the x-coordinate, both distances in field units. Direction x is towards
the goal, while direction y is parallel to the opponents goal (see axis of Fig. 1). Parameters having statistically
significant differences between FCB and their rivals are plotted in yellow.
three players are more abundant than at their rivals. The average shortest path d is an indicator about how well
connected are players inside a team. It measures the “topological distance” that the ball must go through to con-
nect any two players of the team. Since the links of the passing networks are weighted with the number of passes,
the topological distance of a given link is defined as the inverse of the number of passes. The higher the number of
passes between two players, the closer (i.e., lower) the topological distance between them is. Furthermore, since
it is the ball that travels from one player to any other, it is possible to find the shortest path between any pair of
players by computing the shortest topological distance between them, no matter if it is a direct connection or if it
involves passing through other players of the team. Finally, the average shortest path d of a team is just the average
of the shortest path between all pairs of players. As we can observe in Fig. 3B, the shortest path of FCB is much
lower than their rivals, which reveals that players are better connected between them. As we will discuss later,
note that this fact could be produced by the network organization or just being a consequence of having a higher
number of passes, which reduces the overall topological distance of the links and, consequently, the value of d.
Figure 3C shows the comparison between the largest eigenvalue λ1 of the connectivity matrix A (also known
as the weighted adjacency matrix), whose elements aij contain the number of passes between players i and j31. The
largest eigenvalue has been used as a quantifier of the network strength53, since it increases with the number of
nodes and links (see Methods). As expected (due to the high number of passes), the largest eigenvalue λ1 of FCB
is much higher than the corresponding values of its rivals. This metric reveals the higher robustness of the passing
network of Guardiola’s team, which indicates that an eventual loss of passes would have less consequences in F.C.
Barcelona than in the rest of the teams.
It is also worth analyzing the behavior of the second smallest eigenvalue λ2 of the Laplacian matrix L , also
known as the algebraic connectivity (see Methods). The value of λ2 is related to several network properties. In
synchronization, networks with higher λ2 require less time to synchronize54 and in diffusion processes, the time
to reach equilibrium also goes with the inverse of λ2. In the context of football passing networks, λ2 can be inter-
preted as a metric for quantifying the division of a team. The reason is that low values of λ2 indicate that a network
is close to be split into two groups, eventually breaking for λ2 = 0. In this way, the higher the value of λ2 the more
interconnected the team is, being a measure of structural cohesion. In Fig. 3D, we have plot the comparison of λ2,
which reveals that FCB attacking and defensive lines are more intermingled, leading to a λ2 higher than its rivals.
Scientific Reports | (2019) 9:13602 | https://doi.org/10.1038/s41598-019-49969-2 4www.nature.com/scientificreports/ www.nature.com/scientificreports
Figure 3. Comparison of 6 network parameters. In all plots, left bars are the average (during the whole season)
of a given parameter for FCB, while right bars correspond to the average of the rivals in the matches played
against FCB. Parameters are, specifically: (A) clustering coefficient C, (B) shortest-path length d, (C) largest
eigenvalue λ1 of the connectivity matrix A, (D) algebraic connectivity λ2 of the Laplacian matrix L, (E)
dispersion of the players’ centrality and (F) maximum player centrality. See Methods section for details about
the explanation (and calculation) of all network parameters. Parameters having statistically significant
differences between FCB and their rivals are plotted in yellow.
Finally, Fig. 3E-F show how centrality (i.e., the importance of the players inside the passing network) is dis-
tributed along the team, a metric calculated by means of the eigenvector related to the largest eigenvalue of the
connectivity matrix (see Methods). Figure 3E contains the average dispersion of centrality and Fig. 3F shows the
highest value of a single player. In both cases, differences are not statistically significant to support evidences of a
different centrality distribution between FCB and the rest of the teams.
Temporal evolution of the network metrics. As we have seen in the previous Section, average passing
networks show differences between the organization of FCB and its rivals. However, these difference may be
interpreted as a consequence of the higher number of passes between Barcelona players, which could lead to sta-
tistically significant differences in a diversity of network metrics, namely, a reduction of the average shortest path
d and an increase of the clustering coefficient C, largest eigenvalue λ1 and algebraic connectivity λ2.
In view of these results, two questions must be addressed before any interpretation: (i) Is just the number of
passes behind the differences of the network parameters? and (ii) is it enough to look at the average values of the
network metrics? To address both issues, we have conducted a complementary study where passing networks are
constructed in a different way. On the one hand, we are going to define passing networks as non-static entities,
thus evolving in time, and we will track the evolution of their parameters. On the other hand, we are going to
exclude the importance of the number of passes, in order to just focus on the topological organization of the net-
works. With these two objectives in mind, we construct the l−pass networks of a team as the networks containing
l consecutive passes, with l ≪ L, being L the total number of passes during the match. In our study, we set l = 50,
since it is a value low enough to allow a tracking of the network evolution along the match and, at the same time,
high enough to guarantee the creation of a network between players (too low values of l would lead to networks
with disconnected components). Therefore, we obtain the 50-pass networks in the following way: (i) we construct
the network of the first 50 passes of a team since the beginning of the match, (ii) we calculate its parameters, (iii)
we dismiss the oldest pass and include (sequentially) a new one, (iv) we recalculate the network parameters and
(v) we repeat the procedure until the last pass of the match is included.
Note that 50-pass networks contain exactly the same number of passes for both teams and, thus, any difference
between network metrics can not be attributed to the total number of passes. In addition, also note that metrics
evolve in time and their values can be related to a certain moment of the match. However, it is also important to
remark that the time required to construct a 50-pass network can differ from team to team.
Scientific Reports | (2019) 9:13602 | https://doi.org/10.1038/s41598-019-49969-2 5www.nature.com/scientificreports/ www.nature.com/scientificreports
Figure 4. Real Madrid (red lines) vs. F.C. Barcelona (green lines), season 2009/2010 (final result: 0−2).
Temporal evolution of the network parameters: (A) ⟨X⟩ coordinate of the networks’ centroid, (B) ratio of
advance ⟨Δy⟩/⟨Δx⟩ and (C) the centrality dispersion ECdisp. Vertical dashed lines indicate the two moments at
which FCB scored a goal (Real Madrid did not score).
Figure 4 shows an example of the evolution of 3 parameters of the 50-pass networks of two teams along a
match, specifically, the ⟨X⟩ coordinate of the centroid (A), the ratio of advance ⟨Δy⟩/⟨Δx⟩ (B), and the dispersion
of the network centrality (C). Parameters are calculated, for both teams, during the match between Real Madrid
(red lines) and FCB (green lines), whose final score was 0–2. Vertical lines indicate the moment at which a goal
was scored. Figure 4A shows how the position of the team moves forward and backward during the match. In this
particular case, Real Madrid plays, most of the time, more advanced than FCB, which did not lead to an advantage
in the result. Note how the centroid of FCB seems to be more stable, while Real Madrid has higher fluctuations,
arriving to its maximum value around minute 63. Also note how FCB is the first team to construct the 50-pass
network around minute 9, while Real Madrid required 20 minutes.
In Fig. 4B, we plot the ratio of advance of the 50-pass networks of both teams. Again we can see fluctuations of
the parameter during the match. Specifically, FCB has a highest value during the first part of the match. However,
we can observe how Real Madrid increases its advance ratio as time goes by, eventually overcoming FCB during
the second half.
Finally, Fig. 4C shows the fluctuations of the centrality dispersion of the players of both teams. We can observe
how Real Madrid has a strong increase of the centrality dispersion between minutes 50 and 70, which seems to be
related with the period where the centroid of the team advances towards FCB’s goal (see Fig. 4A). This change of the
centrality distribution could be related to a change of the style of playing. Since centrality dispersion increases, there
is a higher heterogeneity in the importance of the players in the passing networks, which could be related to the fact
that a few players are taking the lead of the team. However, this change in the organization of the passing network
does not seem to be effective, since the second goal of FCB comes around to the maximum of centrality dispersion.
The fact that network metrics change during the match increases the complexity of the study. It is expected that
several factors may influence the fluctuations of the network parameters (a goal, a substitution, physical condition,
etc…) and, furthermore, not all teams may behave in the same way. From the diversity of factors, here we are going
to focus on the particular organization of each team before a goal. With this aim, we have analyzed the value of the
network parameters, for all teams, before scoring/receiving a goal. Our purpose is to detect the existence of differ-
ences in the network metrics and identify those parameters that change before scoring or receiving a goal.
Figure 5 shows the average values of 4 temporal and spatial metrics obtained before scoring/receiving a goal
(during season 2009/2010). The diagonal line (y = x) helps to identify those metrics that behave differently when
scoring or receiving a goal. In Fig. 5A we can observe how FCB is the team requiring less time to construct
the 50-pass network, both when scoring or receiving a goal. In fact, as indicated by the diagonal line, it takes
approximately the same time in both cases. On the opposite side, we find Athletic Club and Osasuna, both teams
characterized by a direct game towards the opponents’s goal. Concerning the ⟨X⟩ position of the centroid, we can
observe in Fig. 5B that, despite having a high value, FCB is not the team that constructs its network closest to the
Scientific Reports | (2019) 9:13602 | https://doi.org/10.1038/s41598-019-49969-2 6www.nature.com/scientificreports/ www.nature.com/scientificreports
1:Real Madrid
3:Athletic Club
4:Espanyol
5:Mallorca
6:Xerez
7:Osasuna
8:Villarreal
9:Real Zaragoza
10:Tenerife
11:Valencia CF
12:Sevilla
14:Real Valladolid
15:Barcelona
17:Racing de
Santander
18:Getafe
Figure 5. Temporal and spatial metrics change before scoring/receiving a goal: (A) time required to construct
a 50-pass network tnet, (B) position of the X coordinate of the 50-pass network centroid, (C) ⟨Δy⟩/⟨Δx⟩ advance
ratio and (D) dispersion of the distance of the players with regard to the centroid. Metrics are obtained for all
teams and are shown in a two-dimensional plot, where the horizontal axis corresponds to the value of a metric
when the team receives a goal and the vertical axis is the same metric obtained when the team scores a goal.
Solid lines correspond to the function y = x, helping to identify wether a given parameter increases or decreases
when a goal is scored/received. Each point represents the average along the whole season.
opponent’s goal, since it is overcome by Real Madrid and Tenerife. Note that Tenerife ended up the season in the
last position, which indicates that playing forward it is not a sufficient condition to achieve good results. However,
it is also worth noting that all teams, with the only exception of Osasuna, are placed above the line given by the
function ⟨X⟩scored = ⟨X⟩received. This fact reveals that when a team scores a goal is, in average, playing more advanced
than when it receives it. In Fig. 5C we have compared the ratio of advance ⟨Δy⟩/⟨Δx⟩ of all teams, showing that
Barcelona is not only the team with the highest value (both when scoring and receiving a goal) but also the one
deviated the most from the the diagonal line. In this way, FCB is the team that increases the most its probability of
scoring a goal when increasing the ratio of advance. Finally, Fig. 5D shows the average dispersion of the position
of the players around the centroid coordinates of the 50-pass network. Interestingly, we can observe how FCB
is one of the teams with lower dispersion of La Liga and, furthermore, the dispersion increases before a goal is
received, indicating that FCB performs better when players are closer to the network centroid.
Figure 6 shows, in a similar way, the values of 6 different network parameters obtained for all teams (during
the whole season). Interestingly, FCB has the highest values of the league at 4 of them: The clustering coefficient
(Fig. 6A), the largest eigenvalue of the connectivity matrix (Fig. 6C), the centrality dispersion (Fig. 6E) and the
highest centrality of a player (Fig. 6F). High values of these four metrics are related to strong and robust networks:
(i) a high clustering coefficient is an indicator of local robustness31,38, (ii) the largest eigenvalue λ1 is also an indi-
cator of global robustness53; when the number of nodes and links are the same, λ1 increases when important play-
ers are, in turn, connected between them, (iii) a high centrality dispersion together with a high value of maximum
centrality are indicators of heterogeneity in the network structure, and heterogeneous networks are know to have
strong resilience against random failures55 (i.e., the loss of weight of the links, due to lost passes, would have less
impact on the overall structure).
At the same time, the analysis shows low values at other 2 metrics: the shortest-path length d (Fig. 6B) and the
algebraic connectivity λ2 (Fig. 6D). In this case, having a low shortest-path length is an indicator of a better connec-
tion between players, since the ball can travel from a player to any other in a lower number of steps. Finally, it is
interesting to note that FCB has one of the lowest algebraic connectivities, which is an indicator of structural integra-
tion. Low values of λ2 reflect that the team is more split into two different groups. Note that, when the algebraic
connectivity λ2 is calculated from the average connectivity matrix (Fig. 3D), FCB has a value higher than their rivals,
reflecting a higher cohesion of the whole team. However, when it is computed from the 50-pass networks, FCB alge-
braic connectivity is one of the lowest. A possible explanation is that cohesion of the team may be grounded on a
higher number of passes between players, and not on the topological organization of the network.
Discussion
What passing networks tell us about FCB. As we have seen, using Network Science to analyze football
passing networks gives a new perspective that allows distinguishing between different teams and relating network
properties to the teams particular style of playing. Here, we have made use of these metrics to characterize the
passing networks of Guardiola’s Barcelona, focusing on the season 2009/2010 of the Spanish national league,
Scientific Reports | (2019) 9:13602 | https://doi.org/10.1038/s41598-019-49969-2 7www.nature.com/scientificreports/ www.nature.com/scientificreports
10 14
17 7 3 19
8 5 9
12 16 20
7 6
3 1 13 18 9
Barcelona 8 10 5 17
16 14 2 4 20 2 13 18 11
11 Barcelona 4
19 6 12
1 1:Real Madrid
3:Athletic Club
4:Espanyol
5:Mallorca
6:Xerez
8 9 7:Osasuna
Barcelona 3 6
18
1 16 14
8:Villarreal
5 2 10
11 7 13 12 5 9:Real Zaragoza
14 7 4 12 20 16 17 10 10:Tenerife
19 17 19
3 13 20 11:Valencia CF
11 Barcelona 1 4
9 6 2 18 12:Sevilla
8 14:Real Valladolid
15:Barcelona
17:Racing de Santander
8 20 16 6 18:Getafe
19 Barcelona
18 Barcelona 12
7 5 19 16 20 7
14 17 11 8 18
1 14 6 12 2 5
17 1
4 3 2
10 11 13 9
10
9 3 4 13
Figure 6. Network parameters depend on scoring/receiving a goal. (A) clustering coefficient C, (B) average
shortest-path d, (C) largest eigenvalue λ1 of the connectivity matrix, (D) algebraic connectivity λ2, (E) centrality
dispersion ECdisp and (f) highest eigenvector centrality ECmax. Parameters are obtained for all teams and are
shown in a two-dimensional plot, where the horizontal axis corresponds to the value of a metric when the team
receives a goal and the vertical axis is the same metric obtained when the team scores a goal. Solid lines
correspond to the function y = x, helping to identify wether a given parameter increases or decreases when a
goal is scored/received. Each point represents the average along the whole season.
one of the years where FCB was considered to reach its top in terms of playing style and trophies. When passing
networks are constructed as a simple addition of all passes made between players during the match, statistically
significant differences between the passing networks of FCB and its rivals arise. Specifically, the clustering coef-
ficient, the shortest-path, the largest eigenvalue of the connectivity matrix and the algebraic connectivity, always
have “better” values in the Catalan team. The term “better” refers to the fact that differences in these network
properties are related with a higher local resilience against the loss of passes (due to a higher clustering), a lower
number of steps to connect any two players of the teams (due to a lower shortest-path length) and a higher con-
nectedness between the whole team, as indicated by a higher largest eigenvalue of the connectivity matrix and a
higher algebraic connectivity.
However, it is worth looking beyond the differences in the network metrics and trying to find the reasons
behind them. When focusing on the number of passes made by FCB we can, first, observe that it is much higher
than their rivals and, second, that the advance ratio, measuring the percentage of distance that the ball advances
parallel to the opponent’s goal is also much higher. Concerning the latter, note that the advance ratio is not
related to the number of passes and, therefore, there is not an obvious reason why it should influence network
parameters. However, the number of passes has, indeed, crucial consequences on any quantitative analysis using
Network Science. The fact that we are comparing networks with the same number of nodes (eleven) but links with
different weights (number of passes) has unavoidable consequences on the network parameters. For example,
since the “topological” distance between two directly connected players is given by the inverse of the number of
passes between them, the higher the average number of passes of a team, the lower topological distance between
their players. Despite being obvious, a reasonable conclusion of the study is that increasing the number of passes
benefits the general properties of passing networks. However, comparing the properties of two networks with
different number of passes hinders the role played by the network topology itself, i.e., we can not say that a net-
work is better organized, since we can not separate the effect of the number of passes (“quantity”) from that of the
topology of the network (“quality”).
A second issue related to the number of passes is possession. Note that the number of passes is intimately
related to the possession a team has. A team with higher possession will unavoidably have more passes and that
is exactly what FCB, under the guidance of Guardiola, is doing. But to what extend can we relate possession to
the particular organization of FCB passing networks? Are the reported values of its network parameters just a
consequence of having the ball more time?
A third issue arises when trying to interpret the results of the averaged passing networks. Since, as we have
seen, network organization and, consequently, network parameters, are continuously evolving during the match,
considering the sum of all passes may hide interesting information about how different crucial events influence
a team’s style of playing, such as a scored/received goal, a substitution or, simply, the fatigue of the players as time
goes by.
Scientific Reports | (2019) 9:13602 | https://doi.org/10.1038/s41598-019-49969-2 8www.nature.com/scientificreports/ www.nature.com/scientificreports
In order to overcome these three issues and, particularly, to exclude the influence of the number of passes (or
possession) and, at the same time, accounting for the evolution of the network topology we studied the properties
of the 50-pass networks. A part from the benefits of tracking their temporal evolution, 50-pass networks contain
exactly the same number of nodes and links for the two teams playing a match, which allows a direct comparison
of the network organization, no matter what the final number of passes of each team is. However, the tracking
of the parameters of the 50-pass network shows that network parameters are in continuous evolution, which
increases the complexity of the analysis. Here, we focused on the state of the passing network just before scoring/
receiving a goal, which allows to extract information about what are the network properties associated to the
ability of a team to score/receive a goal. With such an approach we were able to complement the information
extracted from the averaged passing networks, obtaining a more detailed profile of Guardiola’s team. These results
reinforced all the conclusions drawn by analyzing average passing networks and included the following additional
information about FCB:
1. It is the team that requires the shortest time to construct 50-pass networks, and this time remains unaltered
when scoring/receiving a goal,
2. It is the team with the highest advance ratio (i.e., the team that plays the most horizontal to the opponent’s
goal) and this metric is specially high before scoring a goal,
3. The dispersion of the players around the network centroid is the lowest but significantly increases before
receiving a goal,
4. The clustering coefficient is higher when receiving goal than when a goal is scored,
5. The shortest-path is one of the lowest and does not depend on scoring/receiving a goal,
6. The largest eigenvalue of the adjacency matrix, measuring the strength of the network is the largest, and
significantly increases before receiving a goal,
7. The algebraic connectivity, measuring the cohesion between groups of players, decreases before receiving a
goal (i.e., the interplay between groups is reduced),
8. The highest centrality acquired by a single player and the centrality dispersion are the highest, which
indicates that the importance of players in the FCB network is not evenly distributed, with one player, Xavi,
being the hub of the passing networks.
Note that all these patterns refer exclusively to FCB, while passing networks corresponding to other teams
behave in its own way. Therefore, one of the conclusions we can draw from Figs 5 and 6 is that variables of each
team before scoring/receiving a goal behave in a particular way. For example, as we can see in Fig. 5D, the disper-
sion of FCB’s players around the position of the network’s centroid is higher when a goal is received, indicating
that when players are more separated from the centroid, the risk of receiving a goal increases. However, if we
look at the same parameter for Valencia CF, we can observe that the behaviour is just the opposite, and higher
dispersions around the team’s centroid (note that in this case players are occupying more field) are reported when
scoring a goal.
Finally, it is worth mentioning the limitations and risks of our study. As we have seen, computing the param-
eters related to the average passing networks gives interesting, but limited, information about the way a team
is organized. As shown in Fig. 4, there exist strong fluctuations on the network parameters during a match and
defining 50-pass networks is a reasonable option to capture the evolution of the structure of passing networks.
However, there are associated issues and alternatives that may be explored in further studies. For example, the
length of the 50-pass networks could be adapted to capture the “momentum” of the match, which may change
from team to team or just due to the events occurring during the match. Therefore, it would be interesting to find
a way of defining the most adequate time windows and how the length of these windows are related to the par-
ticular style of playing a team has. Another limitation is related to the causes of the parameter fluctuations, since
they can have different origins (a goal, a substitution, fatigue, etc…). It would be extremely useful to identify all
possible variables affecting the network organization and compute the network parameters after these particular
events occur, trying to identify what are those variables that crucially change the style of playing of a given team.
An interpretation within a football framework. Going beyond passing networks, the strategy of having
the ball most of the time leads, in general, to controlling the game by creating a dynamical context to which the
opposing team needs to adapt and, in particular, gave FCB a systematic superiority that led to an increase of the
scoring opportunities.
Firstly, FCB defense can lengthen or shorten the space by moving the line of defenders forwards or backwards.
In other words, it can play with the occupied length of the field and use the off-side area in its favor. The fact that
FCB network centroid was advanced (in average) compared to its rivals (see Fig. 2E), left the opponents a smaller
area of the pitch and fewer playing options.
Furthermore, Barcelona organized the team into “situational areas” around the ball, which comprised the
commitment of five or six players. Inside these areas, the team must overcome a challenge, i.e., either play the
ball or recover it, leading to a division of the game into two phases. Players organized spontaneously inside these
situational areas (and, as we will discuss, after training these situations), communicating with each other and
exchanging physical, verbal, and motor-related signals. This way of modulating the playing field into building
blocks leads to more playing patterns, resulting in more different options to overcome the rival.
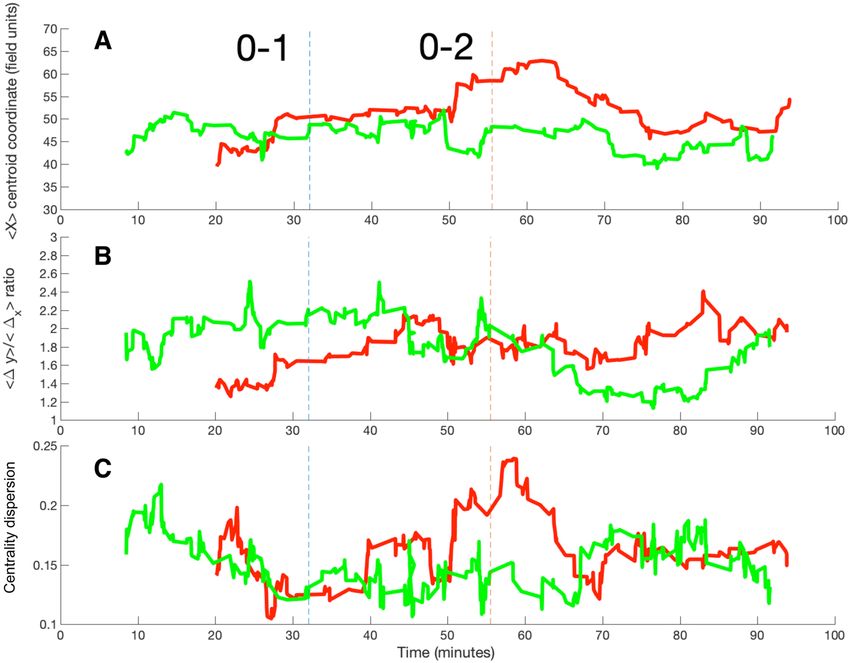
Specifically, during the attacking phase (see Fig. 7), the player with the ball had a helping area #1 (also known as
the helping zone) with two players forming possible triangles within a distance d1 of 10 to 15 meters. At the same
time, there was a co-operation area (#2) with two more players (one slightly forward and the other covering the
back) occupying a wider radius d2 (around 20 meters). During this phase, passes were promoted between players
Scientific Reports | (2019) 9:13602 | https://doi.org/10.1038/s41598-019-49969-2 9www.nature.com/scientificreports/ www.nature.com/scientificreports
Cooperation zone
Helping zone
d2
Game
1 orientation
d
Figure 7. F.C. Barcelona organization during “attacking phases”. Four players organize around a fifth player who
is having the ball. Two concentric circles around the ball define the helping zone (radius d1) and the cooperation
zone (radius d2). Passes between players in the helping zone are promoted. The defensive phase is organized in a
similar way, but in this case, pressing the opponent who has the ball.
inside the situational area, which, from the network perspective, resulted in a higher clustering coefficient (Fig. 3A)
and a lower shortest-path distance between them (Fig. 3B). In addition, trying to keep the game inside a situational
area promoted the creation of short passes, reducing the risks of losing the ball, as opposed to long passes.
On the other hand, the defensive phase started as soon as the opponent had the ball and was based on the crea-
tion of a large “interception space” to increase the chance of recovery. Similarly to the attacking phase, two regions
were organized and coordinated over a radius of 20 meters. The fact that FCB played more advanced towards the
opponent’s goal than their rivals, (see Fig. 2A) together with the coordinated pressure, made any eventual recov-
ery more dangerous, increasing the probability of subsequent shooting actions.
In addition to dividing the field into various areas, a distinctive factor of FCB was the role players adopted
and their area of specialization. The fact that FCB promoted generalist players is linked to what is known as “total
football”46. In effect, with the FCB’s playing style, all players could play the ball, recover it, and score. As a conse-
quence, a possible interpretation could be that more generalist profiles tend to generate more connections, take
more advantage of the space, and generate different game options, leading to more complex passing networks. In
addition, a team based on generalist players forces opponents to spend more energy and work harder at coordi-
nation. For example, a team without an obvious centre-forward player generates ambiguity and uncertainty for
the three or four opposing defenders. One consequence of the promotion of generalist players is the the fact that,
from the 18 field players that played more than 1000 minutes during the season, only 3 of them did not score a
goal (Milito, Maxwell and Abidal).
Furthermore, a number of generalist players promoted the arousal of spontaneous playing patterns, that is,
different ball flows and/or positions for players who are successfully scoring goals, passing, or recovering the ball.
By managing the right trajectories and the right supporting positions, the opponent was forced to cover more
ground running and increasing his fatigue. Controlling the ball while the opponent run out of energy leaded to
much better positions for gaining superiority, creating surprises, and obtaining opportunities to score.
At the same time, it is worth noting the existence of a core group of players whose participation in the passing
networks was higher than the rest. This fact is indicated by the high eigenvalue λ1 (Fig. 6C), the high heterogeneity
in the centrality of the players (Fig. 6E) and the existence of a player with the maximum centrality higher than the
other teams (Xavi) (see Fig. 6F). In addition, the existence of this core could be related to the fact that the algebraic
connectivity is reduced when analyzing 50-pass networks (an indicator of the existence of groups), since an under-
lying core-periphery structure, combining “leading” players with “follower” players, may lead to the existence of two
identifiable communities. In this way, the existence of 4–5 players that carried and passed the ball most often could
be translated into the existence of a certain distributed leadership in the different situational areas and phases of the
game — while the other players followed, coordinately, the game carried out by these leaders.
Finally, we have to remark that the tactical organization was carefully planned and trained by Guardiola and
his technical staff, and it was not a matter of serendipity46. In fact, this style of playing was one of the FCB’s sig-
natures and it was promoted at lower categories of the team. In this way, seven out of the ten players that played
more than 1000 minutes during the 2009/2010 were raised up at La Masia, the FCB youth academy. In addition,
three of them (Xavi, Iniesta and Messi) were designed as the three finalists of the Ballon D’Or at the end of that
season, which is given to the best football player along the whole season.
Summarizing, we have identified a series of particular network properties that make Guardiola’s Barcelona a
team different from the rest, allowing the interpretation of the reported network parameters. We believe that fur-
ther studies taking into account the spatiotemporal evolution of football passing networks, together with recent
approaches including the construction of network-of-networks53,56, multilayer networks57,58 or hypernetworks59
could further enhance the understanding of how football teams, in particular, and sport teams in general, organ-
ize and evolve along a match and what are the key factors that determine their performance. Furthermore, despite
our results are focused on team performance, they can be adapted to evaluate single players and their contribution
to the team. This change of “scale”, would imply some collateral issues, such as the difference in the number of
matches played by each player or the fact that the position a player has in the team unavoidably affects his/her
network properties. However, we believe that this kind of new approaches will be incorporated, in the years to
come, to complement classical metrics of player performance.
Scientific Reports | (2019) 9:13602 | https://doi.org/10.1038/s41598-019-49969-2 10www.nature.com/scientificreports/ www.nature.com/scientificreports
Time (seconds) Team Player 1 x1 y1 Player 2 x2 y2
… … … … … … … …
355 F.C. Barcelona Busquets 32.35 58.35 Xavi 41.20 61.90
359 F.C. Barcelona Xavi 50.35 62.35 Messi 60.70 64.80
363 F.C. Barcelona Messi 70.35 60.55 Henry 82.70 56.50
… … … … … … … …
Table 1. Example of the dataset structure. Time, in seconds, corresponds to the moment at which the pass
is made. Player 1 and player 2 are, respectively, the sender and receiver of the pass, while x1,2 and y1,2 are the
coordinates of both players, in field units (bounded, at both axis, between 0 and 100).
Methods
Construction of the passing networks. Datasets, provided by Opta, consists of all passes completed along
a football match by each team of the Spanish national league (“La Liga”) for the season 2009/2010. Specifically,
consists of a set of 380 matches, 38 per team. For each pass, we have the information about: (i) the player who
passes the ball, (ii) the player who receives the ball, (iii) the position (x and y coordinates) of the sender/receiver
players and (iv) the time at which the pass was made (see Table 1 for details). Since we are concerned about the
game of FCB, we focused on all matches played by this team, and analyze the passing networks of FCB and its
rivals. We construct networks in two different ways. On one hand, we obtain the match average passing networks,
where nodes are players and links represent the number of passes between them. Note that links are unidirec-
tional and weighted according to the number of passes between players. To ease comparison between networks,
each titular player is assigned a node at the beginning of the match. If a player is changed, the new player occupies
the node of the previous player. In this way, we assure that all networks have eleven players, focusing on the struc-
ture of the network as a whole instead of the performance of isolated players.
On the other hand, we construct the “50-pass networks” with the aim of accounting for the temporal evolution
of the game. 50-pass networks contain only 50 consecutive passes and are assigned the time of the last of these
passes. This way, when the match begins, we wait for the first l = 50 passes to occur and, at this moment called t0,
we construct and analyze the 50-pass network Gt0. Next, each time a new pass is made, we disregard the oldest
of the passes of the network and include the new one, assigning the time of the last pass t to the new network Gt.
This kind of networks has two advantages compared to the averaged ones: (i) it accounts for the fluctuations of the
network parameters along the match and (ii) it has exactly the same number of nodes and links for both teams,
which detaches the influence of the absolute number of passes and focuses only on the structural differences
between networks. It is worth noting that the number of passes to construct the network could be modified to
another quantity, however it should be low enough to account to the fluctuations occurring during the match (i.e.,
avoiding averages) but long enough to guarantee the connectivity between all nodes of the network. In our case,
we analyzed the effects of using different number l of passes and chose l = 50 as a trade-off value.
Definition of network metrics. Centroid coordinates and dispersion. ⟨X⟩ and ⟨Y⟩ centroid coordinates
correspond to the average position of all pases of the network, i.e., all passes of the match in the average network
and only 50 of them in the 50-pass passing networks. Specifically, we only consider the position from where the
pass is sent. Values are given in field coordinates, which, in both axis, range from 0.00 to 100.00. In this way, the
center of the field corresponds to coordinates [50.00,50.00] and the center of the opponent’s goal is [100.00, 50.00]
(being [0.00,50.00] the center of the own team’s goal). The centroid dispersion Centdisp corresponds to the standard
deviation of the distances of the players with regard to the position of the network centroid.
Clustering coefficient. In general, the local clustering coefficient of a node i is obtained as the percentage of the
nodes directly connected to it that, in turn, are connected between them. This measure can be averaged along the
N nodes of the network to obtain the average clustering coefficient. However, when the network is weighted, we
can not simply account for the number of nodes connected between them but, also, how the link weights are dis-
tributed. This is the case of passing networks, where the number of passes between pairs of players is not constant.
In this way, we use the weighted clustering coefficient Cw(i) to measure the likelihood that neighbours of a given
player i will also be connected between them60:
∑ j , kwijwjkwik
Cw(i) =
∑ j , kwijwik (1)
where j and k are any two players of the team and wij and wik the number of passes between a third player i and
both them. Finally, the clustering coefficient of the whole network is obtained by averaging Cw(i) over all players,
i.e., C = 1 ∑ iN=1Cw(i). Note that, the weighted version of the clustering coefficient characterizes the tendency of
N
the team to form balanced triangles between players and it is a measure of local robustness.
Shortest-path length. In a passing network, the shortest path length d is the minimum number of players that
must be traversed by the ball to go from one player to any other. Since passing networks are weighted (i.e., the
number of passes between players is different), we have to take into account the different weights of the links,
considering that, the higher the weight, the shorter the topological distance between two nodes. The topological
length lij of the link between two players i and j is defined as the inverse of the link weight, lij = 1/wij. However,
Scientific Reports | (2019) 9:13602 | https://doi.org/10.1038/s41598-019-49969-2 11You can also read