Cortical neurons exhibit diverse myelination patterns that scale between mouse brain regions and regenerate after demyelination - Nature
←
→
Page content transcription
If your browser does not render page correctly, please read the page content below
ARTICLE
                  https://doi.org/10.1038/s41467-021-25035-2                 OPEN

                  Cortical neurons exhibit diverse myelination
                  patterns that scale between mouse brain regions
                  and regenerate after demyelination
                  Cody L. Call1 & Dwight E. Bergles                  1,2 ✉
1234567890():,;

                  Axons in the cerebral cortex show a broad range of myelin coverage. Oligodendrocytes
                  establish this pattern by selecting a cohort of axons for myelination; however, the distribution
                  of myelin on distinct neurons and extent of internode replacement after demyelination remain
                  to be defined. Here we show that myelination patterns of seven distinct neuron subtypes in
                  somatosensory cortex are influenced by both axon diameter and neuronal identity. Pre-
                  ference for myelination of parvalbumin interneurons was preserved between cortical areas
                  with varying myelin density, suggesting that regional differences in myelin abundance arises
                  through local control of oligodendrogenesis. By imaging loss and regeneration of myelin
                  sheaths in vivo we show that myelin distribution on individual axons was altered but overall
                  myelin content on distinct neuron subtypes was restored. Our findings suggest that local
                  changes in myelination are tolerated, allowing regenerated oligodendrocytes to restore
                  myelin content on distinct neurons through opportunistic selection of axons.

                  1 The Solomon Snyder Department of Neuroscience, Johns Hopkins University, Baltimore, MD, USA. 2 Johns Hopkins University, Kavli Neuroscience

                  Discovery Institute, Baltimore, MD, USA. ✉email: dbergles@jhmi.edu

                  NATURE COMMUNICATIONS | (2021)12:4767 | https://doi.org/10.1038/s41467-021-25035-2 | www.nature.com/naturecommunications                        1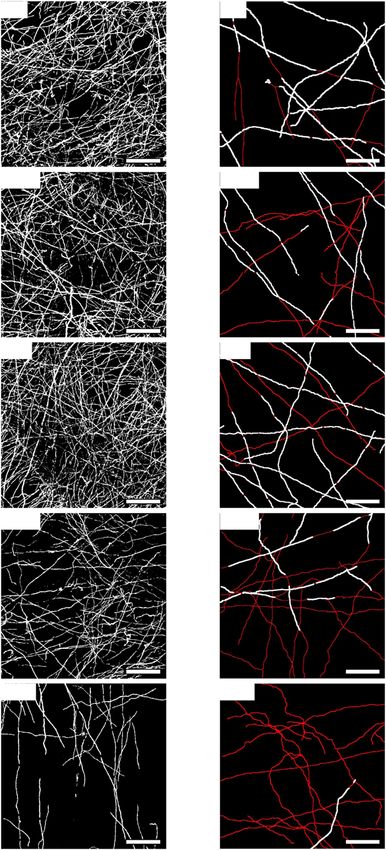
ARTICLE                                                                 NATURE COMMUNICATIONS | https://doi.org/10.1038/s41467-021-25035-2

C
        ircuits within the cerebral cortex are formed by a diverse           somatosensory cortex. This analysis revealed a diversity of myelin
        population of neurons that integrate input from both local           patterns that did not closely follow functional class (excitatory
        axon collaterals and long-range projections within specific           versus inhibitory) or cell body location (thalamus versus cortex),
lamina. In the uppermost layer of the cortex (layer I), axonal               with discontinuous myelination observed on all myelinated axons
projections synapse onto the dendritic tufts of pyramidal neurons,           in these adult mice. The probability of myelination could be
serving as a critical hub for integrating local inhibition, thala-           predicted through a combination of cell type and axon diameter,
mocortical and corticocortical excitation, and long-range neuro-             indicating that the observed patterns are strongly influenced by
modulation, providing top-down regulation of sensory inputs1–3.              cell intrinsic factors rather than just cell morphology. By per-
Despite the critical need to integrate input from both local and             forming longitudinal time-lapse imaging of local PV interneurons
distant inputs in this region, and the ability of myelin to control          and thalamocortical VM neurons we found that although the
the timing of synaptic activity, we have only a limited under-               precise pattern of myelin along individual axons was altered
standing of the myelin patterns along axons of distinct neuron               following regeneration, at the population level, the total myelin
subtypes that course within this cortical area. Although a small             content on these distinct neuronal subtypes was preserved. These
fraction of these axons are well-myelinated and extend within                findings suggest that regeneration of oligodendrocytes relies on
layer I for many millimeters in rodents (or centimeters, in pri-             opportunistic target selection to restore the content of myelin on
mates) before terminating4,5, the overall myelin content within              diverse neuronal subtypes in the mammalian cortex.
each cortical region is small6, suggesting a high level of specificity
in oligodendrocyte selection of axons. Approximately 10% of
myelin sheaths in layer I surround inhibitory axons, the majority            Results
of which express parvalbumin (PV)7,8, but the vast majority are              Cortical axons exhibit diverse myelination patterns. To define
associated with an unknown population of neurons. Moreover,                  the pattern of myelination along axons of different subtypes of
individual axons in the cortex can vary extensively in the number            neurons in the cerebral cortex, we used Cre-lox and viral
and pattern of myelin sheaths along their lengths9–11. This                  expression strategies to fluorescently label seven neuronal sub-
“discontinuous” myelination has been well-described on PV                    populations that extend axon collaterals into layer I of primary
interneurons and proximal axon segments of pyramidal                         somatosensory cortex (S1) (Fig. 1a, Table 1). We compared
neurons8,11, but the pattern of myelin along these and other types           myelin along axons of two types of GABAergic neurons (par-
of neurons has not been explored in layer I.                                 valbumin (PV), somatostatin (SOM)) and three corticocortical
   Schwann cells in the peripheral nervous system select axons for           projecting neurons (layer VI corticothalamic: NTSR1-Cre38–40;
myelination strictly by axon diameter12, with a threshold of                 layer VIb subplate: NXPH4-Cre41,42; layer Va/Vb pyramidal:
~1.5 μm12–14. Similarly, oligodendrocytes in the CNS only mye-               RBP4-Cre43) by crossing to fluorescent reporter mice (Ai3, Ai9)44.
linate axons or inert fibers in vitro with diameters > 0.3 μm15–17,           These Cre lines have been well-characterized in previous studies
suggesting that there are strict biophysical constraints on which            and are highly selective in labeling pyramidal neurons within
axons can be wrapped. Nevertheless, individual oligodendrocytes              their corresponding lamina45,46 (Supplemental Fig. 1a–j). In
are capable of myelinating a range of axon sizes18 and provide               addition, two thalamocortical projections, the ventral medial
sheaths of different thicknesses and lengths, often correlated with          nucleus (VM) and medial posterior nucleus (PO, were analyzed
the diameter of each axon18,19, illustrating the additional com-             by injecting tdTomato expressing AAV virus within different
plexity of CNS myelination. The discontinuity of myelin along                regions of the thalamus (Supplemental Fig. 1k–n). Horizontal
individual axons and the numerous axons of permissive diameter               sections that preserved the orientation of axonal trajectories
that lack myelin indicate that oligodendrocytes in gray matter               (parallel to the pia) were then collected from these mice and
may be influenced by other factors in addition to axon diameter,              immunostained for MBP (Fig. 1b, c). The complete morphologies
such as spiking activity20–24 or surface protein expression25 to             of randomly selected axons were traced within a 675 μm ×
yield cell-type-specific myelination patterns.                                675 μm × 40 μm volume and the percent of axon length myeli-
   The complex patterns of myelination that exist in the cortex              nated (PLM) was calculated ([total length of all MBP-positive
create significant challenges for repair. Demyelinating lesions of            internodes/total axon length] × 100%) (Fig. 1d–l, Supplementary
the gray matter in multiple sclerosis (MS) most commonly occur               Movie 1). PLM distributions varied considerably between the six
just below the pia26–28, and are associated with cognitive dis-              neuronal subtypes that were myelinated (Fig. 2a, b); NTSR1-
abilities and poorer prognosis26,29–33, making this region of                expressing pyramidal neurons were not myelinated (Fig. 2c).
particular interest for understanding the identities of the axons            Moreover, axons of each neuronal subtype ranged from unmye-
myelinated and the extent to which they are remyelinated in                  linated to nearly completely myelinated, revealing the high
recovery. Cortical PV interneurons become extensively myeli-                 variability in cortical myelination even within the same neuronal
nated very early in development34, which is thought to be                    subtype. Although differences in the degree of axonal collater-
important for preventing runaway excitation in nascent circuits              alization between neuronal subtypes influenced the total axon
and for coordinating pyramidal neuron firing to generate high-                length measured (Fig. 2d), this variability did not correlate with
frequency oscillations35,36. Recent in vivo-imaging studies indi-            PLM for any neuronal subtype except SOM (R2 = 0.373) (Sup-
cate that the distribution of oligodendrocytes and the overall               plemental Fig. 1), suggesting that under-sampling did not
pattern of myelin changes upon recovery from cuprizone-induced               strongly influence the detection of these myelination patterns.
demyelination37, but it is not known if this reorganization affects             As previously described7,8, PV axons were among the most
the distribution and content of myelin along excitatory and                  highly myelinated, with approximately two-thirds of traced axons
inhibitory neurons equally. Myelin within layer I of the soma-               associated with at least one internode (average proportion: 0.7 ±
tosensory cortex is completely restored after cuprizone-induced              0.08, n = 4 mice) and about half of the PV axons exhibiting a
destruction of oligodendrocytes37, providing a unique opportu-               PLM > 50% (Fig. 2a–c). The proportion of PV axons with myelin
nity to study the specificity of the remyelination process in vivo.           in layer I was lower than previously reported8. We expect this
   Here we used a combination of cell-specific axon labeling with             apparent discrepancy is due to tracing only the axonal arbor
high-resolution imaging of myelin sheaths to define the myeli-                contained in layer I, where the degree of myelination is several
nation patterns of seven distinct excitatory and inhibitory neu-             times lower than that in layer II/III7,8. VM thalamocortical axons
ronal subtypes that extend axon collaterals within layer I of the            were myelinated to a similar extent as PV axons (average

2                NATURE COMMUNICATIONS | (2021)12:4767 | https://doi.org/10.1038/s41467-021-25035-2 | www.nature.com/naturecommunications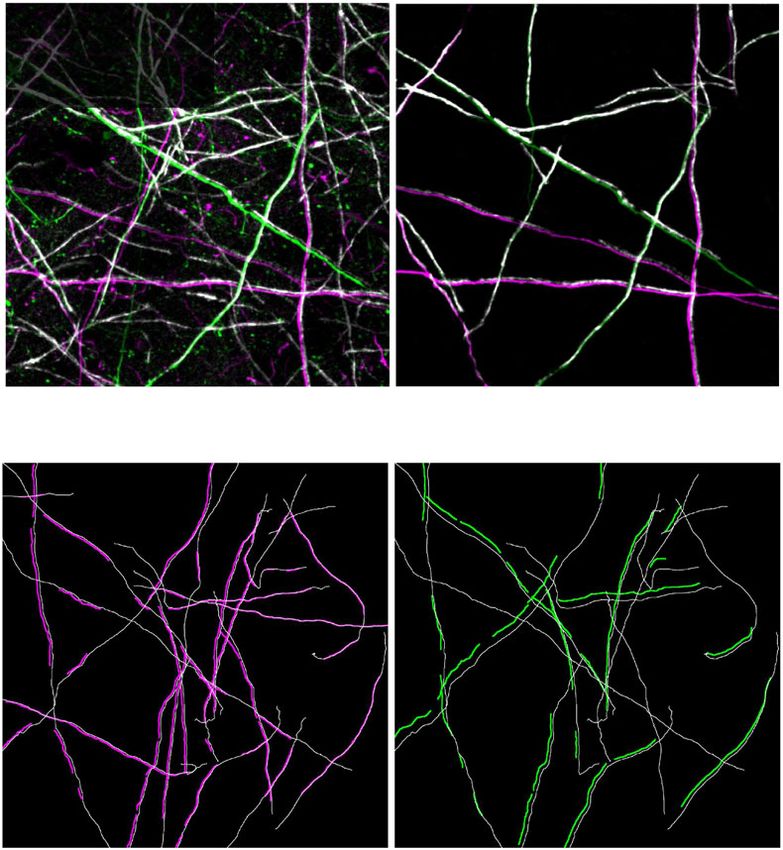
NATURE COMMUNICATIONS | https://doi.org/10.1038/s41467-021-25035-2                                                                        ARTICLE

Fig. 1 High-resolution tracing of distinct axon populations reveals discontinuous myelination patterns. a Schematic of the cortex indicating the sources
of axons from the distinct neuronal populations investigated. Note that the axons depicted may not necessarily be the primary projection of each neuron.
b A horizontal section of the entire cortical flatmount and schematic representing approximate cortical areas. N = 4 mice per neuron subtype. c Schematic
of experimental design. Traces (black dotted line) of fluorescently labeled axons (red) were used to trace corresponding MBP-immunostained myelin
sheaths (cyan). d–I Full reconstructions of traced PV (d), RBP4 (g), and VM (j) axons within cortical layer I and their associated dimensions (PLM, percent
length myelinated). Black myelin sheaths are overlaid on colored axons. Labeled rectangles highlight example myelinated segments of PV (e, f), RBP4 (h, i),
and VM (k, l) axons. Yellow arrowheads indicate the ends of myelin segments (MBP immunoreactivity). n = 60 (PV), 62 (VM), 60 (SOM), 61 (PO), 60
(NXPH4), 78 (RBP4), 60 (NTSR1) axons. Scale bars, b, 1 mm; d, g, j: 100 μm; e, f, h, i, k, l: 10 μm. OB olfactory bulb, lot lateral olfactory tract, MOp/MOs
primary/secondary motor, ACA anterior cingulate area, GU/VISC gustatory/visceral, SSp/SSs primary/secondary somatosensory, PTLp posterior parietal
association, AUD auditory, RSP retrosplenial, VISp primary visual, ECT/PERI ectorhinal/perirhinal, TEa temporal association.

 Table 1 Layer I-projecting neuronal subtypes and labeling strategies.

 Neuronal subtype                       Examined in                Labeling strategy                                            Myelination status
                                        this study?
 Serotonergic                           No                         N/A                                                          Not myelinated85
 Adrenergic                             No                         N/A                                                          Not myelinated86
 Dopaminergic                           No                         N/A                                                          Not myelinated87
 Cholinergic                            No                         N/A                                                          Unknown
 Thalamocortical (ventromedial          Yes                        AAV-DJ-CaMKii-mCherry or AAV9-hSyn-EGFP                      Strongly myelinated
 nucleus)
 Thalamocortical (posterior nucleus)    Yes                        AAV-DJ-CaMKii-mCherry                                        Intermediately myelinated
 Layer II/III                           No                         N/A                                                          Unknown
 Layer V intracortical                  Yes                        Rbp4-Cre; Ai9 or AAV9-CAG-FLEX-tdTomato injections           Weakly myelinated
                                                                   into motor cortex of Rbp4-Cre mice
 Layer VI intracortical                 Yes                        Ntsr1-Cre; ROSA-lsl-EYFP (Ai3) or ROSA-lsl-tdTomato          Not myelinated
                                                                   (Ai9)
 Layer VIb subplate                     Yes                        Nxph4-CreER; Ai9                                             Weakly myelinated
 Parvalbumin+ interneuron               Yes                        Pvalb-Cre; Ai9                                               Strongly myelinated
 Somatostatin+ interneuron              Yes                        Sst-Cre; Ai9                                                 Intermediately myelinated

proportion: 0.6 ± 0.1, n = 4 mice) and exhibited similar myelina-               frequently (average proportions: PO, 0.3 ± 0.06; SOM, 0.3 ± 0.05;
tion patterns (p = 0.99, Kruskal–Wallis one-way ANOVA with                      RBP4, 0.08 ± 0.04; NXPH4, 0.05 ± 0.03; NTSR1, 0; n = 4 mice
Dunn–Šidák correction for multiple comparisons) (Fig. 2a–c,                     each) (Fig. 2c, Table 2). There was no difference in the average
Table 2). All other axons examined were myelinated much less                    length of internodes between neuronal subtypes (p = 0.514,

NATURE COMMUNICATIONS | (2021)12:4767 | https://doi.org/10.1038/s41467-021-25035-2 | www.nature.com/naturecommunications                                  3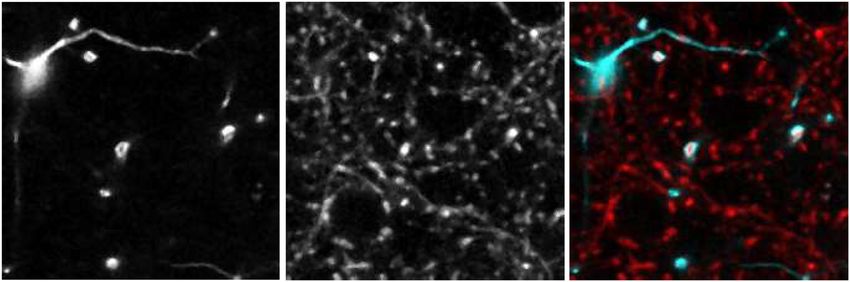
ARTICLE                                                                   NATURE COMMUNICATIONS | https://doi.org/10.1038/s41467-021-25035-2

Fig. 2 Different neuronal subtypes exhibit diverse myelination profiles. a Myelination profiles for the six neuronal subtypes examined in this study with
myelinated axons. Each plot is a histogram of pooled data across four animals for each subtype representing the proportion of axons with different percent
length myelinated in 10% bins (n = 60 (PV), 62 (VM), 60 (SOM), 61 (PO), 60 (NXPH4), 78 (RBP4), 60 (NTSR1) axons). See Table 2 for statistical
comparisons. b Cumulative distribution plot of data in (a), showing three distinct classes of myelination patterns. c Proportions of axons myelinated per
neuronal subtype (N = 4 mice for each subtype) ****p < 0.0001. d Lengths for each axon traced (same Ns as in (a)). e Average internode lengths per axon
for each neuronal subtype (n = 38 (PV), 41 (VM), 18 (SOM), 14 (PO), 6 (NXPH4), 2 (NTSR1) axons) (ns, not significant, p = 0.514, one-way ANOVA).
f Violin plots of the lengths of unmyelinated axon segments (axonal distance between two consecutive MBP segments) for the top four most strongly
myelinated neuronal subtypes. Unmyelinated segments of 5 μm) unmyelinated segments from data in f. All
error bars represent the standard error of the mean. Source data and statistical tests are provided as a Source Data file.

one-way ANOVA; Fig. 2e), indicating that PLM differences                       myelinated (SOM and PO), and weakly myelinated (RBP4 and
reflect the number of internodes per axon.                                      NXPH4) (Fig. 2b). Overall, PO and SOM axons shared similar
   Three general myelination profiles were evident in the PLM                   myelination patterns, matching that observed in deeper cortical
distributions: strongly myelinated (PV and VM), intermediately                 layers34, as did RBP4 and NXPH4 axons. Notably, these

4                  NATURE COMMUNICATIONS | (2021)12:4767 | https://doi.org/10.1038/s41467-021-25035-2 | www.nature.com/naturecommunications
NATURE COMMUNICATIONS | https://doi.org/10.1038/s41467-021-25035-2 ARTICLE
Table 2 Multiple comparison tests for myelination patterns.
Sample 1 Sample 2 Lower 95% CI Estimate Upper 95% CI Corrected p value
PV VM −42.98 5.88 54.74 1
PV SOM 29.57 78.83 128.09 4.19 × 10⁻⁵
PV PO 23.95 73.01 122.06 0.0002
PV RBP4 71.34 117.67 164.00 1.56 × 10⁻¹²
PV NXPH4 72.66 121.92 171.18 6.43 × 10⁻¹²
VM SOM 24.09 72.95 121.81 0.0002
VM PO 18.47 67.12 115.78 0.0008
VM RBP4 65.88 111.79 157.69 1.51 × 10⁻¹¹
VM NXPH4 67.17 116.03 164.90 5.37 × 10⁻¹¹
SOM PO −54.89 −5.83 43.23 1
SOM RBP4 −7.49 38.84 85.17 0.1921
SOM NXPH4 −6.18 43.08 92.34 0.1457
PO RBP4 −1.45 44.66 90.78 0.0664
PO NXPH4 −0.15 48.91 97.97 0.0514
RBP4 NXPH4 −42.08 4.25 50.58 1
Results of Kruskal–Wallis one-way ANOVA with Dunn–Šidák correction for multiple comparisons of data in Fig. 2.
myelination classes did not match functional classifications: while axons was not significantly different between these areas (SS vs.
all corticocortical axons were very weakly myelinated, the VIS: p = 0.16; SS vs. AUD: p = 0.45; VIS vs. AUD: p = 1,
interneuronal and thalamocortical axons were each split between Kruskal–Wallis one-way ANOVA with Dunn–Šidák correction
strongly and intermediately myelinated classes. for multiple comparisons) (Fig. 3b, c, Table 3). As expected, in
Myelination along individual cortical axons is often discontin- cortical areas with lower myelin content (i.e. secondary motor
uous, with myelinated segments interrupted by long stretches of (MOs): 42 ± 8; temporal association area (TEa): 14 ± 3), the PLM
unmyelinated axon9–11. To determine the extent of myelin distribution was significantly left-shifted, with fewer PV axons
discontinuity along different axons, we quantified the lengths of myelinated (Fig. 3b, c; Table 3). However, even in these sparsely
unmyelinated segments among the well-myelinated neuronal myelinated areas, PV axons were among the most highly myeli-
subtypes (PV, VM, SOM and PO). To reach the same PLM, axons nated; when the myelin abundance on PV axons was scaled to
could be myelinated with frequent gaps between adjacent overall MBP density (scaled myelination prevalence = average
internodes or have infrequent, longer gaps between local binarized MBP intensity/proportion of axons myelinated) this
continuously myelinated regions, with the only interruptions value was not significantly different between cortical regions (p =
arising from nodes of Ranvier. Plots of unmyelinated segment 0.24, Kruskal–Wallis ANOVA) (Fig. 3d), suggesting that PV axon
length revealed that all axons exhibited a large cluster of short myelination scales with the overall density of myelin. The pro-
lengths typical for nodes of Ranvier (0–5 μm; PV: 67%, VM: 73%, portional scaling of myelin content on PV neurons suggests that
PO: 66%, SOM: 69% of all lengths) (Fig. 2f), indicating that the high myelination probability of these axons is preserved
internodes tend to be clustered along axons to form continuously between cortical regions and that variations in myelin abundance
myelinated segments. To explore whether there are differences in primarily arise through regional differences in oligodendrogenesis
the distribution of myelin between neuron subtypes, we generated or oligodendrocyte survival. Performing a similar global analysis
cumulative distributions of non-nodal (>5 µm) unmyelinated on other neuron subtypes is complicated by the diverse popula-
segments (Fig. 2g). Although PV and SOM neurons tended to tions of axons that reside in distinct regions of the cortex, so it is
have shorter unmyelinated segments, there were no statistically not yet known if myelination probabilities are conserved for all
significant differences between the distributions (p = 0.095, neuronal subtypes.
Kruskal–Wallis one-way ANOVA). Together, these studies reveal
that different neurons that extend axons within layer I of the Axon diameter and neuronal subtype influence myelination
adult somatosensory cortex exhibit distinct, highly variable patterns. The relationship between axonal diameter and myeli-
myelination patterns. nation has been thoroughly described in the context of peripheral
nerves, CNS white matter, and even primary cell culture12–17,50,
Axonal myelination patterns scale between cortical regions. establishing that the probability of myelination increases with
The density of myelin varies considerably across the cortical axonal diameter. To determine if differences in myelination
mantle (Fig. 1b), with boundaries between cortical areas defined between neuronal subtypes in the cortex are simply due to dif-
by their distinct myeloarchitecture47,48. It is not known if these ferences in axon diameter, we quantified the variation in axon
differences reflect changes in myelin content along with certain diameter among each neuronal subtype in relation to MBP +
classes of neurons or proportional decreases in myelin content myelin sheaths (Fig. 4a). Axon diameters were estimated by
along all axons. To determine if the diversity in myelin patterns measuring the full-width at half maximum (FWHM) of fluor-
observed in the somatosensory cortex are preserved in other escent intensity (EYFP, tdTomato, or mCherry) across axons
cortical regions, we compared the myelination of PV axons across using superresolution microscopy (Fig. 4b). Across all neuronal
five cortical areas, as PV neurons exhibit consistent axon density subtypes examined there was a positive correlation between axon
across the primary sensory and motor cortices, with the exception diameter and probability of being myelinated (p = 8.99 × 10⁻¹⁴,
of a slightly lower density in association cortex49. Among sensory two-sample Kolmogorov–Smirnov test) (Fig. 4c, d). However, for
cortical areas (somatosensory (SS), visual (VIS), and auditory axons with diameters between 0.4 and 0.8 μm (44% of all axons
(AUD)), the density of MBP immunoreactivity was similar (mean examined) there was remarkable diversity in myelination status
gray value of binarized z projection, SS: 50 ± 8; VIS: 66 ± 8; AUD: among all neuron subtypes, varying from completely myelinated
61 ± 11, arbitrary units) (Fig. 3a) and the PLM distribution of PV to completely unmyelinated (Fig. 4c, d). While the most strongly
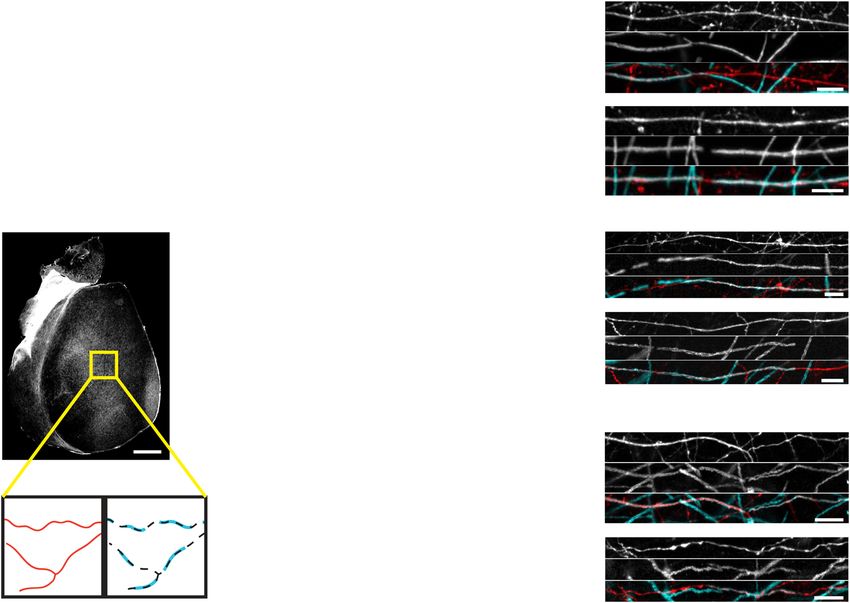
NATURE COMMUNICATIONS | (2021)12:4767 | https://doi.org/10.1038/s41467-021-25035-2 | www.nature.com/naturecommunications 5ARTICLE NATURE COMMUNICATIONS | https://doi.org/10.1038/s41467-021-25035-2 Fig. 3 PV axon myelination patterns are consistent across cortical regions. a Representative binarized images of MBP immunostaining from all cortical regions analyzed (SS somatosensory, AUD auditory, VIS visual, MOs secondary motor, TEa temporal association area). Scale bars, 50 μm. b Example axon and myelin traces from each cortical region analyzed from a single PV-Cre; Ai9 flatmount. Red, axons; white, myelin. Scale bars, 50 μm. c Cumulative distribution plot of PLM from all axons traced in each region in a (SS, n = 60 axons from 4 mice; VIS, n = 60 axons from 4 mice; AUD, n = 59 axons from 4 mice; MOs, N = 30 axons from 2 mice; TEa, N = 37 axons from 3 mice). See Table 3 for PLM distribution statistics. d Scaled prevalence (MBP intensity/ proportion of axons myelinated) of PV axon myelination across all regions analyzed (same Ns as in c) (ns not significant, p = 0.24, Kruskal–Wallis ANOVA). Error bars represent the standard error of the mean. Source data and statistical tests are provided as a Source Data file. Table 3 Multiple comparison tests for PV regional myelination. Sample 1 Sample 2 Lower 95% CI Estimate Upper 95% CI Corrected p value SS VIS −5.54 33.03 71.60 0.1534 SS AUD −11.73 26.68 65.09 0.4124 SS MOs 33.91 72.32 110.73 1.36 × 10⁻⁶ SS Tea 51.46 89.87 128.28 5.74 × 10⁻¹⁰ VIS AUD −44.91 −6.34 32.23 1 VIS MOs 0.72 39.29 77.86 0.0426 VIS Tea 18.27 56.84 95.41 0.0004 AUD MOs 7.22 45.63 84.04 0.0088 AUD Tea 24.77 63.18 101.59 4.11 × 10⁻⁵ MOs Tea −20.86 17.55 55.96 0.8937 Results of Kruskal–Wallis one-way ANOVA with Dunn–Šidák correction for multiple comparisons of data in Fig. 3. myelinated subtypes (PV and VM) tended to have larger axon revealed that while axon diameter influences myelination prob- diameters (average axon diameter: PV, 0.6 ± 0.03 μm; VM, 0.5 ± ability (Fig. 4e), neuronal subtype also effects myelination sta- 0.03 μm), their thinnest segments (
NATURE COMMUNICATIONS | https://doi.org/10.1038/s41467-021-25035-2                                                                                        ARTICLE

Fig. 4 A combination of diameter and neuronal subtype predicts myelination status. a Example segment of an axon imaged at high resolution for
diameter analysis and corresponding MBP immunostaining. A small rectangle was used to plot a profile of the average gray value intensity profile across a
few μm of the axon (result shown in (b)) to determine its diameter by the full width at half maximum (FWHM). Scale bar, 2 μm. b Plot of the average
profile across the axon in (a). Each point represents the average gray value of a single pixel across the representative lines in (a), top panel. c Histograms of
the proportions of axons myelinated (colored bars) or unmyelinated (gray bars) for different axon diameters. Note the color of overlapping bars is additive.
d As in (c), pooled across all neuronal subtypes. e Probability distributions for the myelination probability of each neuronal subtype given a certain
diameter. Points are individual axons myelinated. Intermediate probabilities (not 1 or 0) represent the average myelination status across at least three
positions along the axon surveyed to calculate the average diameter. See text for details on probability functions. Source data and statistical tests are
provided as a Source Data file.

                                                                                                       profoundly influence the probability of being selected for
 Table 4 Estimated coefficients for the generalized                                                     myelination.
 linear model.
                                                                                                       Remyelination restores myelin patterns among different neu-
                        Estimate          SE                      t stat           p value
                                                                                                       ronal subtypes. Recent studies indicate that oligodendrocyte
 (Intercept)            −3.044                  0.581             −5.237           1.63 × 10⁻⁷         regeneration from endogenous progenitors is sufficient to restore
 diam                     5.836                 1.034              5.646           1.64 × 10⁻⁸         myelin levels in layer I after demyelination; however, the pattern
 type_NTSR1             −15.215           2573735.335              0.000           1.000
                                                                                                       of myelin along individual axons is altered after remyelination,
 type_NXPH4              −1.470                 0.650             −2.262           0.024
 type_RBP4               −1.014                 0.457             −2.219           0.026
                                                                                                       with a large fraction of sheaths established on previously
 type_PO                −0.481                  0.389             −1.235           0.217               unmyelinated axon segments37,51. It is not yet known if this
 type_VM                  0.047                 0.367              0.127           0.899               reorganization is equally distributed across different neuronal
                                                                                                       subtypes. If the cell-intrinsic features that shape myelination
 Estimated coefficients for the binomial generalized linear model of data in Fig. 4, whereby the        during development are altered by demyelination, it could result
 probability of an axon being myelinated is predicted by axon diameter and neuronal subtype (P
 (myelinated) ~ 1 + diameter + subtype). Note: Coefficient estimates and p values are relative to PV.   in profound alterations in circuit properties, despite restoring
                                                                                                       myelin levels. To address this question, we used longitudinal
                                                                                                       in vivo imaging to compare the myelination patterns of individual
and 0.8 μm [0.11, 0.89] (NXPH4) (Fig. 4e). Together, these results
                                                                                                       PV and VM axons before and after remyelination, as they have
indicate that myelination of cortical axons does not follow a
                                                                                                       the highest probability of being myelinated and the largest var-
strict diameter–myelination relationship similar to that
                                                                                                       iation in myelination patterns (Figs. 1a, b, and 4e). To achieve
described in the PNS12–14, and that other neuron intrinsic factors
                                                                                                       simultaneous, two-color labeling of PV and VM axons in vivo,

NATURE COMMUNICATIONS | (2021)12:4767 | https://doi.org/10.1038/s41467-021-25035-2 | www.nature.com/naturecommunications                                               7
ARTICLE NATURE COMMUNICATIONS | https://doi.org/10.1038/s41467-021-25035-2 Fig. 5 Overall subtype-specific myelination patterns are restored despite remodeling of individual axons. a Experimental timeline. b Example image from a PV-Cre; Ai9 mouse injected with AAV-EGFP into thalamic VM. SCoRe signal from the same region is overlaid on top of the fluorescent dual-colored image acquired with two-photon microscopy. Right panel shows a few myelinated axons of both neuronal subtypes extracted from the left panel. Scale bar, 30 μm. c Axon traces from an example 3-week cuprizone timecourse. Left panel shows PV axon traces (white) and the associated myelin segments traced from the corresponding SCoRe image (magenta). Right panel shows same region with the surviving baseline axon traces overlaid with the positions of SCoRe segments traced at 5 weeks of recovery (green). Yellow arrowhead indicates example axon that had a net loss in length myelinated, while the cyan arrowhead indicates a portion of axon which gained myelination. Scale bar, 100 μm. d, Pooled data from remyelinated PV and VM axons showing the net change in PLM between baseline and 5 weeks recovery where –100% represents an axon going from fully myelinated to fully unmyelinated, and +100% represents an axon that went from unmyelinated to fully myelinated. Dashed lines bordering 0% (solid line) reflect the tracing error as calculated by the average negative ΔPLM from axons of the respective subtype traced in control animals (Supplemental Fig. 2, see text for additional details). e and f Scatter plots showing the relationship between the PLM of an axon at baseline and its PLM at five weeks recovery from cuprizone for PV axons (e) and VM axons (f). The solid red line (y = x) is the identity line (no change between baseline and 5 weeks recovery) and the red dashed lines are the error based on control traces (as in (d)). The black line is the best fit found by regression and the black dotted lines are the 95% confidence bounds. g and h Data as plotted in (e, f) readjusted to include the ΔPLM of each axon in the linear model (adjusted formula: PLM at 5 weeks recovery ~ 1 + baseline PLM + baseline PLM: ΔPLM; g, PV axons; h VM axons). The solid line is the fit and dotted lines are the 95% confidence bounds. Source data and statistical tests are provided as a Source Data file. AAV encoding EGFP was injected into the VM nucleus of the To determine if remyelination alters the distribution of myelin thalamus of PV-Cre;Ai9 mice. Cranial windows were then along with individual PV and VM axons, each myelin internode installed over the somatosensory barrel field before mice under- was traced along each labeled axon within the imaging volume went a 3-week cuprizone protocol shown previously to almost before cuprizone and after recovery. During this timeframe, there entirely demyelinate the superficial layers of cortex37,52 (Fig. 5a). were no large-scale alterations in axonal morphology such as Two photon imaging was used to record the distribution of PV branching, which can strongly impact myelination54. Our analysis and VM axons in layer I and spectral confocal reflectance revealed that although the percent change in axon length (SCoRe) microscopy53 was used to identify myelin sheaths in the myelinated (ΔPLM) for individual axons varied considerably same field of view (Fig. 5b). Comparison of myelin patterns (Fig. 5c), there was little change in average PLM across the before and after oligodendrocyte regeneration using this approach population of axons for either PV or VM neurons (PV: −3.7 ± revealed that the majority of axons of both neuronal subtypes 1.9%, VM: −7.7 ± 1.6%) (Fig. 5d). Together, these results indicate were myelinated before cuprizone exposure and remyelinated that while the pattern of myelination along individual axons in after 5 weeks of recovery (PV: 140/197 axons; VM: 150/214 the cortex changes after a demyelinating event, the overall myelin axons; n = 12 regions from 9 mice) (Fig. 5c), a time point at content on PV and VM axons is restored by remyelination. which myelin density is fully restored37 (Supplemental Fig. 3). To define the relationship between baseline and recovery This result indicated that the high preference for myelinating myelin patterns, we plotted the PLM for individual PV and VM these axons is preserved after demyelination. axons at five weeks recovery versus baseline and fit a linear model 8 NATURE COMMUNICATIONS | (2021)12:4767 | https://doi.org/10.1038/s41467-021-25035-2 | www.nature.com/naturecommunications
NATURE COMMUNICATIONS | https://doi.org/10.1038/s41467-021-25035-2                                                                          ARTICLE

to these distributions (Fig. 5e, f). There was a strong positive                PV axon remyelination remains proportional in regions with
correlation between baseline PLM and recovery PLM for                           lower oligodendrocyte regeneration. The extent of oligoden-
individual axons (PV: R2 = 0.389, p = 1. 01 × 10–19; VM: R2 =                   drocyte regeneration after cuprizone exposure varies dramatically
0.531, p = 2.86 × 10⁻³⁰), with minimal bias from differences in                 between cortical layers; after two months of recovery, oligoden-
axon length traced (PV: R2 = 0.049, VM: R2 = 0.019) (Fig. 5e, f).               drocytes are restored to their original density in layer I, but reach
Most values in these plots were close to the identity line (0%                  only ~50% of their original density in layer II/III37. If axon
ΔPLM) at PLM values > 60% (solid red lines, Fig. 5e, f), in                     selection by oligodendrocytes during regeneration follows rules
accordance with prior in vivo studies indicating that continuously              similar to that observed in the naïve brain, then remyelination of
myelinated axons are the most likely to be remyelinated37,51.                   PV axons in these deeper cortical layers should remain propor-
However, for both PV and VM neurons there were more well-                       tional to the overall myelin density. Alternatively, PV axons may
myelinated axons below the identity line, suggesting that there                 be preferentially remyelinated when oligodendrogenesis is sup-
was a slight trend toward loss of myelin after recovery (ΔPLM for               pressed to rapidly restore inhibition. To determine the extent of
axons with >75% PLM at baseline, PV: median: –6%, range:                        PV axon remyelination in layer II/III, a genetic labeling approach
[–82%, 15%]; VM: median: –8%, range: [–90%, 10%]) (Fig. 5e, f).                 was used to visualize myelin rather than SCoRe imaging, because
Conversely, many unmyelinated or weakly myelinated axons with                   light is only reflected by myelin that is approximately perpendi-
low PLM at baseline had large gains in myelination during                       cular to the incident light53. While SCoRe imaging is effective for
recovery (ΔPLM for axons with
ARTICLE                                                                 NATURE COMMUNICATIONS | https://doi.org/10.1038/s41467-021-25035-2

remyelination with the same probability, independent of the                  myelination25,60–63, suggesting that these axon–oligodendrocyte
amount of myelin that is available, providing further evidence               interactions could bias this selection process by regulating
that target selection by oligodendrocytes is opportunistic and               extension of lamellar sheaths from nascent oligodendrocyte
governed by axon properties.                                                 processes60,64,65, with the relative amounts of these proteins
                                                                             accounting for the bias in subtype remyelination observed. As
                                                                             neuronal activity can promote both oligodendrogenesis and
Discussion
                                                                             myelination of some neurons20–22,66–68, it is possible that activity
The cerebral cortex contains axons that arise from the local col-
                                                                             adjusts myelination probability by altering the expression,
laterals and long-range projections of a diverse population of
                                                                             trafficking, or localization of these proteins. Indeed, a recent
neurons. Despite the presence of axons of suitable size and the
                                                                             study reported that life experience can specifically modulate the
persistence of oligodendrocyte progenitors, myelin density in the
                                                                             myelination of PV axons without affecting myelination of nearby
cortex remains low. The diverse patterns of myelin observed
                                                                             excitatory axons myelinated by the same oligodendrocytes69.
along cortical axons, even among axons from distinct neuron
                                                                                The vast territory available for the addition of new myelin on
subtypes, raise many new questions about the mechanisms that
                                                                             axons that have a high probability of being myelinated (e.g. large
establish these patterns and the impact of this complex organi-
                                                                             diameter, low branching) and the persistence of oligodendrocyte
zation on myelin repair. Our in vivo results reaffirm that axonal
                                                                             progenitors creates opportunities for circuit modification in
diameter is a key factor in determining myelination status in this
                                                                             adulthood by increasing myelin content, a phenomenon termed
region, as neurons that had the largest axon diameters also had
                                                                             adaptive myelination. Indeed, motor learning, exposure to new
the highest myelin content, recapitulating in vitro studies showing
                                                                             environments, and other life experiences correlate with changes
that cortical oligodendrocytes rarely form wraps around struc-
                                                                             in oligodendrogenesis, myelination, and altered network
tures
NATURE COMMUNICATIONS | https://doi.org/10.1038/s41467-021-25035-2 ARTICLE
can be preserved. It is important to note that many of the axons experiments were performed in strict accordance with protocols approved by the
traced in this study extended outside of the bounds of the imaged Animal Care and Use Committee at Johns Hopkins University. The following
transgenic mouse lines were used in this study:
volumes. Thus, it is possible that the axons with large changes in Pvalb-IRES-Cre*80
PLM experienced equal and opposite changes outside the area Sst-IRES-Cre80
examined, resulting in precise restoration of myelin content GN220-Ntsr1-Cre45
(though not position) along individual axons. New advances that Rbp4-KL10045
allow imaging over larger areas of the cortex73 and at greater Nxph4-2A-CreERT2-D46
Rosa-CAG-LSL-tdTomato-WPRE (Ai9)*44
depths (three-photon excitation) may enable myelin to be Rosa-CAG-LSL-EYFP-WPRE (Ai3)44
visualized on individual axons across several millimeters of the Mobp-EGFP*81
cortex to resolve this question. *note: C57BL/6 congenic strains were used for cuprizone experiments81
PV and VM axons are the most highly myelinated axons For axon tracing in immunostained flatmounts, mice were aged to 5 months,
when cortical myelination has nearly plateaued. For in vivo-imaging experiments
investigated in this study; however, due to the high density and mice were 10–12 weeks of age when baseline images were acquired.
vast diversity of axons in layer I, the myelin on these two axon
populations represents less than half of the myelin in this region. CreER induction. To induce tdTomato expression in the NXPH4-CreER mice, 5-
While we did not determine the remyelination efficiency of other month-old mice were injected with 4-hydroxytamoxifen (4-HT, Sigma) dissolved
less myelinated neuronal subtypes, similar outcomes are likely. in sunflower seed oil (Sigma) and administered by i.p. injection twice daily for
Previous remyelination studies in layer I revealed that isolated 5 days at a dose of 100 mg/kg body weight. Mice were perfused 2 weeks from the
last day of tamoxifen injection.
sheaths on discontinuously myelinated axons were rarely
replaced37,51 and the number of isolated sheaths lost was
Viral injections. Five-month-old mice were anesthetized with isoflurane (induc-
approximately the same as those gained on previously unmye- tion, 5%, mixed with 1 L/min O2; maintenance, 1.5–2%, mixed with 0.5 L/min O2),
linated axon segments37. If myelination patterns were strongly and their scalps shaved with an electric trimmer. Mice were transferred to a
altered in these weakly myelinated axon populations, we would homeostatic heating pad set to 37 °C and their heads secured by ear bars on an
have expected the net ΔPLM to be significantly below zero, as Angle 2 stereotax. An incision was performed along the midline of the scalp to
expose the skull. Bregma was identified and zeroed in the Angle 2 software. The
myelin would be “transferred” to other weakly myelinated skull was leveled by ensuring z measurements 2 mm left and right from bregma
populations by regenerated oligodendrocytes. differed byARTICLE NATURE COMMUNICATIONS | https://doi.org/10.1038/s41467-021-25035-2
Table 5 Key resources.
Primary antibodies
Target Protein/markers Host species Source Catalog # Identifier Additional information
GFP Chicken Aves Lab GFP-1020 RRID:AB_2307313 1:4000
mCherry Goat SicGen AB0040 RRID:AB_2333092 1:5000
MBP Mouse Sternberger 808401 RRID:AB_2564741 1:2000
MBP Chicken Aves Lab F-1005 RRID:AB_2313550 1:500
Secondary antibodies
Target species Conjugate Source Dilution Catalog # Identifier
Anti-mouse Cy5 Jackson Immuno 1:2000 715-175-151 RRID:AB_2340820
Anti-goat Cy3 Jackson Immuno 1:2000 705-166-147 RRID:AB_2340413
Anti-chicken Alexa 488 Jackson Immuno 1:2000 703-546-155 RRID:AB_2340376
Anti-chicken Cy5 Jackson Immuno 1:2000 703-006-155 RRID:AB_2340347
Software and algorithms
Name Source Identifier
ZEN Blue/Black Zeiss RRID:SCR_013672
Fiji http://fiji.sc RRID:SCR_002285
Simple Neurite Tracer and SNT https://imagej.net/SNT RRID:SCR_016566
Adobe Illustrator CS4 Adobe RRID:SCR_014198
MATLAB Mathworks RRID:SCR_001622
spyglass IstoVisio RRID:SCR_017961
with dental cement (C and B Metabond) for head stabilization. The head plate was Cuprizone administration. At 9–11 weeks of age, male and female mice were fed a
then fixed in place by clamping head bars while a three-millimeter diameter cir- diet of milled, irradiated 18% protein rodent diet (Teklad Global) alone (control) or
cular region of the skull over the somatosensory cortex (–1.5 mm posterior and supplemented with 0.2% w/w bis(cyclohexanone) oxaldihydrazone (Cuprizone,
3.5 mm lateral from bregma) was removed using a high-speed dental drill. A piece Sigma-Aldrich) in gravity-fed food dispensers for three weeks. Both control and
of the cover glass (VWR, No. 1) was placed in the craniotomy and sealed with cuprizone-treated mice were returned to a regular pellet diet after three weeks
cyanoacrylate glue (VetBond (3 M) and Krazy Glue). during the recovery period37.
In vivo imaging. Baseline images were acquired 2–3 weeks after cranial window Image collection. Images were acquired using a confocal laser-scanning microscope
installation, and mice with clear windows were randomly assigned to cuprizone or (Zeiss LSM 510 Meta; Zeiss LSM 710; Zeiss LSM 880). For population analyses
control conditions. Due to the rarity of animals having the correct genotype, (Fig. 2), 5 × 5 tiled z stacks (650 μm × 650 μm × 40 μm, z slice thickness: 0.5 μm,
successful intracranial viral injections, and clear windows, some animals with bone pinhole set to 1 Airy unit for each wavelength, 2048 × 2048 pixels) were acquired with
regrowth under the window at 2–3 weeks after the cranial window surgery had a Zeiss ×63 oil objective (NA 1.4) in the primary somatosensory cortex in a cortical
their windows repaired. Cyanoacrylate glue holding the original coverslip was flatmount. Regional comparisons for PV axons used 2 × 2 tiled z stacks acquired at
carefully drilled away, the coverslip was removed, and invading bone into the ×63. For diameter analysis, individual z stacks were acquired at ×63 in Zeiss Airyscan
window region was cut away before gluing in a new glass coverslip. Mice with mode (59.65 μm × 59.65 μm or 78.01 μm × 78.01 μm, 2048 × 2048 pixels, z slice
repaired windows recovered for an additional week before checking the window thickness: 0.21 μm, pinhole: 1 Airy unit). Tiled overviews of flatmounts and coronal
clarity and taking baseline images. This procedure was performed for mice assigned sections were acquired at ×4 with a Keyence epifluorescence microscope.
to both control and cuprizone-treated groups.
During each imaging session (at baseline, 1 week recovery, and 5 weeks recovery),
Diameter calculations. Within high-resolution z stacks of each neuronal subtype,
intracranially injected PV-Cre; Ai9 mice were anesthetized with isoflurane (induction,
the distribution of gray values across the width of individual axons were averaged
5%; maintenance, 1.5–2%, mixed with 0.5 L/min O2 and fixed by their head plates in a
across a 2-μm length (ImageJ “Plot Profile”), and the full-width at half maximum
custom stage. Two-photon images were collected using a Zeiss LSM 710 microscope
(FWHM) was used to represent the diameter. Two to three of these measurements
equipped with a GaAsP detector using a mode-locked Ti:sapphire laser (Coherent
were taken for a 35-μm segment of axon within the imaging volume and averaged
Ultra) tuned to 1000 nm. The average power at the sample during imaging wasNATURE COMMUNICATIONS | https://doi.org/10.1038/s41467-021-25035-2 ARTICLE
save for nodes of Ranvier) had PLM values > 100% if jitter in MBP traces was 7. Micheva, K. D. et al. A large fraction of neocortical myelin ensheathes axons of
higher than the axon traces leading to an artefactually higher total sheath length local inhibitory neurons. Elife 5, 1–29 (2016).
than total axon length. In these cases, PLM was manually set to 99%. 8. Stedehouder, J. et al. Fast-spiking parvalbumin interneurons are frequently
Mobp-EGFP sheaths were traced in syGlass (v 1.6.0) virtual reality software myelinated in the cerebral cortex of mice and humans. Cereb. Cortex 27,
using randomly selected 100 μm × 100 μm × 100 μm cubic ROIs (2 per ×20 imaged 5001–5013 (2017).
region) corresponding to ~130–230 μm depth from the pia. Subsequently, these 9. Hill, R. A., Li, A. M. & Grutzendler, J. Lifelong cortical myelin plasticity and
traces were corrected and labeled as belonging to PV-Cre; Ai9 or other axons in Fiji age-related degeneration in the live mammalian brain. Nat. Neurosci. 21,
using SNT. 683–695 (2018).
10. Hughes, E. G., Orthmann-Murphy, J. L., Langseth, A. J. & Bergles, D. E.
Image processing and analysis. Image stacks and time series were analyzed using Myelin remodeling through experience-dependent oligodendrogenesis in the
Fiji. Images used in figures were adjusted for brightness and contrast levels for clarity. adult somatosensory cortex. Nat. Neurosci. 21, 696–706 (2018).
In vivo z stacks were de-noised with a 3D median filter (1-pixel radius). SCoRe images 11. Tomassy, G. S. et al. Distinct profiles of myelin distribution along single axons
were first background subtracted (15-pixel rolling ball), 3D median filtered (1-pixel of pyramidal neurons in the neocortex. Science 344, 319–324 (2014).
radius), and all three channels were summed together for a final SCoRe channel used 12. Voyvodic, J. T. Target size regulates calibre and myelination of sympathetic
for tracing. Because virally expressed EGFP signal from VM thalamocortical axons axons. Nature 342, 430–433 (1989).
strongly bled through into the red channel at 1000 nm excitation, the green channel 13. Elder, G. A., Friedrich, V. L. & Lazzarini, R. A. Schwann cells and
was subtracted from the red channel before tracing tdTomato-positive PV axons. oligodendrocytes read distinct signals in establishing myelin sheath thickness.
Longitudinal image stacks were randomized for analysis and traced by a blinded J. Neurosci. Res. 65, 493–499 (2001).
experimenter and revised by a second blinded experimenter. Baseline and 5-week 14. Schröder, J. M., Bohl, J. & Brodda, K. Changes of the ratio between myelin
recovery time points were randomly assigned as “A” or “B” and experimenters always thickness and axon diameter in the human developing sural nerve. Acta
made original axon traces using the “A” time point. In some cases when the baseline Neuropathol. 43, 169–178 (1978).
was the “A” time point, traced axons were no longer visible in the recovery time point 15. Bechler, M. E., Byrne, L. & Ffrench-Constant, C. CNS myelin sheath lengths
(either by part of the imaged region being obscured by meningeal thickening/bone are an intrinsic property of oligodendrocytes. Curr. Biol. 25, 2411–2416
growth or by axonal degeneration, which occurred at low rates in both control (VM: (2015).
8 ± 5%, PV: 1 ± 1%) and cuprizone-treated (VM:14 ± 3%, PV: 3 ± 1%) animals). These 16. Mayoral, S. R., Etxeberria, A., Shen, Y.-A. A. A. A. & Chan, J. R. Initiation of
rates of loss were not significantly different between control and cuprizone conditions CNS myelination in the optic nerve is dependent on axon caliber. Cell Rep. 25,
(VM: p = 0.38, PV: p = 0.46, two-sample unpaired t-test). In these cases, missing 544–550e3 (2018).
axons were excluded from analysis. Axons that remained unmyelinated at both 17. Remahl, S. & Hildebrand, C. Changing relation between onset of myelination
timepoints (PLM = 0) were not included in linear models so as not to strongly bias and axon diameter range in developing feline white matter. J. Neurol. Sci. 54,
trends of myelin replacement. 33–45 (1982).
18. Waxman, S. G. & Sims, T. J. Specificity in central myelination: evidence for
Statistical analysis. Statistical analyses were performed with MATLAB (Math- local regulation of myelin thickness. Brain Res. 292, 179–185 (1984).
works) and Microsoft Excel. Significance was typically determined using 19. Chong, S. Y. C. et al. Neurite outgrowth inhibitor Nogo-A establishes spatial
Kruskal–Wallis one-way ANOVA with Dunn–Šidák correction for multiple segregation and extent of oligodendrocyte myelination. Proc. Natl Acad. Sci.
comparisons. Violin plots were created using violin.m83. Each figure legend or the USA 109, 1299–1304 (2012).
text otherwise contains the number of animals used, statistical tests used to mea- 20. Demerens, C. et al. Induction of myelination in the central nervous system by
sure significance, and the corresponding significance level (p value). Data are electrical activity. Proc. Natl Acad. Sci. USA 93, 9887–9892 (1996).
reported as mean ± standard error, or prediction [lower 95% confidence 21. Stevens, B., Porta, S., Haak, L. L., Gallo, V. & Fields, R. D. Adenosine: a
bound, upper 95% confidence bound], and p < 0.05 was considered statistically neuron-glial transmitter promoting myelination in the CNS in response to
significant. action potentials. Neuron 36, 855–868 (2002).
22. Gibson, E. M. et al. Neuronal activity promotes oligodendrogenesis and
Reporting summary. Further information on research design is available in the Nature adaptive myelination in the mammalian brain. Science 344, 1252304 (2014).
Research Reporting Summary linked to this article. 23. Wake, H., Lee, P. R. & Fields, R. D. Control of local protein synthesis and
initial events in myelination by action potentials. Science 333, 1647–1651
(2011).
Data availability 24. Wake, H. et al. Nonsynaptic junctions on myelinating glia promote preferential
All published image data, code, tools, and reagents will be shared on an unrestricted myelination of electrically active axons. Nat. Commun. 6, 7844 (2015).
basis; requests should be directed to the corresponding authors. Raw tracing data files are 25. Redmond, S. A. et al. Somatodendritic expression of JAM2 inhibits
available at https://github.com/clcall/Call_Bergles_2021_CTSM84 and summary data is oligodendrocyte myelination. Neuron 91, 824–836 (2016).
included in the Source Data file. Source data are provided with this paper. 26. Bø, L., Vedeler, C. A., Nyland, H. I., Trapp, B. D. & Mørk, S. J. Subpial
demyelination in the cerebral cortex of multiple sclerosis patients. J.
Code availability Neuropathol. Exp. Neurol. 62, 723–732 (2003).
MATLAB scripts and ImageJ macros are available at https://github.com/clcall/ 27. Howell, O. W. et al. Meningeal inflammation is widespread and linked to
Call_Bergles_2021_CTSM84. cortical pathology in multiple sclerosis. Brain 134, 2755–2771 (2011).
28. Chang, A. et al. Cortical remyelination: a new target for repair therapies in
multiple sclerosis. Ann. Neurol. 72, 918–926 (2012).
Received: 29 April 2021; Accepted: 16 July 2021; 29. Kidd, D. et al. Cortical lesions in multiple sclerosis. Brain 122(Part 1), 17–26
(1999).
30. Roosendaal, S. et al. Accumulation of cortical lesions in MS: relation with
cognitive impairment. Mult. Scler. J. 15, 708–714 (2009).
31. Nielsen, A. S. et al. Contribution of cortical lesion subtypes at 7T MRI to
physical and cognitive performance in MS. Neurology 81, 641–649 (2013).
References 32. Sacco, R. et al. Cognitive impairment and memory disorders in
1. Cauller, L. Layer I of primary sensory neocortex: where top-down converges relapsing–remitting multiple sclerosis: the role of white matter, gray matter
upon bottom-up. Behav. Brain Res. 71, 163–170 (1995). and hippocampus. J. Neurol. 262, 1691–1697 (2015).
2. Xu, N. L. et al. Nonlinear dendritic integration of sensory and motor input 33. Muhlert, N. et al. The grey matter correlates of impaired decision-making in
during an active sensing task. Nature. 492, 247–251 (2021). multiple sclerosis. J. Neurol. Neurosurg. Psychiatry 86, 530–536 (2015).
3. Cruikshank, S. J. et al. Thalamic control of layer 1 circuits in prefrontal cortex. 34. Zonouzi, M. et al. Individual oligodendrocytes show bias for inhibitory axons
J. Neurosci. 32, 17813–17823 (2012). in the neocortex. Cell Reports 27, 2799–2808 (2019).
4. Cauller, L. J., Clancy, B. & Connors, B. W. Backward cortical projections to 35. Stedehouder, J. & Kushner, S. A. Myelination of parvalbumin interneurons: a
primary somatosensory cortex in rats extend long horizontal axons in layer I. parsimonious locus of pathophysiological convergence in schizophrenia. Mol.
J. Comp. Neurol. 390, 297–310 (1998). Psychiatry 22, 4–12 (2017).
5. Rubio-Garrido, P., Pérez-De-Manzo, F., Porrero, C., Galazo, M. J. & Clascá, F. 36. Pajevic, S., Basser, P. J. & Fields, R. D. Role of myelin plasticity in oscillations
Thalamic input to distal apical dendrites in neocortical layer 1 is massive and and synchrony of neuronal activity. Neuroscience 276, 135–147 (2014).
highly convergent. Cereb. Cortex 19, 2380–2395 (2009). 37. Orthmann-Murphy, J. et al. Remyelination alters the pattern of myelin in the
6. Zilles, K., Palomero-Gallagher, N. & Amunts, K. Myeloarchitecture and maps cerebral cortex. Elife 9, 1–61 (2020).
of the cerebral cortex. In Brain Mapping: An Encyclopedic Reference (ed. Toga, 38. Olsen, S. R., Bortone, D. S., Adesnik, H. & Scanziani, M. Gain control by layer
A. W.) Vol. 2 137–156 (Elsevier Inc., 2015). six in cortical circuits of vision. Nature 483, 47–54 (2012).
NATURE COMMUNICATIONS | (2021)12:4767 | https://doi.org/10.1038/s41467-021-25035-2 | www.nature.com/naturecommunications 13ARTICLE NATURE COMMUNICATIONS | https://doi.org/10.1038/s41467-021-25035-2
39. Denman, D. J. & Contreras, D. Complex effects on in vivo visual responses by 71. Dutta, D. J. et al. Regulation of myelin structure and conduction velocity by
specific projections from mouse cortical layer 6 to dorsal lateral geniculate perinodal astrocytes. Proc. Natl Acad. Sci. USA 115, 11832–11837 (2018).
nucleus. J. Neurosci. 35, 9265–9280 (2015). 72. Hughes, E. G., Kang, S. H., Fukaya, M. & Bergles, D. E. Oligodendrocyte
40. Bortone, D. S., Olsen, S. R. & Scanziani, M. Translaminar inhibitory cells progenitors balance growth with self-repulsion to achieve homeostasis in the
recruited by layer 6 corticothalamic neurons suppress visual cortex. Neuron adult brain. Nat. Neurosci. 16, 668–676 (2013).
82, 474–485 (2014). 73. Ghanbari, L. et al. Cortex-wide neural interfacing via transparent polymer
41. Viswanathan, S., Sheikh, A., Looger, L. L. & Kanold, P. O. Molecularly defined skulls. Nat. Commun. 10, 1500 (2019).
subplate neurons project both to thalamocortical recipient layers and 74. Hamada, M. S. & Kole, M. H. P. Myelin loss and axonal ion channel
thalamus. Cereb. Cortex 27, 4759–4768 (2017). adaptations associated with gray matter neuronal hyperexcitability. J.
42. Clancy, B. & Cauller, L. J. Widespread projections from subgriseal neurons Neurosci. 35, 7272–7286 (2015).
(layer VII) to layer I in adult rat cortex. J. Comp. Neurol. 407, 275–286 (1999). 75. Hamada, M. S., Popovic, M. A. & Kole, M. H. P. Loss of saltation and
43. Ibrahim, L. A. et al. Cross-modality sharpening of visual cortical processing presynaptic action potential failure in demyelinated axons. Front. Cell.
through layer-1-mediated inhibition and disinhibition. Neuron 89, 1031–1045 Neurosci. 11, 1–11 (2017).
(2016). 76. Werneburg, S. et al. Targeted complement inhibition at synapses prevents
44. Madisen, L. et al. A robust and high-throughput Cre reporting and microglial synaptic engulfment and synapse loss in demyelinating disease.
characterization system for the whole mouse brain. Nat. Neurosci. 13, Immunity 52, 167–182.e7 (2020).
133–140 (2010). 77. Rankin, K. A. et al. Selective estrogen receptor modulators enhance CNS
45. Gong, S. et al. Targeting Cre recombinase to specific neuron populations with remyelination independent of estrogen receptors. J. Neurosci. 39, 2184–2194
bacterial artificial chromosome constructs. J. Neurosci. 27, 9817–9823 (2007). (2019).
46. Harris, J. A. et al. Anatomical characterization of Cre driver mice for neural 78. Mei, F. et al. Accelerated remyelination during inflammatory demyelination
circuit mapping and manipulation. Front. Neural Circuits. 8, 76 (2014). prevents axonal loss and improves functional recovery. Elife 5, e18246 (2016).
47. Hunt, B. A. E. et al. Relationships between cortical myeloarchitecture and 79. Mei, F. et al. Identification of the kappa-opioid receptor as a therapeutic target
electrophysiological networks. Proc. Natl Acad. Sci. USA 113, 13510–13515 (2016). for oligodendrocyte remyelination. J. Neurosci. 36, 7925–7935 (2016).
48. Nieuwenhuys, R. & Broere, C. A. J. A detailed comparison of the 80. Taniguchi, H. et al. A resource of Cre driver lines for genetic targeting of
cytoarchitectonic and myeloarchitectonic maps of the human neocortex GABAergic. Neurons Cereb. Cortex Neuron 71, 995–1013 (2011).
produced by the Vogt–Vogt school. Brain Struct. Funct. 1, 3 (2020). 81. Kang, S. H. et al. Degeneration and impaired regeneration of gray matter
49. Whissell, P. D., Cajanding, J. D., Fogel, N. & Kim, J. C. Comparative density of oligodendrocytes in amyotrophic lateral sclerosis. Nat. Neurosci. 16, 571–579
CCK- and PV-GABA cells within the cortex and hippocampus. Front. (2013).
Neuroanat. 9, 124 (2015). 82. Longair, M. H., Baker, D. A. & Armstrong, J. D. Simple Neurite Tracer: open
50. Stedehouder, J. et al. Local axonal morphology guides the topography of source software for reconstruction, visualization and analysis of neuronal
interneuron myelination in mouse and human neocortex. Elife 8, 1–28 (2019). processes. Bioinformatics 27, 2453–2454 (2011).
51. Snaidero, N. et al. Myelin replacement triggered by single-cell demyelination 83. Hoffmann, H. violin.m—simple violin plot using matlab default kernal density
in mouse cortex. Nat. Commun. 11, 4901 (2020). estimation. INRES (University of Bonn, 2015).
52. Bacmeister, C. M. et al. Motor learning promotes remyelination via new and 84. Call, C. clcall/Call_Bergles_2021_CTSM(Version v1.1). Zenodo. https://doi.
surviving oligodendrocytes. Nat. Neurosci. 23, 819–831 (2020). org/10.5281/zenodo.5083725 (2021).
53. Schain, A. J., Hill, R. A. & Grutzendler, J. Label-free in vivo imaging of 85. Papadopoulos, G. C., Parnavelas, J. G. & Buijs, R. M. Light and electron
myelinated axons in health and disease with spectral confocal reflectance microscopic immunocytochemical analysis of the serotonin innervation of the
microscopy. Nat. Med. 20, 443–449 (2014). rat visual cortex. J. Neurocytol. 16, 883–892 (1987).
54. Stedehouder, J., Brizee, D., Shpak, G. & Kushner, S. A. Activity-dependent 86. Papadopoulos, G. C., Parnavelas, J. G. & Buijs, R. M. Light and electron
myelination of parvalbumin interneurons mediated by axonal morphological microscopic immunocytochemical analysis of the noradrenaline innervation
plasticity. J. Neurosci. 38, 3631–3642 (2018). of the rat visual cortex. J. Neurocytol. 18, 1–10 (1989).
55. Lee, S. et al. A culture system to study oligodendrocyte myelination processes 87. Papadopoulos, G. C., Parnavelas, J. G. & Buijs, R. M. Light and electron
using engineered nanofibers. Nat. Methods 9, 917–922 (2012). microscopic immunocytochemical analysis of the dopamine innervation of the
56. Kang, S. H., Fukaya, M., Yang, J. K., Rothstein, J. D. & Bergles, D. E. NG2+ rat visual cortex. J. Neurocytol. 18, 303–310 (1989).
CNS glial progenitors remain committed to the oligodendrocyte lineage in
postnatal life and following neurodegeneration. Neuron 68, 668–681 (2010).
57. Psachoulia, K., Jamen, F., Young, K. M. & Richardson, W. D. Cell cycle dynamics Acknowledgements
of NG2 cells in the postnatal and ageing brain. Neuron Glia Biol. 5, 57 (2009). We thank Dr. S.P. Brown and previous lab members for generously providing Cre lines
58. Young, K. M. et al. Oligodendrocyte dynamics in the healthy adult CNS: used in this study, Dr. M. Pucak for technical assistance and impeccable instrument
evidence for myelin remodeling. Neuron 77, 873–885 (2013). maintenance, T. Shelly for machining expertise, T. Bhardwaj and J.H. Kim for assistance
59. Zhu, X. et al. Age-dependent fate and lineage restriction of single NG2 cells. in axon tracing, J. Orthmann-Murphy for assistance in cranial window surgeries, and
Development 138, 745–753 (2011). members of the Bergles laboratory for insightful discussions. C. Call was supported by a
60. Almeida, R. G. The rules of attraction in central nervous system myelination. National Science Foundation Graduate Research Fellowship (DGE-1746891). Funding
Front. Cell. Neurosci. 12, 367 (2018). was provided by grants from the NIH (NS051509, NS050274, NS080153), and the
61. Mi, S. et al. LINGO-1 negatively regulates myelination by oligodendrocytes. Dr. Miriam and Sheldon G. Adelson Medical Research Foundation to D. Bergles.
Nat. Neurosci. 8, 745–751 (2005).
62. Linneberg, C., Harboe, M. & Laursen, L. S. Axo-glia interaction preceding Author contributions
CNS myelination is regulated by bidirectional Eph-ephrin signaling. ASN C.L.C. conceived of and designed experiments, collected data, performed analyses, and wrote
Neuro 7, 1–17 (2015). the manuscript. D.E.B. conceived of and designed experiments and wrote the manuscript.
63. Brinkmann, B. G. et al. Neuregulin-1/ErbB signaling serves distinct functions
in myelination of the peripheral and central nervous system. Neuron 59,
581–595 (2008). Competing interests
64. Zuchero, J. B. et al. CNS myelin wrapping is driven by actin disassembly. Dev. The authors declare no competing interests.
Cell 34, 152–167 (2015).
65. Snaidero, N. et al. Myelin membrane wrapping of CNS axons by PI(3,4,5)P3-
dependent polarized growth at the inner tongue. Cell 156, 277–290 (2014).
Additional information
Supplementary information The online version contains supplementary material
66. Ishibashi, T. et al. Astrocytes promote myelination in response to electrical
available at https://doi.org/10.1038/s41467-021-25035-2.
impulses. Neuron 49, 823–832 (2006).
67. Mitew, S. et al. Pharmacogenetic stimulation of neuronal activity increases
Correspondence and requests for materials should be addressed to D.E.B.
myelination in an axon-specific manner. Nat. Commun. 9, 1–16 (2018).
68. Hines, J. H., Ravanelli, A. M., Schwindt, R., Scott, E. K. & Appel, B. Neuronal Peer review information Nature Communications thanks the anonymous reviewer(s) for
activity biases axon selection for myelination in vivo. Nat. Neurosci. 18, their contribution to the peer review of this work. Peer reviewer reports are available.
683–689 (2015).
69. Yang, S. M., Michel, K., Jokhi, V., Nedivi, E. & Arlotta, P. Neuron class- Reprints and permission information is available at http://www.nature.com/reprints
specific responses govern adaptive myelin remodeling in the neocortex.
Science 370, eabd2109 (2021).
Publisher’s note Springer Nature remains neutral with regard to jurisdictional claims in
70. Xin, W. & Chan, J. R. Myelin plasticity: sculpting circuits in learning and
published maps and institutional affiliations.
memory. Nat. Rev. Neurosci. 21, 682–694 (2020).
14 NATURE COMMUNICATIONS | (2021)12:4767 | https://doi.org/10.1038/s41467-021-25035-2 | www.nature.com/naturecommunicationsYou can also read