Munich, 4-5 July 2019 Refugee shelters, Neighbourhood Quality and Electoral Outcomes in Germany - Jakob Hennig - ifo Institut
←
→
Page content transcription
If your browser does not render page correctly, please read the page content below
Munich, 4–5 July 2019

Refugee shelters, Neighbourhood Quality
and Electoral Outcomes in Germany
Jakob Hennig
Refugee shelters, Neighbourhood Quality
and Electoral Outcomes in Germany

Jakob Hennig∗

Toulouse School of Economics
and Institute For Advanced Study in Toulouse

  Link to the latest version

Abstract

Does refugee immigration affect the perceived quality of neighbourhood amenities, and is this an
important factor for the opposition to immigration? In this paper, I use real estate listings and
online reviews of businesses and public places to demonstrate neighbourhood change due to the
establishment of a refugee shelter. The setting is Berlin during the European refugee crisis of
2015. Local authorities had to scramble to find suitable locations for refugee shelters; I show that
these locations did not differ from control locations in terms of real estate prices, online reviews or
political outcomes before immigration. When a shelter was established, rental prices and ratings
for existing places declined in the immediate vicinity. Additionally, I show that the anti-immigrant
German AfD party received a higher share of the vote near the refugee shelters. However, these
effects are relatively small, and the measured decline in perceived neighbourhood quality is at most
a partial mechanism through which shelters affect voting outcomes (an alternative mechanism
could be the increased salience of the continent-wide crisis in the affected areas). The effect on
rental prices and ratings is also very local, while the effect on voting outcomes is significant even
at a greater distance.
   ∗
     I would like to thank Quy-Toan Do, Anna Maria Mayda, François Poinas, and Paul Seabright for
their helpful discussions, as well as numerous participants in internal workshops at TSE and Georgetown
University, and at the MENA Chief Economist Seminar Series at the World Bank. All remaining errors are
my own. I am grateful for financial support from the IAST LabEx and the Jean-Jacques Laffont Foundation.

                                                   1
JEL Classification: D72, F22, J15, R23

                                         2
1 Introduction
Immigration has been one of the central issues in recent European and US electoral cam-
paigns. The European refugee crisis of 2015 in particular has received strong attention,
and in Germany, it is widely understood to be the main driver behind the rise of the right-
wing AfD party.1 What explains this opposition to immigration?
One possibility is that voters oppose immigration out of economic self-interest, for
example if their job security or wages are threatened. This view is supported by a lit-
erature showing negative effects of low-skilled immigration on wages and employment
of low-skilled natives (e.g. Card (2001), Borjas (2003), Borjas and Monras (2017)); at
the same time, it is especially low-skilled individuals who oppose immigration (Scheve
and Slaughter (2001), Mayda (2006), Facchini and Mayda (2009)). On the other hand,
Facchini et al. (2013) show that low-skilled natives are more hostile to immigration even
in a context where immigrants are high-skilled, and Rozo and Vargas (2018) show that
only culturally more distant international refugees provoke a backlash, whereas internally
displaced persons help the left-wing, more pro-immigration party.
Therefore, anxiety over cultural change, weakened social norms and declining quality
of local amenities may be the more important channels. Using survey data, Card et al.
(2012) show that such concerns for local amenities are more predictive of opposition to
immigration than labor market concerns (see also Dustmann and Preston (2007), Hain-
mueller and Hopkins (2014) and Hainmueller et al. (2015)). There are however few stud-
ies on how the quality of amenities changes due to immigration or ethnic heterogeneity,
and even fewer which investigate whether this is an important mechanism driving voting
outcomes.
In this paper, I investigate these questions in the context of the refugee crisis of 2014-
2016 in Berlin. I use real estate data from the largest German listings website, immo-
bilienscout24.de, to show how rental prices are affected by the presence of a refugee shel-
ter. Additionally, I use place-ratings from the website Foursquare to show changes in how
these neighbourhoods are perceived. The majority of Foursquare places are businesses
such as restaurants and shops, but public places such as parks and metro stations are also
included. Rental prices decline by 3%, and a rating given to an existing place becomes
1
A post-election survey of AfD voters revealed that 92% of respondents thought that “the party (AfD)
mainly exists to change the refugee policies with its initiatives”, while 97% said that they feared a loss of
German culture due to immigration (Infratest/dimap (2017))
320% less likely to be positive when a refugee shelter opens nearby. These phenomena
point to a perceived decline in the quality of the neighbourhood. There is some evidence
for increased creation of new businesses near refugee shelters, especially Turkish and
Middle Eastern restaurants, which is consistent with neighbourhood changes which cater
to the new inhabitants. Additionally, I show that in the electoral districts closest to refugee
shelters, the percentage of voters voting for the AfD party increased by 10%. This is true
both for the 2016 Berlin Senate Elections and the 2017 Federal Elections.
I also discuss the relevance of the decline in rental prices and ratings as a channel
for the voting outcomes. Using these as intermediate outcomes changes the quantitative
importance of proximity to a refugee shelter only moderately. I demonstrate that this
method is likely biased in the direction of overestimating the importance of the rental
price and ratings channel. Furthermore, areas with many public venues, such as parks and
squares, experienced an especially strong decline in ratings when a shelter was opened
nearby. However, these areas did not see a larger increase in right-wing voting. Similarly,
the effect of shelters on rental prices and ratings is limited to very nearby places, while
their effect on voting has a much wider radius.
These findings underline that the effect of shelters on right-wing voting mainly works
through channels other than the decline in neighbourhood quality reflected in rental prices
and ratings. One such alternative channel could be that the Europe-wide crisis is more
visible in areas near a refugee shelter, increasing the salience of this issue in the minds of
voters.
My main results come from difference-in-differences specifications. I use a complete
panel of shelter locations, capacities and dates of operation to define treatment variables.
To address concerns that the locations of refugee shelters are endogenously determined,
I show that these locations did not differ from non-treated areas in a large variety of
characteristics. This includes levels and trends of real estate prices, political outcomes,
ratings and the types of local businesses. In addition, the results are robust to the use of an
instrument, namely the availability of infrastructure to house refugees (in public schools).
The previous literature has shown that immigration and social heterogeneity can have
a negative impact on the quality of local amenities, by lowering the willingness to en-
gage in the community, contribute to public goods and sanction antisocial behaviour (see
e.g. Alesina et al. (1999), Alesina and La Ferrara (2000), Miguel and Gugerty (2005),
Dahlberg et al. (2012), and Algan et al. (2016)). I argue that the consequences of such
changes would affect not only the quality of housing, but also the restaurants, shops and
4public places present in the Foursquare database.
Housing outcomes can be affected in various ways by immigration. The demand from
immigrants can drive up prices in larger geographic areas (see e.g. Saiz (2007), Ottaviano
et al. (2012)); but there is also some evidence that more locally, prices can decline due to
natives valuing the area less (Accetturo et al. (2014) and Sá (2014)). This can lead to the
out-migration of natives and residential segregation, such as in the case of ’white flight’
from US urban centers (see Boustan (2010), Boustan et al. (2010)). The negative price
effects I show are unlikely to be partially offset by an opposing demand effect, given that
they are very locally constrained, and can therefore be interpreted more easily as a signal
of a decrease in the subjective quality of local amenities.
With respect to political outcomes, the larger literature has often found that immigra-
tion, particularly of individuals with low skills or strong cultural differences, increases
the electoral success of parties opposed to immigration (Barone et al. (2016), Halla et al.
(2017), Harmon (2017)). This effect may be limited to low-skilled voters (Mayda et al.
(2018)). Dustmann et al. (2016) and Gerdes and Wadensjö (2008) show an increase in
right-wing votes in Denmark caused by refugee allocation, while Dinas et al. (2016) show
the same for the Greek islands which house refugees. On the other hand, Steinmayr
(2016) finds a negative impact of refugees on right-wing votes in Austria, noting that
direct exposure can lead to decreased prejudice (the contact hypothesis).
Typically, the unit of observation in these papers are larger areas, e.g. counties or
municipalities, rather than neighbourhoods around conspicuous immigrant housing, but
Otto and Steinhardt (2014) find the same effect for neighbourhoods in Hamburg.
The wider economic consequences of refugee immigration have also received special
attention in recent years. Akgündüz et al. (2015), Del Carpio and Wagner (2015), Borjas
and Monras (2017), and Hennig (2018) focus on labour market changes, while Alix-
Garcia et al. (2018) and Altindag et al. (2018) show positive effects on prices and produc-
tion.
To this literature I add an investigation of a new and related outcome, namely how
businesses and other amenities in the neighbourhood change due to the establishment of a
refugee shelter. While the ratings are indeed negatively affected by the establishment of a
shelter, I conclude that the contemporaneous increase in support for right-wing parties is
not mainly a consequence of the neighbourhood decline, meaning that other mechanisms
musr also be at work.
5The paper is organized as follows: section 2 describes the data and the historical con-
text. Section 3 provides estimation results both on electoral outcomes and on the es-
tablishment and perceived quality of venues. Section 4 explores whether the decline in
real estate prices and ratings is a channel for the electoral impact. Section 5 discusses
the robustness of different specifications, including the IV specification, while section 6
concludes.
2 Data and historical background
2.1 The refugee crisis in Berlin
During the 2014-2016 European Refugee crisis, more than 70 Thousand initial applica-
tions for asylum were made in Berlin. This represents roughly 2% of Berlin’s population
of 3.6 Million, the highest per-capita figure of any German Federal State except for the
small city state of Bremen2 . Because of its dense development and increasingly tight
housing market, this meant that Berlin is the place where the refugee inflow was most
acutely experienced by the local population.
The Berlin Office for Refugee Affairs (Landesamt für Flüchtlingsangelegenheiten, LAF)
provides information on all shelters in operation, including their exact location, capacity
and occupancy. I have obtained this list at two different points in time, once in September
2016 and once in January 2018. There is considerable overlap between the two lists, but
some shelters have closed while others have opened between the dates.
Additionally, some shelters – especially among those located in gymnasiums of public
schools – had already been closed in the summer of 2016. From these lists, I construct a
panel of 177 shelters, which I believe to be mostly complete. 96 of those shelters where
still in operation in January of 2018. I have also collected their opening and (where
applicable) closing dates, to be able to pinpoint the exact month when a neighbourhood
would be treated.
According to the LAF, resources where so strained during the refugee crisis that shel-
ters were opened where it was possible, without consideration of political or social con-
sequences. This was communicated to the media and also confirmed to me via email. I
largely validate this claim in section 5 (Robustness and validity), showing that the eventual
2
BAMF, Das Bundesamt in Zahlen 2014-2016, Asyl
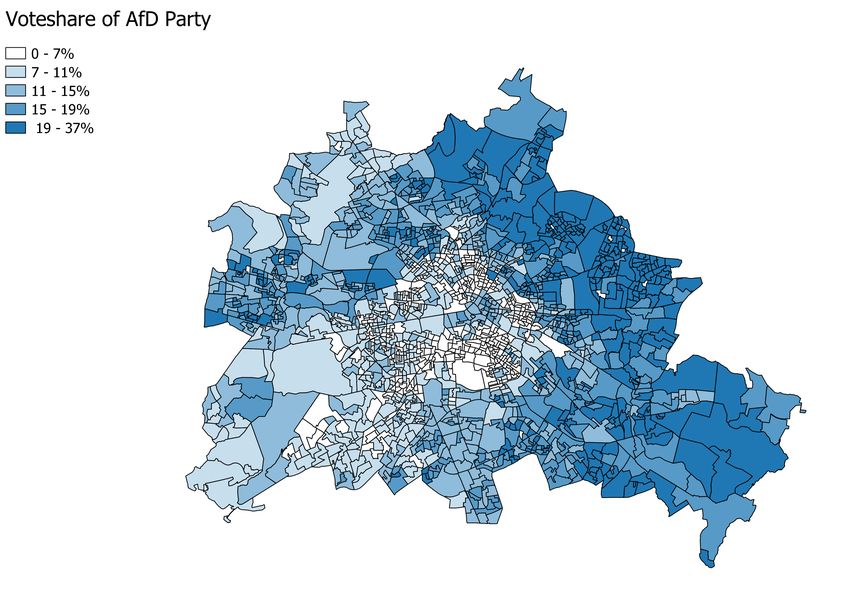
6Fig. 1: Location of refuge shelters in Berlin
shelter locations do not differ from others either in terms of previous results for right-wing
parties or in the composition, type and quality of local places.
The majority of shelters were established in pre-existing buildings. Frequently, these
were gymnasiums of public schools (48 instances in my list), and I could confirm this
for at least 89 other shelters, for example in unused administrative buildings. At least 19
shelters were temporary structures.
The fact that the premises of public schools where often used as locations for a shelter
enables me to use the proximity of such a school as an instrument for the eventual prox-
imity of a shelter (see section 4, robustness and validity). However, while the results are
robust to the use of this instrument, the locations of schools actually show less balanced
characteristics before the crisis than the true locations of shelters, which is why I prefer
to simply use these true locations as treated areas in a differences-in-differences setting.
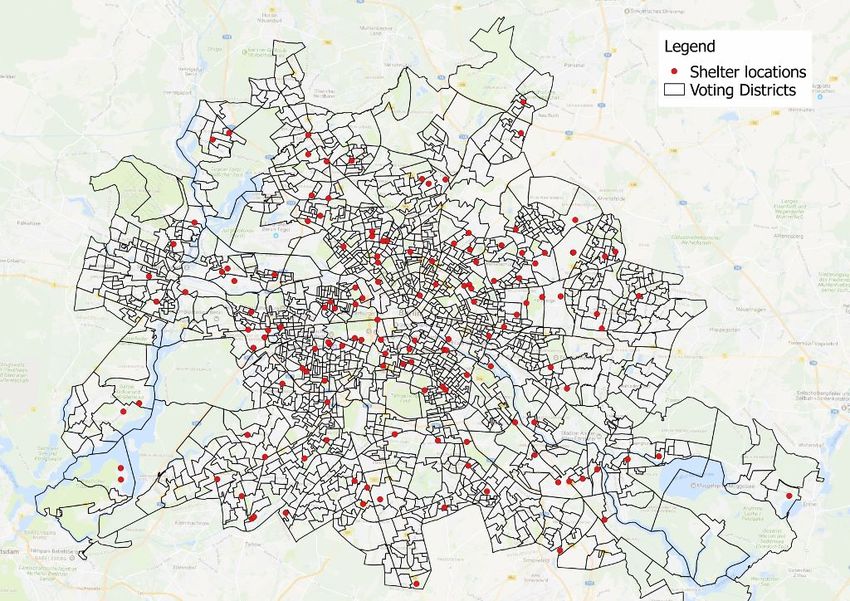
As can be seen in Figure 1, the shelters are distributed across Berlin; however, the more
densely developed centre of the city has more shelters. The population living in the centre
consequently is more likely to live close to a refugee shelter (Fig. 2).
7Fig. 2: Distance of voting tracts to nearest shelter
2.2 Independent variables
This distance to a shelter will be my main treatment, either as a continuous variable or as
a dummy indicating that a shelter is close. In my preferred specifications, I simply create
a treatment dummy T itd , indicating whether there is an open shelter within d meters of the
observation. For real estate listings and place ratings, I use the exact address to calculate
the distance; in the case of voting precincts, I use the centroid of their area.
During 2016, 1% (371 of 40,080 observations) of real estate listings are within 100m
of a shelter. 4.5% (1,832) are within 200m, and 25% (9,942) within 500m. Of the voting
precincts, 1% (18 of 1,470) are within 100m, 4% (61) are within 200m, and 23.5% (346)
within 500m.
Shelters vary considerably in size. Their capacity ranges from 30 to 1200 places, with
a mean of 300.3 Additionally, some locations are close to several shelters, and distance is
a continuous variable, with close proximity presumably having a higher impact.
I therefore create a treatment variable that takes both distance and capacity of all nearby
shelters into account. It is defined as the sum of the capacities (in hundred beds) of the
3
The largest shelter, at the former Tempelhof airport, temporarily had an even larger capacity of more
than 4000 places.
8three closest shelters, each divided by the square root of the shelter’s distance to a place,
or
5
X c jt
T it = p . (1)
j=1 di j
Shelters j = 1, 2, 3 have capacities of c j , and are located at a distance of di j from place
i (or the centroid of voting precinct i). 4
The mean treatment value (when observations are the voting precincts) is .25 during
the year of 2016, with a standard deviation of .14. 5% of voting districts have a treatment
value of .55 or higher.
I discuss in section 5 how treated and untreated precincts did not differ from each other
in trends or levels before the crisis (see e.g. the balance table 18).
2.3 Elections
My main unit of observation for election outcomes is the voting precinct, the districts
served by one polling station. This is the basic unit at which votes are counted. There are
1779 such precincts in Berlin, serving on average 1343 eligible voters (see Table 1). The
state election supervisor for Berlin publishes party vote totals and percentages at this level
for every election held in Berlin, be they senatorial (state), federal or European elections.
The AfD party received 14.2% of the vote in the Berlin senatorial elections of 2016,
and 12% of the Berlin vote in the 2017 federal elections. During previous elections, it
received a much lower percentage of the vote - 4.9% in the Federal Elections of 2013
and 7.9% in the European elections of 2014 - and before 2013, it did not exist. It was
also founded with a very different platform from the one it would adopt after the refugee
crisis, namely one with a much larger focus on the European debt crisis and the Euro,
rather than immigration.
This must be kept in mind when we use difference-in-difference specifications to esti-
mate our effects of interest: earlier votes for the AfD do not necessarily capture the full
potential of anti-immigrant votes before the refugee crisis.
4
I only use the 3 closest shelters because the minimum distance of a place to the fourth-closest shelter
is greater than 500m, a distance at which the impact of a shelter on a neighbourhood (beyond the impact of
3 closer shelters) is small.
9Tab. 1: Voting tracts in Berlin, Federal Elections 2017
N: 1779 (in 2017) Mean Median St.D.
Eligible voters 1,343 1285 386
Votes 698 681 195
Voting for AfD (%) 13.5 12.8 6.5
Area (km2) .5 .2 1.2
Distance from centre (km) 8.7 8.1 4.5
Distance to nearest refugee shelter (km) 1.4 1.2 .98
As can be seen in the map Figure 3, the outer voting precincts, and particularly those
in the east, voted more strongly for the AfD party than in the centre of the city. This is
the reason I control for distance from the centre as well as district, interacted with the
treatment dummy for the years 2016-2017, in my main specifications.
The median area of voting tracts is 190t m2, (mean: 500t m2), so that a representative
district, if it were square, would have all points within roughly 250m of its centroid.
Therefore, I define such precincts where the distance from the shelter to the centroid is
250m or less as treatment districts.
2.4 Real estate data
The real estate listings website immobilienscout24.de is the largest such service in Ger-
many. Real estate agencies as well as private landlords use it to make their offers conve-
niently searchable for prospective buyers and tenants. Beyond currently available listings
and accompanying detailed exposés, the website includes an "atlas" where clients can
retrieve information about past listings in the vicinity of a given address, to form an im-
pression of price developments in the area.
I have scraped this information from the atlas, since in contrast to the current listings, it
includes listings going back to 2010. The available variables are the exact address, price,
size, and number of rooms as well as the real estate agency handling the listing.
I was able to webscrape and geolocate roughly 250,000 individual ratings. The majority
of these (about 200,000) are for apartment rentals, with the rest being house rentals or
purchase listings. Berlin has experienced a real estate boom during the period under
10Fig. 3: Success of AfD party in Berlin, 2017 federal elections
study, which is reflected in my data by a 66% increase in the mean rental price from 6.76
Euro per square metre in 2010 to 11.23 Euro in 2018.
2.5 Ratings and Places data
I use data from the local search website Foursquare to construct additional variables.
Foursquare makes its data available through an API, free of charge for non-commercial
applications. It includes a large database of “venues” - geocoded places such as restau-
rants and other businesses, but also e.g. parks, streets and bus stops. Users can create these
venues and give “tips” on them, which include a rating (“like”, “dislike” and “meh”) and
a text review. For greater clarity, I refer to venues and tips as places and ratings.
The creation of places as well as the ratings come with a time stamp, making it possible
to create a panel of many characteristics of areas over time - for example the number and
type of businesses as well as average ratings of these businesses.
For Berlin, there are roughly 66 thousand unique places in the database, which have
together received 81 thousand ratings (16.5 thousand places have received at least one
rating). For each place, one or more categories are given - “Office” and “Café” are the
11Number of Venues 68,902
- at least 1 rating 16,252
- at least 5 ratings 4,815
Number of Tips 80,166
- Office 3200
- ’liked’ .49
- Café 1967
- ’disliked’ .04
- Residential 1785
- ’meh’ .06
- Bakery 1743
- none .4
- Bus Stop 1425
... ... - English .56
- Italian 1023 - German .36
- Doner 380 - Russian .03
- Turkish 264 - Turkish .02
- Middle Eastern 175
Tab. 2: Venues on Foursquare Tab. 3: Tips on Foursquare
most common, but there are also numerous places in categories related to immigration
from the refugee origin countries - “Doner”, “Falafel” and “Middle Eastern”, for example.
The first set of variables I constructed from the Foursquare data are counts of newly
created places by month and voting precint, as well their as counts in specific categories.
I also construct the mean rating and mean price category of these places. In the absence
of small-scale census data (the census is only broken down to the 12 districts of Berlin),
these variables allow us to assess whether or not refugee shelter locations can truly be
seen as similar to locations without shelters.
The aggregate variables on the level of the voting tract can also be used as outcome
variables. They give us an indication of how the composition of neighbourhoods changes,
e.g. if there is increased creation of new businesses of certain types, and if so if these differ
in price and perceived quality from those created not in the proximity of a shelter.
It has to be kept in mind that this is not an official and complete business register. If
business creation on Foursquare increases or declines in a certain area, this could be due
to the fact that Foursquare users and developers give this area greater or lower attention.
Secondly, I consider if ratings given to places in a certain area are more or less likely
to be positive or negative, what language is used in the text etc. This I can do for ratings
12of all places or only of places in specific categories. Note that there are almost as many
places as there are ratings; the majority of places never receives any rating. My estimates
on the probability of receiving a positive rating, which will include place fixed effects, are
estimates off the minority of places which have received multiple ratings.
In addition to creating these outcome variables, I also use the Foursquare data to create
covariates for the analysis of electoral outcomes. For example, the presence of a refugee
shelter can have a different impact in areas where there is already a strong immigrant
presence. Official population data for Berlin is only available at the coarse level of the
district; using this finely grained data enables me to e.g. observe restaurants with immi-
grant cuisine and use it as an indicator for immigrant presence. I also use the average
price ratings on foursquare as an indicator of the wealth of an area.
In Appendix C I show correlations of these Foursquare measures of wealth and foreign
population with the official data available on the level of the 12 district.
3 Results
3.1 Real estate prices and listings
Prices: I first study the impact of refugee shelters on real estate prices. The observations
are individual rental listings (apartments and houses)5 . I regress the price per square metre
on treatment and controls as follows:
yi jt = βT it + γXit + FEt + FE j + i jt (2)
where i is the listing and j the voting tract. Since I have precise information on the
operation dates of shelters, I can use a monthly panel where the treatment variable T t j
varies from month to month, when new shelters are opened. T ti is defined first, for clarity
of interpretation, as a dummy taking the value of 1 after a shelter opens within 100m of a
place i.
The geographic fixed effects are on the level of the voting precinct, and time fixed
effects are for individual months. I also include linear time trends for the voting precincts
5
purchase listings are similarly impacted, but they are much fewer.
13as a robustness check, but since they do not change the results but slow down calculations
considerably, I omit them in my main specifications.
The controls included at basement are only size, a dummy for if the listing is for a house
(rather than an apartment - the large majority), and the number of rooms (as a categorical
variable).
The results show a decline by about 37 cents for those rentals very close (within 100m)
of an operating refugee shelter (see table 4). That is about 3% of the average rent.
Tab. 4: Nearby refugee shelter and rental prices - treatment dummy
Outcome variable Rental price (e per m2 )
Shelter within 100m -0.360** -0.372** -0.375**
(0.152) (0.150) (0.146)
FE voting precinct X X X
FE month × year (time) X X X
Distance from center × time X X
Linear trends by voting precinct X
R squared 0.201 0.829 0.833
N. of observations 208,390 208,390 208,390
Significant at: p < 0.1: *; p < 0.05: **; p < 0.01: ***. Standard errors clustered at
place and time level.
Number of listings and repeated listings: If a refugee shelter increases the number of
new listings in a neighborhood, it would be an indication that previous residents are mov-
ing away to avoid the immigrants. To study this, it is necessary to aggregate the number
of listings by a geographical unit. I use the voting precincts for any such aggregation in
this paper.
I regress the number of immoscout24.de listings on a treatment variable as follows:
Nit = β(closei × postt ) + ΓXi × postt + FEt + FEi + it (3)
14Nit is the number of listings in voting precinct i in year t. The treatment variable is the
interaction of a dummy closei (the closest shelter location is within 200m of the voting
precinct centroid) with the post-crisis dummy postt (any year after 2015). Geographic
controls Xi are interacted with the post-crisis dummy to avoid picking up any mechanical
effect, by which denser precincts closer to the centre are more likely to be treated and also
have different real estate dynamics beyond the impact of shelters.
The results can be seen in table 5. We note that the number of listings increases by
roughly 2 per year after a shelter opened nearby (specification (1). The average number
of listings per year is 16).
One limitation of my data is that I do not have the date at which a listings was with-
drawn, so that I cannot observe how long an apartment stays on the market. However,
some apartments are quickly re-listed on the platform - real estate agents could do this if
they haven’t found a new tenant and want to update the exposee e.g. with pictures to give
it a more prominent position on the website. Apartments that remain unoccupied for a
longer time are more likely to be re-listed in this way.
For the purposes of this study, I define listings for an apartment that has been listed less
than 6 months before as re-listings. Since these are long-term rentals (rather than sublets
or holiday rentals), I assume that these apartments have remained unoccupied in between
the original listing and the re-listing.
When I subtract such re-listings from the number of listings per voting precincts, I
obtain the number of new listings. If I regress these on our treatment variable, we see
that it increased considerably less than the total number of listings (table 5, (2)). The
difference is (mechanically) made up by re-listings (3). The effect on new listings is 1.1
relative to an average of 13, while the effect on re-listings is 1.1 relative to an average of
2.5 per year per voting precinct.
Taken together, this indicates that there are indeed slightly more new listings on the
website after a shelter opened nearby. However, the effect on re-listings, and therefore on
the likelyhood that an apartment remains vacant for a longer time, is more important in
relative terms.
15Tab. 5: Nearby refugee shelter and number of real estate listing
Outcome variable Number of listings
(1) Total (2) New listings (3) Re-listings
Shelter within 100m 2.204*** 1.088** 1.105***
(0.444) (0.322) (0.271)
Distance from center × time X X X
FE voting precinct X X X
FE month × year (time) X X X
R squared 0.568 0.629 0.265
N. of observations 9,880 9,880 9,880
Significant at: p < 0.1: *; p < 0.05: **; p < 0.01: ***. Standard errors clustered at place and
time level.
3.2 Public amenities and their Ratings
Next I investigate the impact of shelters on place ratings. Observations are individual
’tips’ - ratings with a review/description text - of which there are 81,122 in Berlin during
the years 2010 to 2017. I use a linear probability model taking the form
yi jt = βT t j + FEt + FE j + i jt (4)
where j is an individual venue, e.g. a business. Using fixed effects on the level of the
venue, the coefficient of interest β is only identified from those venues that exist before
and after the establishment of refugee shelters. Since I have precise information on the
operation dates of shelters, I can use a monthly panel where the treatment variable T t j
varies from month to month, when new shelters are opened. T t j is defined first, for clarity
of interpretation, as a dummy taking the value of 1 after a shelter opens within 200m of a
place j. My preferred specification is however the one defined as above in (1), taking into
account the distance and capacity of all nearby shelters.
I also use voting tract fixed effects rather than venue FE in some specifications, to
16allow for an effect on the establishment of new venues around refugee shelters, which
could have systematically different ratings and reviews.
The outcome variables yi jt are dummies, e.g. for whether or not a rating was positive
or whether it was in German. For some regressions, I restrict the sample to certain places
of special interest to us.
Tab. 6: Nearby refugee shelter and ratings of existing places,
all places - treatment dummy
Outcome variable (1) ’liked’ (2) ’disliked’ (3) ’meh’
Shelter within 200m -0.12*** 0.01 -0.02
(0.044) (0.018) (0.028)
FE place X X X
FE month × year X X X
R squared 0.31 0.08 0.07
N. of observations 80,166 80,166 80,166
Significant at: p < 0.1: *; p < 0.05: **; p < 0.01: ***. Standard errors
clustered at place and time level.
The outcomes can be seen in tables 6 for the treatment dummy, and 7 for the continuous
treatment variable. The results indicate roughly the same effects - as can be seen in table
7, ratings for a place are less likely to be positive after refugee shelters have opened in the
vicinity of the venue. The likelihood of the rating being explicitly negative is unchanged,
and an ambivalent rating (’meh’) becomes more likely. The decline of positive ratings by
1.4 percentage points is not large when we consider that about 46% of tips on the platform
are positive. The treatment variable is roughly 1 on average, and the 90th percentile is
around 1.9. A ’highly treated’ place would therefore be around 3 percentage points less
likely to receive a high rating (we will see later that places very close to a shelter –
within 100m – see a much larger impact). Use of the treatment dummy variable suggest
somewhat smaller impacts (table 6).
I will use my continuous treatment variable in the remaining regressions in this sub-
section, since it gives a more complete picture of the intensity of refugee housing in an
17Tab. 7: Nearby refugee shelter and ratings of existing places, all
places - continuous treatment
Outcome variable (1) ’liked’ (2) ’disliked’ (3) ’meh’
Shelters capacity/distance -0.014** 0.001 0.008*
(0.007) (0.004) (0.005)
FE place X X X
FE month × year X X X
R squared 0.31 0.08 0.07
N. of observations 80166 80166 80166
Significant at: p < 0.1: *; p < 0.05: **; p < 0.01: ***. Standard errors clustered
at place and time level.
area. When the results of regressions with the simpler treatment dummy differ from those
presented here, I will note it in the discussion (those results are available on request).
The main coefficient does not change greatly when we restrict the sample to only those
venues which have received 10 or more ratings or when we include the geographic con-
trols introduced in the section on election outcomes (Table 8, specifications (1) and (2)
respectively).
This decline on ratings could in principle only affect certain types of places. If we
restrict our sample to public places such as parks and roads, or to Turkish and Middle
Eastern restaurants, we see that the former are impacted at a similar magnitude as all
places, while the latter are potentially less impacted (the coefficients are less precisely
measured due to the smaller sample). If only German language ratings are considered,
we again find no difference to the overall coefficient (these regressions on subsamples are
reported in Table 9).
Newly established venues and their composition: We are also interested in the ques-
tion of whether areas around refugee shelters experience changes in business activity.
New businesses could open to cater to refugee demand, while at the same time, the area
could become less attractive for other businesses. I study the establishment of new places
on Foursquare in the vicinity of shelters, keeping in mind that this can only be an in-
18Tab. 8: Nearby refugee shelter and ratings of existing places, all places
Model (1) Restricted (2) Geo. controls
’liked’
Shelters capacity/distance -0.017** -0.013*
(0.008) (0.007)
Distance to centre× (2016 or 2017) 0.00
(0.00)
FE venue X X
FE Year X X
R squared adjusted 0.29 0.31
N 51,614 80,166
Significant at: p < 0.1: *; p < 0.05: **; p < 0.01: ***. Standard errors clustered at
district level in (3).
Tab. 9: Nearby refugee shelter and ratings of existing places, subsamples
Subsample (1) All places (2) Public (3) MEastern (4) German review
Outcome variable ’liked’
Shelters capacity/distance -0.014** -0.012 -0.002 -0.015
(0.007) (0.016) (0.031) (0.014)
FE voting tract X X X X
FE Year X X X X
R squared 0.31 0.35 0.27 0.35
N. of observations 80,166 13,113 3,169 26,585
Significant at: p < 0.1: *; p < 0.05: **; p < 0.01: ***. Standard errors clustered at district level in (3).
19dication of true business activity - not all businesses are recorded, and the activity of
Foursquare users could itself be subject to changes in the neighbourhood.
It appears that there is a slight increase in the number of newly established venues
driven by nearby shelters (table 10, (1)), as well as in the establishment of new Middle
Eastern and Turkish restaurants (2). On average, 1.56 new places are created in a voting
precinct each month, and .008 Middle Eastern and Turkish restaurants. So while the
coefficient of .06 on the creation of all new places is not large relative to the base rate,
the creation rate of the relevant ethnic restaurants of .002 is relatively high (and this is
the value for the average treatment, not the areas at the 90th percentile of our treatment
variables).
It should be noted however that these effects on the creation of new businesses are only
weakly significant, and are insignificant when we use the ’dummy’ treatment variable.
The average rating of newly established businesses is not affected (3), and neither is
the average price level (4).
It would be interesting to investigate this further, since in the longer run we do expect
a shelter to affect the categories of businesses created more than this limited evidence
suggests.
Tab. 10: Nearby refugee shelter and newly established places
Outcome variable (1) all venues (2) Turkish & MEastern (3) rating (4) price
Shelters capacity/distance 0.063* 0.002* -0.039 0.021
(0.032) (0.001) (0.065) (0.014)
FE voting tract X X X X
FE Year X X X X
R squared 0.814 0.077 0.195 0.124
N. of observations 11,161 11,161 3,067 5,867
Significant at: p < 0.1: *; p < 0.05: **; p < 0.01: ***. Standard errors clustered at district level in (3).
203.3 Elections
For ease of interpretation, I will again first show the results using the simple treatment
dummy, which is 1 the electoral precinct has any shelter within 200m from its centroid.
In following The preferred model I use is a simple diff-in-diff model of the form
right_voteshareit = β(closei × postt ) + ΓXi × postt + FEt + FEi + FEd × postt + it
(5)
where i is the voting precinct and t denotes specific elections - -the Berlin senatorial
elections of 2006, 2011 and 2016, as well as the federal elections of 2009, 2013 and 2017.
closei is a dummy taking the value of 1 if the centre of the polling district is within 250
metres of a refugee shelter, and the dummy postt is one for the elections of 2016 and 2017.
FEi is the fixed effect on the polling station, while FEt is the election fixed effect. I also
use geographic variables Xi interacted with the post-dummy; these include the precinct’s
area and distance to the centre of Berlin. I prefer to include these due to the geographic
concentration of treated areas near the centre of the city (which also have a smaller area).6
As discussed before, each electoral district has around 1500 voters.
The results table are presented in Table 11). Specification (1) does not include any
geographic controls other than the fixed effects. My preferred specifications (2) and (3)
include distance to the centre of Berlin as the only such control. They differ in so far as
(3) estimates only within-district effects by including an additional FE for each district
after the refugee crisis; these additional controls would be important if e.g. there are
differences in the impact between Western and Eastern districts. However, they do not
change our main coefficient.
These specifications indicate that the voteshare of right-wing parties increased by 1.2
additional percentage points in those voting tracts where a refugee shelter is nearby. This
is about 10% of the median AfD voteshare of 12.8%.
This magnitude is confirmed a model using the natural logarithm rather than the level
of the outcome variable (model 4). The shelters increase the voteshare by about 10%.
6
The previous level of right-wing support does not fully capture the potential for increase in radical
votes in 2016 and 2017. The highest increase happened in the poorer and less densely populated outer areas
of Berlin. Since many of the shelters are in the more densely populated inner residential areas, and since the
outer polling tracts are larger in area, the outer polling stations also happen to be further away from shelters
on average (see Figures 1 and 2 for visual evidence of this geographic correlation).
21Tab. 11: Nearby refugee shelter and right-wing vote share, treatment dummy
Model (1) (2) (3) (4)
Outcome right-wing voteshare ln(rw voteshare)
Independent variables
Shelter within 200m 0.006** 0.012*** 0.012*** 0.102***
(0.002) (0.001) (0.001) (0.019)
Distance to centre× (2016 or 2017) 0.006*** 0.005*** 0.016
(0.001) (0.001) (0.009)
FE voting precinct X X X X
FE election X X X X
FE district × (2016 or 2017) X
R squared (adjusted) 0.795 0.827 0.869 0.857
N. of observations 10,958 10,958 10,958 10,857
Significant at: p < 0.1: *; p < 0.05: **; p < 0.01: ***. Standard errors clustered at district and year levels.
22Interestingly, the geographic variables are less significant and have smaller importance
relative to the treatment coefficient compared with specifications (2) and (3).7
The results when using the continuous variable indicate a stronger effect of the presence
of shelters on voting outcomes (table 12), of 5 percentage points (model 1) or 3 points
(model 2, where differences between districts are controlled for). We will see later that
the effect of shelters on voters is present at a larger distance than 200m; it is possible that
the continuous treatment variable captures e.g. the effect of some large shelters within a
distance of 200-1000m of a voting precinct, something that the simple dummy does not
capture.
We will see later (in section 4) that these result are in their sign robust to a number
of different specifications, including the use of proximity of a public school as an instru-
ment. I will however argue that this OLS specification is preferable; most importantly,
the ’treated’ areas do not have different political outcomes to untreated areas before the
refugee crisis.
3.4 Heterogeneity of electoral impact
We expect the impact on electoral outcomes to be different from one voting tract to the
other, depending on local characteristics. For example, we might think that having a
shelter nearby has a stronger impact on right-wing voting in voting tracts of low density,
simply because the shelter and refugees would be more visible in such an environment. I
define density as eligible voters per 100m2 , so that it has a mean of 0.79.
A voting tract where there is already a large foreign (and especially Middle Eastern)
presence might also be differently impacted, although we can imagine arguments for an
effect in either direction. Since census data on the level of voting tracts is not available,
I use the Foursquare data to find a proxy for this variable, namely the number of Turkish
and Middle Eastern restaurants. On average, there are .55 such establishments in a voting
tract, but more than half of them do not have such a restaurant at all.
Lastly, voters in more wealthy areas could also react differently. As a (certainly imper-
fect) proxy for prosperity, I take the average price category of Foursquare places in the
7
I will discuss this in more detail in section 4 (Robustness), but the distance from the centre likely picks
up an effect that is not accounted for by the additive fixed effects model; the logarithmic specification, in
contrast, possibly accounts for this effect by assuming that the location and time fixed effects interact in a
multiplicative fashion on the voteshare.
23Tab. 12: Nearby refugee shelter and right-wing vote share,
continuous treatment variable
Model (1) (2)
Outcome right-wing voteshare
Independent variables
Shelters capacity/distance 0.051*** 0.030***
(0.007) (0.006)
Distance to centre× (2016 or 2017) 0.006*** 0.005***
(0.001) (0.001)
FE voting precinct X X
FE election X X
FE district × (2016 or 2017) X
R squared (adjusted) 0.829 0.869
N. of observations 10,958 10,958
Significant at: p < 0.1: *; p < 0.05: **; p < 0.01: ***. Standard errors
clustered at district and year levels.
24voting tract.
I interact these three variables - density, presence of Middle Eastern restaurants, and
average price category of places - with our continuous treatment variable accounting for
nearby shelters. The results from this regression can be seen in table 13. Density has
indeed the expected effect (column 2) - where a new shelter would be more visible (lower
density), it has a much stronger impact on right-wing voting. Voting tracts with higher
presence of Middle Eastern or Turkish restaurants actually saw a lower impact, probably
due to the fact that voters in these tracts are more used to, and more sympathetic towards,
foreign immigration. Lastly, the price level as given by our proxy variable also has a
negative interaction with the treatment variable in affecting rigt-wing voting (this last
interaction is not significant when the treatment dummy is used).
These heterogeneous effects appear to be quite sizeable - recall that density as defined
here is roughly .8 on average, and the number of ME restaurants .55. The coefficients
on the interactions are therefore large relative to the direct effect. This has important
implications for where to locate refugee shelters, if policy makers aim to mitigate the
impact of shelters on an electoral backlash.
3.5 Type of shelter
The LAF distinguishes two main types of shelters, the Gemeinschaftsunterkunft (commu-
nity shelter, GU) and the Notunterkunft (emergency shelter, NU). Presumably, refugees
will be visible in the vicinity of both GU and NU, but the NU are more clearly a reminder
of a crisis situation, and may be seen as a sign of its mismanagement. If these types of
shelters have no different impact on our outcomes, it may be seen as a sign that voters
simply object to the presence of refugees, while a stronger impact of NU would indicate
that at least part of the political backlash is due to the perceived chaotic circumstances
rather than simply immigration alone.
I investigate if the impact of a NU shelter is different from other shelters (mostly GU)
by interacting the dummy for a nearby shelter with another dummy that indicates a NU.
The negative impact on ratings is much higher for NU, which is what we would expect.
However, the impact on electoral outcomes may even be smaller (the coefficient is not
significant). This is unexpected, but perhaps voters in the vicinity of emergency shelters
were reassured that they would only be temporary.
25Tab. 13: Nearby refugee shelter and local characteristics, electoral outcomes
Outcome variable right-wing voteshare
(1) (2) (3) (4)
Shelters capacity/distance 0.051*** 0.083*** 0.064*** 0.085***
(0.007) (0.012) (0.009) (0.010)
Shelters capacity/distance × Density -0.039***
(0.007)
Shelters capacity/distance × ME rest. -0.030***
(0.004)
Shelters capacity/distance × price level -0.028***
(0.006)
Distance to centre× (2016 or 2017) 0.006*** 0.006*** 0.006*** 0.006***
(0.001) (0.001) (0.001) (0.001)
FE voting tract X X X X
FE Year X X X X
R squared 0.829 0.832 0.834 0.830
N. of observations 10,958 10,958 10,958 10,151
Significant at: p < 0.1: *; p < 0.05: **; p < 0.01: ***. Standard errors clustered at district level in (3).
26Tab. 14: The impact of emergency shelters (NU) vs. community shelters
Outcome (1) Right-wing voteshare (2) Negative ratings
Independent variables
Shelter within 200m 0.015*** -0.09**
(0.005) (0.04)
Shelter within 200m × shelter is NU -0.019 -0.04**
(0.012) (0.02)
FE year X X
FE district X
FE venue X
R squared 0.83 0.18
N. of observations 13,283 160097
Significant at: p < 0.1: *; p < 0.05: **; p < 0.01: ***. Standard errors clustered at district level in (3).
274 Is the change in perceived neighbourhood quality a
mechanism for voting outcomes?
The previous section established the impact of refugee shelters on real estate prices, the
ratings and types of places in the neighbourhood and on contemporaneous electoral out-
comes. However, this does not tell us how much the decline in perceived neighbourhood
quality, as documented in the real estate and foursquare data, contributed to the electoral
backlash against refugee immigration. In fact, I argue in this section that the changes
documented in the ratings data are only a moderately important channel for the voting
impact.
Mediation analysis: The first strategy is to use the intermediate outcome as a right-
hand side variable in a regression of final outcomes on the treatment status and covariates.
If this lessens the coefficient of treatment, the difference can, under strong assumptions,
be interpreted as the part of the total effect explained by the changes in the intermediate
outcome. Formally, the procedure is to estimate the system of equations
Yit = βt T it + ΓXit + 1it (6)
Mit = β T it + ΓXit + 2it
m
(7)
Yit = βd1 T it + βid
1 Mit + Γ1 Xit + 3it (8)
our outcome of interest Yit is right_voteshareit , while the intermediate outcome (or me-
diator) Mit is either the average rental price rpriceit in voting precinct i, or the proportion
of ratings which are positive likedit . The covariates Xit include fixed effects as in 5, as well
as the appropriate geographic controls. βt would then be interpreted as the total effect of
shelters on voting, and βd as the direct effect (that is, the effect not accounted for by our
observed channel). The product βid × βm would be the indirect effect, mediated by the
intermediate outcome likedit .
This procedure, known as mediation analysis in statistics (see Heckman and Pinto
(2015), Imai et al. (2010)), is prone to bias.8 It requires that
8
Despite these problems, mediation analysis has been applied in a number of papers recently, particu-
larly in the economics of education (see e.g. Heckman et al. (2013), Oreopoulos et al. (2017)), but also in
the more closely related literature on trade, labour markets and voting outcomes (Dippel et al. (2017))
28Mit + Qit
βm βid −
T it βd Yit
Fig. 4: Shelters treatment T it affecting voting outcomes Yit directly, and through ratings
Mit as intermediate outcome; other, unobserved shocks to quality Qit .
{Yit , Mit } y T it |Xit = x and
Yit y Mit |T it = t, Xit = x (9)
The first assumption simply states that there are no confounding unobserved variables
affecting both treatment status and either the intermediate or final outcome variable. It is
the same assumption needed for our estimation of total treatment effects above. The sec-
ond assumption requires that there are no unobserved variables affecting both the outcome
Yit and the intermediate variable Mit , for the coefficients of 8 to be identified.
Despite my inclusion of fixed effects and other controls, this condition is unlikely to be
met in our application. In particular, we can expect that there are unobserved shocks to
the quality of a neighbourhood, affecting simultaneously real estate prices, the ratings of
foursquare venues and the success of right-wing parties.
However, it may be possible to make additional assumptions on the direction of the
influence of this unobserved shock on Yit and Mit . If we assume that the unrelated and
unobserved decline of neighbourhood quality would lower the ratings of businesses, and
at the same time increase the electoral success of right-wing parties, we can show in
which direction the coefficients βd and βid in 8 are likely biased. A regression of right-
wing electoral success Yit on real estate prices and foursquare ratings Mit ,
Yit = βMit + ΓXit + FEi + FEt + it
finds a negative coefficient β, suggesting that this is indeed the direction of correlation
(see table 15).
29Tab. 15: Correlation of neighbourhood
quality measures and voting
outcomes
Outcome right-wing voteshare
Mean rental price -0.046
(0.025)
Average rating -0.016
.009
FE year X X
FE precinct X X
R squared 0.873 0.838
N 9,878 7,509
Significant at: p < 0.1: *; p < 0.05: **; p < 0.01:
***. Standard errors clustered at precinct and year
level.
30If we assume that equation 8 is primarily misspecified by the omission of the unob-
served shock to neighbourhood quality Qit , the true relationship between treatment, rat-
ings and voting outcomes would be
Yit = βd2 T it + βid
2 Mit + β Qit + Γ2 Xit + 3it
q
(10)
while the true specification for determining real estate prices and ratings is
Mit = βm T it + βqm Qit + ΓXit + 2it . (11)
The omitted variable bias resulting from the omission of Qit in our specification 8
relates the estimated coefficients βid
1 and β1 to the true β1 and β1 ; it is
d id d
Cov(M, Q) × Var(T )
βid
1 = β2 + β
id q
(12)
Var(M) × Var(T ) − Cov(M, T )2
and
Cov(M, Q) × Cov(T, M)
βd1 = βd2 − βq (13)
Var(M) × Var(T ) − Cov(M, T )2
Derivations of these terms will be provided in the Appendix A. If we assume that
Cov(M, Q) is positive – a positive shock to unobserved neighbourhood quality increases
real estate prices and ratings – and that βq is negative – the same shock reduces right-
wing voting – this tells us that βid
1 is biased downward (away from zero). So is β1 , since
d
Cov(T, M), the effect of shelters on average ratings, is also negative.
Estimating specifications 6 and 8, we find that the treatment effect βd1 of a nearby shelter
on voting outcomes is virtually unchanged when we include the average ratings in the
voting precinct as a regressor. The effect of including real estate prices is more sizeable
(see table 16). The effects of the both real estate prices and average ratings, βid1 , have the
expected negative sign, but it is small and insignificant.
The decrease of the treatment coefficient from 1.2 percentage points to .8 percentage
points when the mean rental price is included suggests that potentially, a third of the effect
31of the establishment of the shelter on voting outcomes is due to the mechanism of neigh-
bourhood decline. But as we have seen, βd1 and βid 1 are likely to be biased downward in
these regressions, so that this may overstate the importance of this channel. It provides an
upper bound, meaning that most of the treatment effect is due to unmeasured mechanisms.
In the following, I present additional pieces of evidence, strengthening this conclusion.
Tab. 16: The impact of shelters on voting, RE prices and
ratings as intermediate variable
Outcome right-wing voteshare
Shelters T it 0.012*** 0.008*** 0.011***
(0.001) (0.001) (0.001)
Mean rental price -.0007
(0.0004)
Average rating -0.015
(0.009)
FE year X X X
FE precinct X X X
R squared 0.836 0.872 0.838
N 7,509 7,509 7,509
Significant at: p < 0.1: *; p < 0.05: **; p < 0.01: ***. Standard
errors clustered at precinct and year level.
Distance effect: Treatment effects diminish with distance. A shelter within 100m of
the centre of a polling area, or within 100m of a venue, should have a larger impact than
one within 500m. To investigate this, I use a different treatment definition, one that only
takes the distance of the nearest shelter into account. I define four brackets, according
to the proximity of the next shelter. In bracket 1, observations are within 100m of the
next shelter, and in brackets 2, 3, and 4 the nearest shelter is within 100m-200m, 200m-
500m and 500m-1000m respectively. This defines four different treatment groups. During
2016, 39% of voting precincts, 49% of listings, and 47% of ratings now fall into one of
the treatment groups.
32The results of a regression where these treatment dummies are interacted with post-
crisis dummies (as before) are presented in table 17. We see the expected declining impact
for voting outcomes, real estate prices, and negative tips. It is notable however, that the
impact on the measures of neighbourhood quality falls much faster in distance than the
impact on voting outcomes. The stark difference tells us that voters within 500m of the
nearest shelter are still more likely to cast their vote for the right-wing party, while rental
prices in their block do not decline and businesses in their own close vicinity do not
experience a decline in ratings.
Tab. 17: The impact of shelters, decreasing with distance
Outcome (1) RW voteshare (2) rental price (3) Positive rating
Independent variables
Shelter within 100m 0.012*** -0.37** - 0.12**
(0.002) (0.15) (0.05)
Shelter within 100m-200m 0.013*** -0.05 -0.017
(0.004) (0.11) (0.022)
Shelter within 200m-500m 0.009*** 0.03 0.023
(0.003) (0.07) (0.025)
Shelter within 500m-1000m 0.005** 0.01 -0.023
(0.002) (0.06) (0.018)
FE year X X X
FE district X X
FE venue X
R squared 0.83 0.83 0.18
N. of observations 13,283 208,390 80,166
Significant at: p < 0.1: *; p < 0.05: **; p < 0.01: ***. Standard errors clustered at district level in (3).
This set of results may not be conclusive, but it suggests that the impact of shelters on
right-wing voting works through a channel other than the ratings decline discussed above.
With the data at hand, we can not investigate all these possible channels, but one candidate
33is that a nearby shelter simply increases the visibility and salience of the refugee crisis
to voters, leading them to vote for the anti-immigrant party even if there is no perceived
decline in the quality of their neighbourhood.
5 Robustness and validity
5.1 Common trends and balance between treated and
non-treated areas
An important concern is whether the placement of refugee shelters was influenced by
political considerations - they could for example be located in areas where support for
right-wing parties is weaker. Table 18 provides an overview of the differences between
areas close to the eventual locations of refugee shelters (treated) and those further away.
In terms of previous political outcomes, there was no difference between treatment and
control groups. I test this not only for our outcome variable, the right-wing voteshare, but
also for the share of the Green party (the most pro-immigration large party in Germany)
and for the share of nonvoters (since many of the AfD voters came from this group).
Treated areas also did not have different average ratings before, and the share of Turkish
or Middle Eastern restaurants relative to all places was also the same. On the other hand,
there were more Foursquare places in the treated areas, probably because they tend to be
closer to the centre of the city.9
This balance between treated and non-treated areas could however hide diverging trends.
We could find that ratings in areas where shelters would eventually open were higher at
the very beginning of our panel, and falling up to the time when shelters were opened. In
that case, the treatment effect could simply be the continuation of that trend.
To address this concern, I will demonstrate that my cross-sectional treatment variables,
capturing eventual proximity to refugee shelters, do not determine either ratings or voting
outcomes at any time prior to the refugee crisis. The regression specification is
yi,t = αt (treatmenti × TDt ) + ΓXi + FEi + FEt + i,t (14)
9
Similar comparisons for other variables are available upon request.
34You can also read