Electric Cars: Calculating the Total Cost of Ownership for Consumers - BEUC
←
→
Page content transcription
If your browser does not render page correctly, please read the page content below
Electric Cars: Calculating the TCO for Consumers
                                                                                    Final Report

Electric Cars: Calculating the Total
Cost of Ownership for Consumers
Final report for BEUC (The European Consumer Organisation)

25th April 2021

                                                                                            1
Element Energy Limited, Suite 1, Bishop Bateman Court, Thompson’s Lane, Cambridge, CB5 8AQ UK

                                   Tel: +44 (0)1223 852499
Electric Cars: Calculating the TCO for Consumers
                                                                                          Final Report

Executive Summary
Reducing passenger car CO2 emissions is a fundamental part of achieving the EU’s climate ambitions,
including reaching net zero by 2050. Despite recent growth in zero emission vehicle sales, real-world
reductions of car emissions have stalled since 2015, raising the question of whether stronger
manufacturer CO2 targets for 2025 and 2030 are required to meet the EU’s climate goals 1. The Total
Cost of Ownership (TCO) of different powertrains are an important part of this discussion and will
determine how consumers can benefit from, and the ways policy should support, the decarbonisation
transition.

This report forecasts the costs and efficiencies of petrol & diesel internal combustion engine (ICE) and
full hybrid vehicles, as well as low & zero emission powertrains, such as plug-in hybrids (PHEVs),
battery electric vehicles (BEVs) and H2 fuel cells (FCVs)2. The TCOs for different powertrains are
calculated for first, second and third owners for vehicles bought new between 2020-30.

The structure of this report is based around 5 key themes that have emerged from our analysis:
   • Affordable BEVs are just around the corner
   • BEVs bring most benefits to second and third owners
   • Maximising the opportunities for BEV uptake
   • Mitigating the risks to BEV uptake
   • The importance of European CO2 emission standards and national supportive schemes

Affordable BEVs are just around the corner
At an EU level, which excludes purchase subsidies and tax incentives, BEVs are already the cheapest
powertrain on a lifetime TCO basis for medium cars bought today, which is illustrated in Figure 1, and
will become cheapest for small and large cars in 2024 and 2026 respectively. This means that with
suitable financing schemes available to consumers, medium BEVs can provide financial savings from
day 1. While lifetime TCO may not dictate the overall mix of vehicles bought in a market, it shows the
long-term cost optimal solution for consumers.

Figure 1: Lifetime TCO comparison between different powertrains for a medium car. Note that
the year indicates when the car is first bought new.
A significant barrier to BEV market growth is high upfront purchase prices driving greater depreciation
costs for first owners. This is especially important as first owners determine the market stock mix and

1   ICCT 2021 pocketbook http://eupocketbook.org/
2 LPG and CNG have been excluded due to low market share, very limited growth potential & OEM
investment and because they achieve minimal emission reductions.

                                                                                                         2
Electric Cars: Calculating the TCO for Consumers
                                                                                         Final Report

therefore the vehicles available for eventual used car buyers. BEVs do not become the cheapest
powertrain for first owners for small and medium cars until 2025 and large cars in 2026, and should be
supported, in the short term, by government upfront purchase subsidies and tax incentives.

BEV supply has become increasingly less constrained, with manufacturers representing over 30% of
2019 EU sales having announced plans for a fully electrified model line-up by 20303, and additionally
VW Group4 and BMW5 are forecasting 60% and 50% BEVs in 2030 respectively, with VW group
abandoning development of new combustion engines6. In 2020, Volkswagen was the market leader in
terms of BEV sales, driving significant category growth through the new ID.3, with major brands
including Mercedes and Opel gaining share by launching BEV models (see Appendix 6.1). The
introduction of mainstream, lower specification models continues to drive down costs for consumers,
which will be key to realising the TCO savings projected, for example, for medium cars in Figure 1.

BEVs bring most benefits to second and third owners
BEVs offer better financial value to used car buyers than any other powertrain. A medium BEV bought
new today will save a total of almost €9,000 for its second & third owners over a Petrol ICE, which is
illustrated in Figure 2. Improvements to local air quality in urban areas, due to consumers switching to
BEVs, typically most benefits the least affluent consumers. Few used car owners currently benefit from
the financial savings discussed, due to limited availability of BEVs in the used car market. Tightening
emission standards and encouraging OEMs to sell more BEVs, will increase the available stock of used
BEVs.

Figure 2: BEV TCO savings over a Petrol ICE for a medium car for first and used car owners

Figure 3, which presents cost savings vs. Petrol ICE and equity index (defined as first owner / lifetime
TCO) for different powertrains, shows medium BEVs driving the highest market equity as the first owner,
who is most able to afford it, pays a higher proportion of the lifetime TCO. While purchase subsidies
benefit first owners, even with an upfront subsidy of €7,000, a medium BEV would still drive greater
market equity over its lifetime than a Petrol ICE due to the lower running costs offered to second and

3 30% fully-electrified (including PHEVs and HEVs): PSA, Jaguar Land Rover, Ford, Volvo & Tesla
4 www.just-auto.com/news/vw-group-platform-strategy-key-to-e-mobility-rollout_id200799.aspx
5 www.cnbc.com/2021/03/17/bmw-has-no-plans-to-produce-its-own-electric-vehicle-batteries.html
6 www.electrive.com/2021/03/22/vw-brand-joins-audi-in-ending-combustion-engine-development/

                                                                                                        3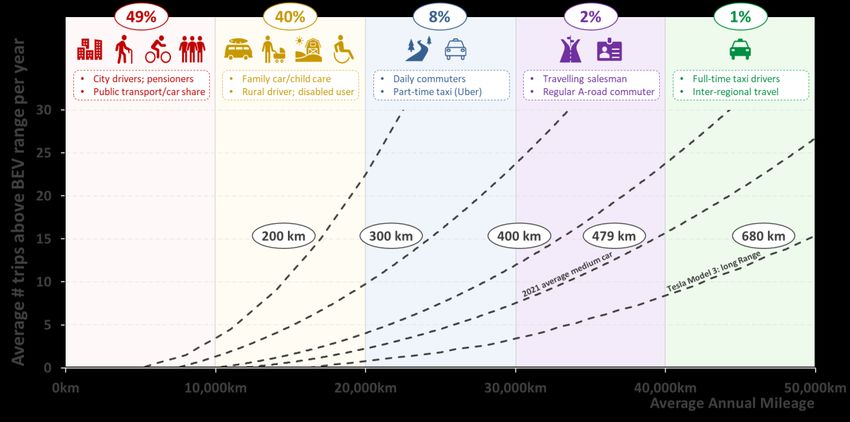
Electric Cars: Calculating the TCO for Consumers
                                                                                          Final Report

third owners. Annual tax breaks benefit all consumers, regardless of ownership period, and when BEVs
are fully available in the used car market, tax incentives will actually increase market equity.

Figure 3: Market equity for medium cars bought new in 2020 (bubble size represents 2020 sales)

Maximising the Opportunities for BEV uptake
50% of total passenger car CO2 emissions are produced by the 25% of consumers with the highest
average annual mileages 7. As BEVs provide the largest savings for high mileage users, there is a clear
opportunity to maximise emission reductions while driving high TCO savings. Figure 4 summarises the
year that BEVs for first owners, averaged over all car sizes, become cheaper than Petrol ICEs on a
TCO basis for several of the sensitivities considered in this report. BEVs are already the cheaper option
for first owner company car drivers (38,000km mileage) today, 4 years before the baseline scenario,
and reduce carbon emissions by over x3 times that of an average consumer (average 12,000km annual
mileage over car’s lifetime) who switches to a BEV. Due to their shorter ownership periods, BEVs owned
by high mileage first owners also offer an opportunity for a rapid uptake into the second and third hand
markets, driving market equity and bringing savings for lower-income consumers.

Despite anxiety over BEV range still impacting consumer attitudes, range is no longer a “real” barrier to
uptake, with an average WLTP range of 479km in 2021 for medium cars, and models with ranges that
exceed 600km currently available. Entry of models such as the VW ID.3, with WLTP ranges up to
550km8, into the mainstream market meet the requirements of high mileage consumers. Indeed, if the
highest mileage consumers were the first to switch to BEVs, for a 60% BEV uptake scenario by 2030,
a 75% reduction in new fleet emissions would be achieved by 2024, which is 4 years earlier than the

7 Analysis based on mileage data from: Ricardo-AEA (2014): Improvements to the definition of lifetime
mileage of light duty vehicles
8 77 kWh version: https://www.volkswagen.co.uk/electric/electric-cars/id3.html

                                                                                                         4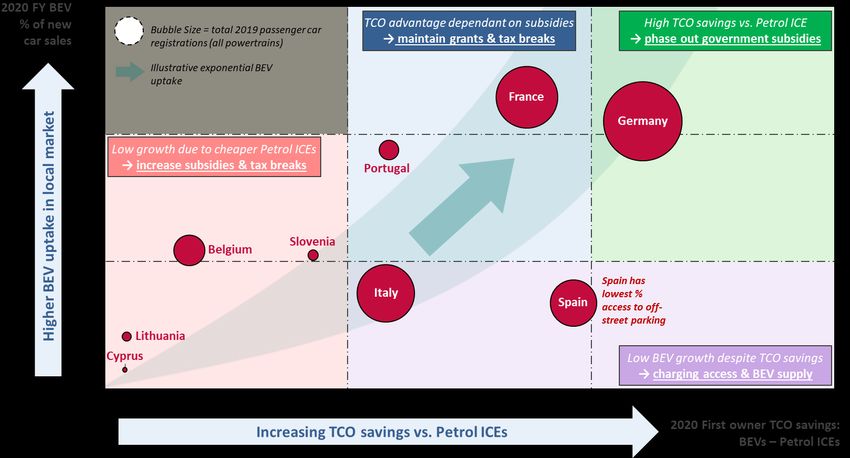
Electric Cars: Calculating the TCO for Consumers
                                                                                             Final Report

baseline case. Investment in en-route rapid charging infrastructure is essential to maximising the
number of high mileage users that switch to BEVs over the next five years.

Many European consumers have off-street parking and can potentially access cheaper off-peak
electricity tariffs for charging. As illustrated in Figure 4, off-peak tariffs only have a secondary impact for
first owners, where depreciation is the dominant cost component, however, for second and third owners,
where running costs become more crucial, BEVs are cheaper by 2021 (car bought in the second-hand
market in 2025), two years earlier than for consumers who use average domestic electricity tariffs. For
consumers that rely exclusively on fast (11-22kW) or rapid (50kW) charging, representative of some
city and sub-urban user groups without off-street parking, the year that BEVs become cheaper than
Petrol ICEs is delayed by only one and two years later respectively than the baseline scenario.

Figure 4: sensitivities showing when BEVs become cheaper than Petrol ICEs for first & second
owners
One of the major advantages of BEVs over internal combustion engine vehicles (ICEVs)9 is that they
provide consumers with an additional flexibility to save cost by choosing a smaller battery with a lower
maximum range. This allows consumers to find an optimum balance between convenience and cost,
with a vehicle to meet their driving needs and priced accordingly.

Figure 5 shows the average number days per year a BEV driver will exceed WLTP range and require
an additional en-route charge each year, across different battery size scenarios. Indeed, results show
that almost 50% of consumers would be suited by a BEV with only a 200km range and would only need
to use en-route charging up to 5 times per year. Consumers should think in terms of the cost savings
per additional trip each year that they are likely to use en-route public charging. In 2021, an average
medium car first owner with a 15,000km annual mileage could save €2,450 (excluding VAT) off the
purchase cost by choosing a smaller 300km range battery and would only need to use en-route charging
an additional 3 times per year (vs. 2021 average medium car with WLTP range of 479km). Investment
into rapid charging infrastructure will allow consumers to trade down into smaller batteries, allowing
significant cost savings and driving additional emission reductions from lower demand of battery raw
materials.

9   ICEVs include Petrol and Diesel ICEs, and HEVs

                                                                                                             5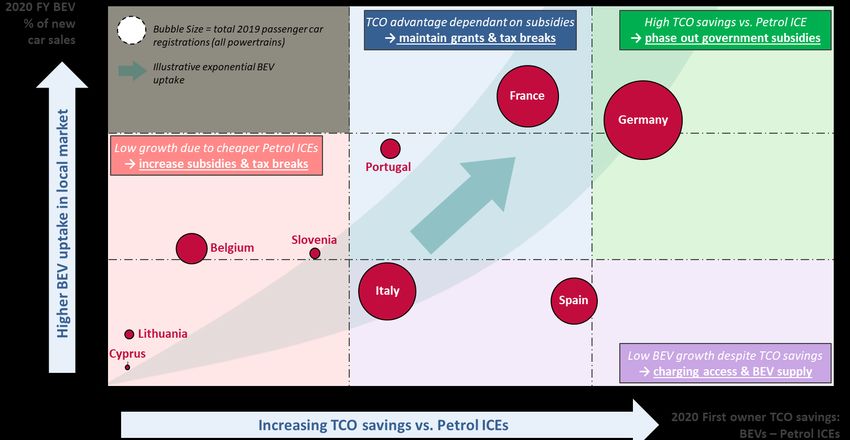
Electric Cars: Calculating the TCO for Consumers
                                                                                          Final Report

Figure 5: average number of days per year a BEV driver will exceed maximum WLTP range and
require an additional en-route charge across different battery size scenarios. Bubbles at the top
of the chart show the proportion of consumers in each mileage band.
Indeed, an average medium car first owner with a 15,000km annual mileage could save an additional
€3,650 (excluding VAT) off the purchase cost by choosing a 200km battery (compared to the current
medium BEV range of 479km). This makes the TCO of such a car competitive with its petrol equivalent
today, a few years earlier than the TCO-parity baseline scenario for first owners. New models, such as
the Dacia Spring (with a range of 200km WLTP), offer very competitive upfront costs and provide an
opportunity for a mass market (which may include user groups such as city/suburban drivers,
pensioners and household second cars) that buys smaller and cheaper vehicles but are still willing to
buy new.

Mitigating the Risks to BEV Uptake
BEVs provide a clear path to maximise value for consumers and to reduce carbon emissions. Figure 6,
which shows the financial cost & tailpipe CO2 impact of buying a powertrain other than a BEV in 2025
against the likelihood of each powertrain to grow, summarises the varying risk profiles. Full Hybrids
(HEVs) have a strong current growth trend, which has been exacerbated by misleading language such
as “self-charging”, and risks locking in long-term high carbon emissions into the market stock.
Consumers will be 14% financially worse off on a lifetime TCO basis for each medium HEV that enters
the market in 2025 over a BEV.

Unless PHEVs are charged every day, they increase costs and emissions for consumers. This is
particularly important as many PHEVs sales are driven by company car fleets for tax purposes, without
granting access to home charging or a “charging card” to employees. The risk is even greater for second
and third hand users which are less likely to have access to off-street parking, driving long-term market
inequity. Indeed, for a medium PHEV bought in 2020, the lifetime TCO difference between high and no
charging is almost €14,000. Under a low charging scenario, representing a consumer that uses weekly
destination charging, consumers will only achieve around 50% CO2 of the reductions compared to
WLTP values, which are the official figures provided to consumers. Given that it is impossible to ensure
that PHEVs will only ever be used by consumers that have adequate charging access and that, even
in the most optimistic charging scenario, PHEVs offer increasingly worse value to BEVs, it is critical to
consider PHEVs as a risk to consumers rather than a “stepping stone” to fully electric vehicles.

                                                                                                         6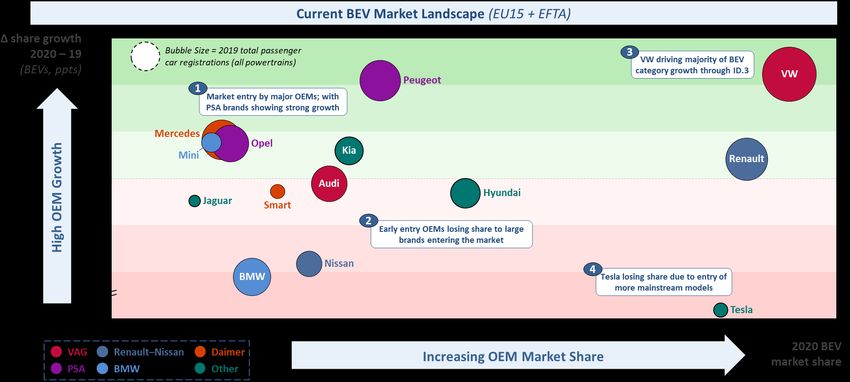
Electric Cars: Calculating the TCO for Consumers
                                                                                          Final Report

Figure 6: overall risk assessment of non-BEV powertrains in 2025 for a medium car. Bubble size
represents current powertrain share of total European passenger car registrations
E-fuel10 market entry would be financially detrimental for consumers. Even under optimistic projections
(relying on Middle East solar PV for cheap production), E-fuels do not reach price parity to petrol until
2037 and currently consumers would need to pay premiums of over 80%. For medium cars bought
anytime between 2020-30, BEVs will always cost consumers over 20% less than ICEVs running on E-
fuels on a lifetime TCO basis. Any push for the use of E-fuels in passenger cars risks diverting
investment (with significant subsidies required to bring E-fuels to mass market) away from improving
charging infrastructure & accelerating BEV uptake, with no clear long-term benefits to consumers.

Euro 7 is essential to ensure air quality improvements in urban environments and reduce the harmful
effects of pollution. To meet Euro 7 requirements, currently forecast to come into force between 2022-
24, OEMs are expected to pass increased costs onto ICEV consumers, which brings forward when
BEVs reach parity to ICEVs for first owners. Alongside the serious implications for air quality, delays to
Euro 7 would mean that governments would need to continue to subsidise BEVs for several years
longer to achieve the high growth necessary for decarbonisation.

The importance of European CO2 emission standards and national supportive schemes
Analysis shows that for a European country in line with the EU average, purchase subsides could be
phased out between 2022-26, with annual tax breaks no longer needed by 2030. Long-term subsidies
risk OEMs focusing supply towards highly subsidised markets, being able to artificially maintain inflated
pricing, while limiting BEV supply in European countries without subsidies. This shows the need for EU
wide policy to ensure that BEVs become available for all European consumers.

TCOs for 9 specific European markets11 were analysed within the scope of this project, with detailed
findings to be published in 9 additional reports (country results include tax incentives and purchase
subsidies). Significant variation is seen in terms of the TCO savings available to BEV first owners vs.

10 E-fuels including carbon-neutral synthetic fuels made from renewable electricity that can power
internal combustion engines (ICEs) without the environmental impact of traditional fossil fuels
11 Belgium, Cyprus, France, Germany, Italy, Lithuania, Portugal, Slovenia, Spain

                                                                                                         7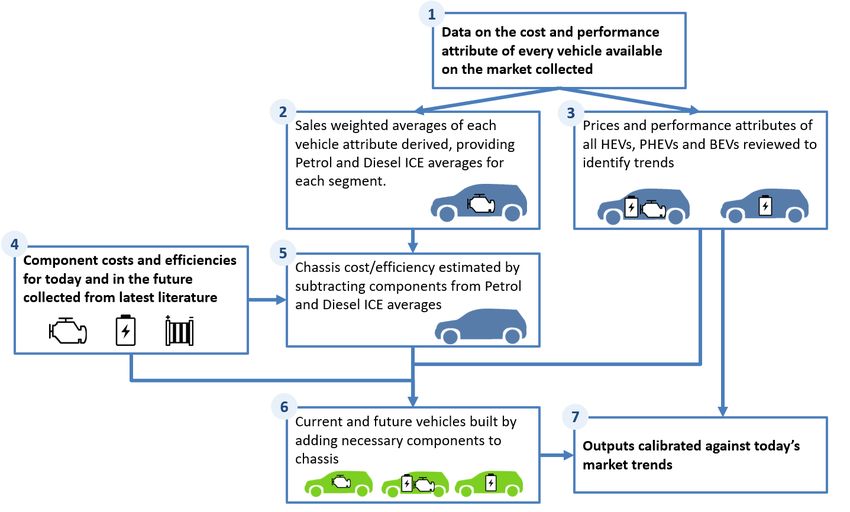
Electric Cars: Calculating the TCO for Consumers
                                                                                         Final Report

an equivalent Petrol ICE. Figure 7 shows an overview of the BEV share of new sales in 2020 against
first owner TCO savings for BEVs vs. Petrol ICEs for a weighted average of small and medium cars.

Figure 7: small & medium cars BEV % of 2020 market sales vs first owner Δ TCO to Petrol ICEs
Position on this landscape correlates with country specific strategies to accelerate BEV uptake. Located
in the purple segment, there is strong evidence that limited access to off-street charging and expensive
public electricity tariffs are already limiting BEV growth in some focus markets, such as Spain,
emphasizing the need for immediate action to improve charging infrastructure. As lifetime costs are
increasingly no longer a barrier to BEV uptake (which must be communicated clearly to consumers),
European and national policy must focus on ensuring: (1) consumers can access convenient and
affordable charging points (2) OEMs supply affordable BEVs to meet the requirements of different
consumer groups. The evolution of first owner TCO savings for BEVs vs. Petrol ICEs over 2020-30 for
a weighted average of small and medium cars is showing in Figure 8.

Figure 8: evolution of first owner TCO Δ between Petrol ICEs and BEVs for a weighted average
of small and medium cars across European focus markets. Year indicates when car bought new.

                                                                                                        8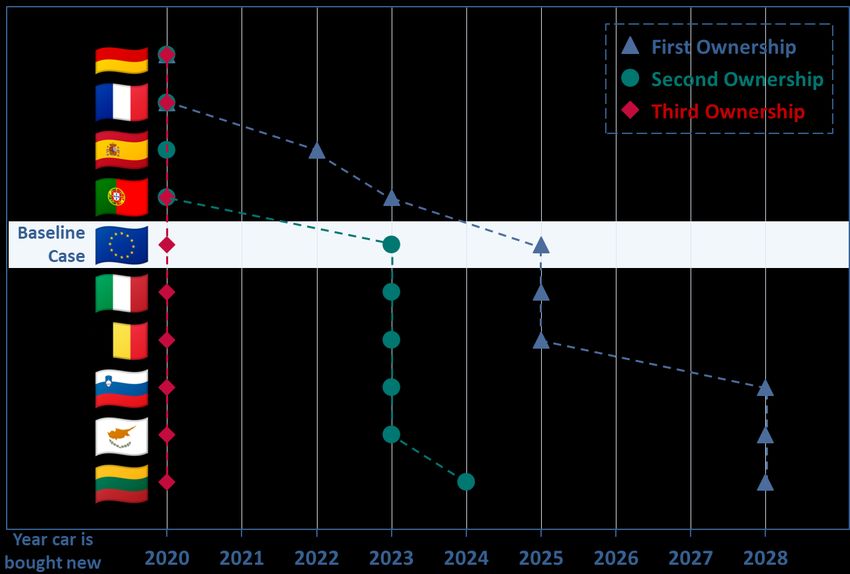
Electric Cars: Calculating the TCO for Consumers
                                                                                            Final Report

Short-term TCO differences between markets from 2020-23 are largely driven by the size of government
subsidies and their projected phase out. Savings for first owners that buy a BEV increase sharply from
2023-25 due to the prevalence of cheaper, more mainstream electric vehicle models entering the
market and costs from additional Euro 7 requirements for Petrol ICEs being passed onto consumers.
Additional savings flatten between 2026-30 and country variation is a function of different running costs,
with Spain and Portugal providing the highest savings due to longer ownership periods.

EU vehicle manufacturer CO2 emission targets have been the main mechanism for the decarbonisation
of the European passenger car fleet. Figure 9 illustrates forecast WLTP emissions between 2020-30
under different BEV uptake scenarios (EU emission targets converted to WLTP 12). This demonstrates
that the current targets are not stringent enough to drive sufficient growth of BEV sales, in line with
providing the lowest cost and emission transport option to as many consumers as possible, with the
current 2030 emission target achievable with less than a 40% BEV EU uptake by 2030. For example,
to reach a more ambitious target of 60% BEV market share by 2030 13, a WLTP target of below
26gCO2/km would be appropriate. Higher BEV uptake will reduce long-term costs for consumers,
especially those on lower incomes buying used cars.

However, the timing of BEV uptake is just as important as the final percentage of market share reached
by 2030. For a 60% BEV market share of new sales by 2030, an early adoption scenario, akin to the
uptake seen in markets such as Norway, would achieve a total passenger car fleet (old and new sales)
CO2 reduction of 52% by 2030 compared to 2020 levels, whereas a late adoption strategy only leads
to a 34% reduction, risking increased costs and emissions for consumers. Emissions targets should
reflect a continual decrease over the next decade, to avoid the risk of OEMs peaking sales to meet
2025 & 2030 targets. Moreover, a delayed BEV uptake has substantial consequences for the total car
fleet (old and new cars) make-up in 2030, with ICEVs remaining in the market stock much longer with
later BEV adoption. It is essential that targets reflect the fact that the earliness of BEV uptake is just as
important as the final percentage of BEV sales reached by 2030.

Figure 9: new fleet WLTP CO2 emissions for BEV uptake scenarios compared to current EU
targets

12 Using a x1.15 conversion factor from NEDC based on:
https://theicct.org/sites/default/files/publications/ICCT_EU-CO2-stds_2020-30_brief_nov2016.pdf
13 A 60% BEV market share by 2030 is the preferred option in this study as it maximises financial and

environmental benefits under an early adoption scenario while leaving room for BEV supply by OEMS.

                                                                                                           9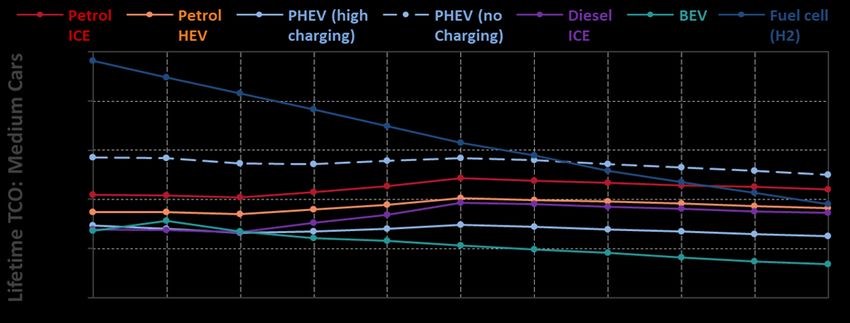
Electric Cars: Calculating the TCO for Consumers
                                                                                                                  Final Report

Contents
Executive Summary .................................................................................................................
1      Introduction..................................................................................................................... 1
2      Project Methodology ...................................................................................................... 3
    2.1    TCO Overview ........................................................................................................... 3

    2.2    Vehicle Scope ........................................................................................................... 3

    2.3    Cost and Performance Modelling .............................................................................. 5

    2.4    Ongoing Ownership Assumptions ............................................................................. 6

3      Vehicle TCO Results: Consumer Cost Saving in the Decarbonisation Transition ......... 8
    3.1    Overall TCO Results ................................................................................................. 8

    3.2    Country Specific Overview ...................................................................................... 14

    3.3    Implications for CO2 Emissions of New Cars ......................................................... 19

    3.4    Implications for Consumer Equality ........................................................................ 23

4      Sensitivities: Analysis of Specific User Groups ............................................................ 26
    4.1    Opportunities to Maximise TCO Savings Available from BEVs .............................. 26

    4.2    Risk to Consumer Benefits within the Decarbonisation Transition ......................... 32

5      Conclusions .................................................................................................................. 39
6      Appendix ...................................................................................................................... 42
    6.1    2020 OEM BEV Landscape .................................................................................... 42

    6.2    Methodology Assumptions ...................................................................................... 43

    6.3    Additional TCO Results ........................................................................................... 45

    6.4    Additional Battery Scenario Distributions ................................................................ 50

    6.5    E-fuel Forecasting ................................................................................................... 50

                                                                                                                                             10
Electric Cars: Calculating the TCO for Consumers
Final Report
Authors
Laurence Peplow, Consultant
Charles Eardley, Consultant
For comments or queries please contact: Laurence.Peplow@element-energy.co.uk
Reviewers
Celine Cluzel, Director
Richard Riley, Principal Consultant
David Garrick, Senior Consultant
Acknowledgments
The authors of this study would like to acknowledge the participation of the following individuals and
their organisations, and thank them for their input:
Robin Loos (BEUC), Dimitri Vergne (BEUC), Laurens Rutten (BEUC), Anna Lamy (UFC-Que Choisir)
Mélissa Chevillard (UFC-Que Choisir), Alexandre Marvao (Deco Proteste), Stamatis Rossides (CCA),
Luis Perez (OCU), Kęstutis Kupsys (LVOA), Roberto Paglia (Altroconsumo), Leo Muyshondt (Test-
Achats/Test-Aankoop), Okorn Boštjan (Slovene Consumers' Association – ZPS), Kolbe Gregor (VZBV)
This study was carried out using a continuous peer review process, during which local market experts,
from a number of different organisations working on automotive affairs, provided contributions. The
information and views set out in this report are those of the author(s) and do not necessarily
reflect the opinions of those individuals or their organisations involved during the peer review
process.Electric Cars: Calculating the TCO for Consumers
Final Report
Acronyms
ACEA European Automobile Manufacturers' Association
BEUC The European Consumer Organisation
BEV Battery electric vehicle
EE Element Energy
EU European Union
EV Electric vehicle
FCV Fuel cell vehicle
HEV (Full) Hybrid electric vehicle, non-plug in
ICE Internal Combustion Engine
ICEV Internal Combustion Engine Vehicle
IEA International Energy Agency
LDV Light duty vehicle
LED Light emitting diode
NEDC New European Driving Cycle
OEM Original equipment manufacturer
PHEV Plug-in hybrid electric vehicle
TCO Total cost of ownership
ULEV Ultra-low emission vehicle
VAT Value added tax
WEO World Energy Outlook (IEA)
WLTP Worldwide harmonized Light vehicles Test ProcedureElectric Cars: Calculating the TCO for Consumers
Final Report
1 Introduction
In order to achieve decarbonisation in the passenger car sector required by EU timelines, a rapid
transition to electric vehicles will be required. There are several factors that will impact the rate at which
decarbonisation happens, including: the cost to consumers, provision of charging and the supply of
EVs.
This study explores the cost aspect of the transition, by analysing the TCOs of different car powertrains
at an EU and national level. It is important that electric vehicles are cost effective for consumers and,
where required, government policy is put in place to make decarbonisation affordable. This is essential
to deliver a just and equitable decarbonisation transition for all European consumers.
1.1.1 Background & Context
In 2018, the transport sector made up 24% of EU-27 (+EFTA +UK +Turkey) Greenhouse Gas Emissions
(GHG), of which road vehicles (cars, vans, heavy duty trucks and buses) are the most significant
contributors, representing 94% of transport emissions, with cars making up the biggest share at 57% 14.
Reducing emissions is essential to achieve the EU climate goals, which currently aims to realise a 55%
reduction in GHG from 1990 levels by 2030, and through the European Green Deal, reach net zero
emissions by 2050. The transport sector has a long-term target to achieve 90% reductions from 1990
levels by 2050.
The EU vehicle manufacturer CO2 emission targets, which now cover cars, vans and trucks, have been
the main policy mechanism for decarbonising the vehicle fleet. Manufacturers must ensure that the
average CO2 emissions across the fleet of vehicles they sell in a year meet specific emission targets.
These targets have mostly been set at 5-year intervals and designed so that the targets fall significantly
over time. Car targets Regulation (EU) 443/2009 and 2019/631 - introduced in 2009 and updated
subsequently, has set EU wide CO2 targets for car manufacturers of:
• 130gCO2/km on average across the fleet by 2015; 95gCO2/km on average by 2021 (specific
emission targets for manufacturers take into account the average test mass of a manufacturer’s
newly registered vehicles).
• 15% reduction in fleet average CO2 emissions between 2021-25; 37.5% reduction between
2021-30.
• Several mechanisms have been put in place to ease manufacturers’ efforts to reach their
targets: 95% phase-in for 2020 (excluding 5% most emitting new cars), granting of super-credits
for zero and low emission vehicles, counting of eco-innovations and emissions pooling between
OEMs.
Despite emissions targets and growth of low and zero emission vehicles, new fleet passenger CO2
emissions have actually increased between 2016-1915. This has been driven by a number of factors
including stalling efficiency improvements to ICEVs, sales mix shift to larger SUVs and limited growth
of electric vehicles.
The recent surge in EV sales for compliance purpose is a reminder that the EU vehicle manufacturer
CO2 emission standards can be a strong market force, countering their historical inability to force
manufacturers to introduce low emission vehicles at the rate needed to meet the ambitious carbon
reduction targets. This has left countries with strong national decarbonisation commitments to find
additional policies to accelerate the decarbonisation of the fleet (these include policies such as large
grants for purchasing BEV in many countries and national commitments to end of the sale of petrol,
14 European Environment Agency (EEA) (2018), Greenhouse Gas – Data Viewer
15 https://www.eea.europa.eu/data-and-maps/daviz/average-emissions-for-new-cars-6#tab-chart_1
1Electric Cars: Calculating the TCO for Consumers
Final Report
diesel, hybrid and plug-in hybrid cars between 2030-2040). The future European CO2 reduction targets
are being reviewed and are expected to be made more stringent (than the current 37.5% reduction by
2030 for passenger cars). This will ensure a steady reduction in average fleet emissions, increasing
long-term BEV supply, while putting an end to existing testing and regulatory loopholes.
1.1.2 Aims of this Study
As policy discussions continue within Europe about the level of ambition needed for new vehicle
emissions in the 2020s and the mechanisms to be used to deliver them, it is timely to assess the future
cost impacts of zero emissions vehicles on private and fleet vehicle users, and in particular whether the
lower running costs will outweigh higher upfront costs. This report by Element Energy was
commissioned by BEUC (The European Consumer Organisation), to explore the Total Costs of
Ownership (TCO) of cars sold in the 2020s. Specifically, the study aims were as follows:
• Synthesise the latest evidence on future costs and performance of new cars, covering
incremental improvements to petrol and diesel cars as well as low and zero emission
powertrains.
• Develop a robust set of assumptions for the other components of vehicle ownership costs, such
as depreciation rates, fuel costs, maintenance and insurance, and how these are likely to evolve
in the future for each powertrain.
• Calculate and compare the Total Costs of Ownership for different powertrains between 2020-
30. This includes an assessment of how costs are likely to vary for first, second and third
owners. Complete TCO analysis for an EU baseline and consider 9 European focus markets
(Belgium, Cyprus, France, Germany, Italy, Lithuania, Slovenia, Spain, Portugal).
• Explore wider implications for consumer equity and impact of CO2 emissions on consumers
from the purchase of different powertrains.
• Examine the sensitivity of the results to changes in input assumptions, including different
average annual mileages, battery sizes, Euro 7 timings, E-fuels & electricity tariffs.
• Draw conclusions on the implications of the results for consumers and post-2020 policy
mechanisms to drive decreases in new vehicle emissions and improved cost-effective
consumer mobility.
1.1.3 Report Structure
In Section 2, the methodology is detailed with an overview of vehicle scope and cost & performance
modelling. The ongoing ownership assumptions, including: fuel & electricity pricing, average annual
mileages, depreciation rates, insurance and maintenance costs, are also discussed.
Baseline TCO results for cars bought new between 2020-30 for different ownerships are outlined in
Section 3, which includes an overview of country-by-country differences for 9 scope European markets
and a discussion of the implications for consumer equity and CO 2 emissions.
Section 4 shows TCO sensitivities that explore different user groups of consumers where there may be
opportunities for earlier adoption of Battery Electric Vehicles (BEVs) or specific risks to consumer
uptake of low emission vehicles. Overall conclusions and implications for EU CO2 emissions targets
are given in Section 5.
2Electric Cars: Calculating the TCO for Consumers
Final Report
2 Project Methodology
In this Section, the methodology is detailed with an overview of vehicle scope and cost & performance
modelling. The ongoing ownership assumptions are discussed, which includes: fuel & electricity pricing,
average annual mileages, depreciation rates, insurance and maintenance costs, as well as
assumptions around PHEV charging scenarios.
2.1 TCO Overview
Figure 10 shows the make-up of the total cost of ownerships (TCO) in terms of its individual cost
component. This includes both upfront purchase cost (including VAT) and vehicle running costs.
Figure 10: breakdown of the TCO cost components
2.2 Vehicle Scope
The TCO work presented here focuses on generalised cars of specific size segment and powertrain
types, rather than predicting future TCO for any individual car makes or models. By taking this approach
the TCO of an ‘average’ vehicle is shown which is readily comparable across different European
markets.
In this report we consider 3 car size segments: small; medium; large, based broadly on ACEA
segmentation16, and 6 powertrains: petrol and diesel internal combustion engines (ICE); petrol hybrid
(HEV) electric vehicles; petrol plug-in hybrid (PHEV) vehicles; battery electric vehicles (BEV); and
hydrogen fuel cell vehicles 17. A brief description of each powertrain is included below. Figure 11 shows
a graphic representation of the powertrain components included in each powertrain.
16 Specialist Sport and Luxury Car are excluded from the large segment, to best reflect the choice for
an average consumer
17 Please note: LPG and CNG have been excluded due to low market share, very limited growth
potential & OEM investment and because they achieve minimal emission reductions
3Electric Cars: Calculating the TCO for Consumers
Final Report
Figure 11: Graphic representation of the powertrain components included in each powertrain.
Internal Combustion Engine (ICE)
Conventional vehicle comprising of an internal combustion engine and a fuel tank for fuel storage. Note
that this powertrain can incorporate start-stop technology and micro-hybridisation, such as belt driven
starter generators and 48V electrical systems.
Full Hybrid Electric Vehicle (HEV)
Similar to an ICE but supplemented with an electric motor and battery pack allowing it to drive short
distances at low speed under electric-only power. The battery is charged by the engine, rather than an
external power source. This configuration improves the fuel consumption relative to a conventional ICE,
at the expense of additional capital cost.
Plug-in Hybrid Electric Vehicle (PHEV)
A hybrid electric vehicle with a larger battery which can be recharged by plugging into an external source
of power, as well as by the engine. This enables a portion of overall energy consumption to be provided
by electricity, rather than fuel. Recent analysis has shown that the real-world fuel consumption and
emissions of PHEVs can be quite different to the WLTP values18, principally due to significant
differences in the charging frequency assumed in official test cycles and how consumers appear to be
behaving. In this report we present TCO findings for both PHEVs which are charged regularly (following
the assumptions included in the WLTP specification 19) and for PHEVs which are never charged, and
therefore drive under ICE power at all times, and PHEVs which are charged at destination charge points
a few times a week. These three approaches are included to cover the range of values we expect
consumers to fall within.
Battery Electric Vehicle (BEV)
Uses electric motors for propulsion, which are powered entirely by electricity stored in a battery. The
battery is charged by plugging into an external electricity source.
H2 Fuel Cell (FCEV)
Powered by a hydrogen fuel cell, which converts the chemical energy in hydrogen to electricity through
an electrochemical reaction in order to power an electric motor.
18 Transport & Environment (2020) Plug-in hybrids: Is Europe heading for a new Dieselgate?
19 UN/ECE Regulation 101, Annex 8, pg. 74
https://www.unece.org/fileadmin/DAM/trans/main/wp29/wp29regs/r101r2e.pdf [Accessed 12/03/2021]
4Electric Cars: Calculating the TCO for Consumers
Final Report
2.3 Cost and Performance Modelling
The TCO forecasts presented in this report are derived from projections for future vehicle attributes
from Element Energy’s Cost and Performance Model. This model takes a bottom-up approach to
forecasting future vehicle attributes out to 2030, whereby powertrain components are added onto a
blank chassis and their associated vehicle attributes (such as cost, weight, and efficiency) are
aggregated to the vehicle level.
Figure 12 outlines the basic calculation structure of the Cost and Performance Model. Blank chassis
are identified by removing components from known archetype vehicles, and future vehicles are
constructed by adding back the required components for each powertrain. The cost, mass, and
efficiency for each component is added together to create the overall vehicle characteristics, and
individual projections for each component allow for very granular insight into the effect on overall vehicle
performance.
Figure 12: Outline of the methodology applied in the Cost and Performance Model
In addition to the required powertrain components, each vehicle has a suite of efficiency measures
deployed which change the overall vehicle characteristics, with an associated efficiency, weight and
cost impact. 45 individual efficiency technologies are applied to vehicles, each with an individual cost
curve and deployment projection which are taken from Ricardo-AEA’s 2016 cost curve study for the
European Commission20.
Vehicles are constructed from the drivetrain components required to move the vehicle (engine, motor,
battery, etc), and the chassis which forms the remainder of the vehicle (outer body of the vehicle, seats,
windows, air-conditioning system etc). Drivetrain components define the powertrain and vary between
vehicle types, whilst the chassis is common between powertrains. Detailed forecasts of component
cost, mass, and efficiency are input into the model, so these can be defined accurately. The blank
chassis however is treated as a black box: the model does not explicitly consider what materials go into
the chassis or how these change over time; instead, the model considers how the chassis evolves as
a whole. It is assumed that the chassis is common between related powertrains in the same size
segment. Figure 13 shows a more detailed view of the modelling approach employed.
20Ricardo-AEA. Improving understanding of technology and costs for CO2 reductions from cars and
LCVs in the period to 2030 and development of cost curves. 2016.
5Electric Cars: Calculating the TCO for Consumers
Final Report
Figure 13: Overview of steps taken to construct future vehicles. Numbers indicate modelling
order.
Once the overall manufacturing cost of each vehicle has been calculated, a margin is applied to
calculate the purchase price a consumer would see in a showroom. The margins used are based on
literature review21,22,23,24 and market research conducted by Element Energy.
In order to have a representative baseline off which to base future vehicles, 2020 archetype vehicles
are identified for each segment and powertrain. These archetypes represent a sales-weighted average
of ICEs and were determined by an analysis of the over 9,000 vehicle models on sale in October 2020.
The ICE archetypes generated are used to determine the basic properties of the vehicle chassis which
are assumed to be common amongst vehicles of the same size segment. An analysis of all HEV, PHEV,
and BEV vehicles on sale was also undertaken in order to identify representative 2020 archetypes
which are used for the purpose of model calibration.
2.4 Ongoing Ownership Assumptions
2.4.1 Fuel and Electricity Projections
Future EU-average petrol and diesel pricing was derived using the IEA World Energy Outlook (WEO)
2019’s Stated Policies forecast global oil prices25, and based on a historic correlation modelled between
oil and petrol & diesel prices between 2010-20, with VAT and fuel duty taken as population weighted
average of each EU member state. Price at pump for hydrogen sources from Hydrogen Council (2020)
Pathway to Hydrogen Competitiveness using the Gaseous Trucking scenario26. Residential electricity
forecasting has been taken from World Energy Outlook 2019 Stated Policies scenario27. Please note
21 Roland Berger (2014) Global Automotive Supplier Study
22 KPMG (2013) Automotive Now, Trade in crisis
23 Holweg, Matthias, and Pil (2004) The Second Century: Reconnecting Customer and Value Chain
through Build-to-Order – Moving Beyond Mass and Lean Production in the Auto Industry
24 Cuenca, Gaines, Vyas (1999) Evaluation of Electric Vehicle Production and Operating Costs
25 International Energy Agency (2019) World Energy Outlook: Global Oil Forecast
26 Hydrogen Council (2020) Pathway to Hydrogen Competitiveness
27 International Energy Agency (2019) World Energy Outlook: Residential Energy
6Electric Cars: Calculating the TCO for Consumers
Final Report
that no off-peak discount has been included in the baseline results. Full fuel and electricity pricing
assumptions are detailed in Appendix 6.2.1.
2.4.2 Depreciation and Residual Values
Analysis of real world vehicle residual value data, for varying vehicle ages and mileages, was completed
for over 9,000 models of cars, which was used to correlate depreciation rates for different powertrains
and car sizes. An example of the depreciation rates found across different powertrains are shown for a
4-year-old vehicle having completed 64,000km in Appendix 6.2.2. In general, analysis revealed that
there is minimal difference in depreciation rates across powertrains, with more minor trends including:
• Smaller cars depreciate faster than large and medium cars
• Diesel ICEs depreciate slightly faster than Petrol ICEs
• Petrol HEVs and PHEVs show similar depreciation to Petrol ICEs
• BEVs are similar to Petrol ICEs, except Large BEVs which depreciate much slower. This is
because this segment is currently dominated by Tesla Model X and S which have low
depreciation.
Please note that no additional savings have been included for BEVs for the sale of end-of-life batteries.
2.4.3 Insurance and Maintenance
Price comparison websites were used to gather insurance cost data for top selling car models.
Insurance costs were found to be strongly correlated with vehicle purchase price and are largely
independent of powertrain.
Analysis of annual maintenance data, based on “real world” costs paid by consumers, shows a strong
correlation with vehicle purchase price, with differences observed across powertrains. Maintenance is
generally required most often for Petrol ICEs and least for BEVs. However, as BEVs are currently more
expensive than ICEVs, requiring higher specification parts, this difference is largely offset and overall
maintenance costs are similar.
2.4.4 Ownership Periods
The TCO results in this study are given for first, second and third owners of passenger cars, with
ownership periods of 4, 5 and 7 years in length respectively. This reflects the tendency for ownership
periods to increase with vehicle age. Correspondingly, annual vehicle driving distance is also known to
decrease with vehicle age28, and as such annual mileages of 15,000 km, 12,000 km and 10,000 km are
applied to the TCO calculation of average EU-27 first, second and third hand owners respectively.
2.4.5 Plug-in Hybrid Charging
Three charging scenarios have been considered for PHEVs to reflect the significant variation in driver
charging behaviour29:
1. High Charging – typical of a driver that has access to daily home charging. Utility factors are
sourced from European Commission regulation regarding WLTP testing of PHEVs30.
2. Low Charging – representative of a driver who does not have access to daily home or work
charging and relies on destination charging (e.g. at a supermarket) a couple times per week.
3. No Charging – a driver who does not charge their PHEV and relies 100% on combustion fuel
28 Ricardo-AEA (2014) Improvements to the definition of lifetime mileage of light duty vehicles
29 Fraunhofer-Institut für System- und Innovationsforschung ISI (2020), Real-world usage of plug-in
hybrid electric vehicles. Fuel consumption, electric driving, and CO2 emissions
30 European Commission, COMMISSION REGULATION (EU) 2017/1151 of 1 June 2017, Sub-Annex
8, Appendix 5
7Electric Cars: Calculating the TCO for Consumers
Final Report
3 Vehicle TCO Results: Consumer Cost Saving in the
Decarbonisation Transition
In this Section, EU Baseline TCO results are discussed for cars bought new between 2020-30 for
different ownerships (first, second & third), and includes an overview of country-by-country differences
for 9 scope European markets with discussion around the implications for consumer equity and CO 2
emissions from different powertrains.
3.1 Overall TCO Results
This sub-section looks at: (A) the lifetime (16 years) TCOs of different vehicle powertrains purchased
between 2020 and 2030 to show the total costs that will be faced by consumers for car ownerships in
the decarbonisation transition and (B) the first ownership (4 years), which is especially important as it
dictates the long-term market stock. Equivalent graphs detailing the second (5 years) and third
ownerships (7 years) can be found in Appendix 6.3.
Please note that these charts do not include BEV subsidies or tax breaks, which are available for
consumers in many European markets.
3.1.1 Lifetime TCO
Figure 14 compares the TCOs between different powertrains on a total lifetime basis. Each data point
illustrates the TCO over the 16-year lifetime of the car, starting from the year that the car was bought
new, which is shown on the x axis. Separate trends are considered for small, medium and large cars.
While lifetime TCO may not dictate the overall mix of vehicles bought in a market, it shows the cost
optimal solution for consumers.
The key finding is that BEVs are already the cheapest powertrain for medium cars bought today, with
small and large cars following in 2024 and 2026 respectively. Petrol PHEVs cost broadly the same on
a TCO basis as BEVs in the large segment, but this is due to a high share of driving assumed under
electric power. Without charging (as it is the case for many company cars), Petrol PHEVs become the
most expensive powertrain. The introduction of Euro 7 requirements between 2022-24 has a significant
impact on petrol and diesel lifetime TCOs because VAT is paid on these capital costs three times.
BEVs still have the appearance of being unaffordable for many consumers, largely due to the fact that
a majority of BEVs are currently concentrated in the first owner market. However, the emergence of
specific electric car financing schemes, such as Onto and elmo31, which structure pricing largely on a
TCO basis, by including insurance, maintenance, annual car tax and breakdown cover, alongside a
wider leasing market increasingly available to consumers, provide opportunities to unlock the lifetime
benefits of BEVs over other powertrains from day one.
31 https://www.theguardian.com/money/2021/mar/14/first-there-was-netflix-now-you-can-subscribe-to-
an-electric-car?CMP=Share_iOSApp_Other
8Electric Cars: Calculating the TCO for Consumers
Final Report
Figure 14: Lifetime TCO comparison between different powertrains. Note that the year indicates
when the car is first bought new.
3.1.2 First Owner TCO
The relative first owner TCOs are forecast for the various powertrains in
Figure 15. The TCOs for BEVs and FCEVs will drop significantly over the next decade, driven by falling
battery and fuel cell costs, leading to a lower upfront price, which removes a strong psychological barrier
9Electric Cars: Calculating the TCO for Consumers
Final Report
to consumers. BEVs become cheaper on a TCO basis for all car sizes by 2026. Note the slight increase
to costs for medium BEVs in 2021 is due to models with larger battery sizes entering the market.
Figure 15: First owner TCO comparison between different powertrains. Note that the year
indicates when the car is first bought new.
Although BEVs bought new today will provide significantly better value for second and third owners, it
is especially important to consider the first ownership as it impacts new buyer purchasing decisions,
which in turn determines the long-term market stock. Small BEVs become the cheapest powertrain a
year before medium and large cars, and will provide savings of around €4,000 by 2030. This provides
an opportunity for a mass market that buys smaller and cheaper vehicles, and it is crucial for small BEV
models, which have historically been limited, be made available for consumers by OEMs. With new
models equipped with smaller batteries (see Section 4.1.2), the potential for lower-income consumers
to participate in the decarbonisation transition as first owners is even greater. As seen in the case of
lifetime TCOs, PHEVs which are not charged provide the worst financial value to consumers.
10Electric Cars: Calculating the TCO for Consumers
Final Report
All of the 9 European countries within the project scope offer either purchase grants and/or tax
incentives for BEVs. Subsidies help make BEVs cheaper for first owners and encourage higher market
share of new sales. This builds up the overall long-term BEV market stock, which unlocks substantial
savings for second and third owners, while reducing carbon emissions. Figure 16 shows the differences
in first owner TCOs between a small BEV and Petrol ICE, for both the baseline case and with the
addition of a purchase grant (limited to €5,000) and an annual tax break (up to €500 per year), which is
representative of many European markets, such as the Annual circulation tax (ACT) in Belgium. The
bottom chart shows the phase out of the purchase grant and tax breaks that can be achieved while still
maintaining a +€4,000 first owner TCO advantage for BEVs over Petrol ICEs (which is shown by the
red line in the top chart) to drive uptake growth.
This scenario demonstrates that, for a country in line with EU average parameters, it is essential to
maintain full BEV subsidies until 2022, however, it will be possible to phase out purchase grants
between 2022-26 and tax breaks from 2026-30 while still achieving an additional +€4,000 saving for
consumers over the first ownership period. The timeline over which specific policymakers should
remove BEV subsidies for first owners varies from country to country, with significant variation due to
different vehicle pricing, average annual mileage and fuel & electricity costs. A country specific overview
is discussed in detail in Section 3.2.
Figure 16: first owner TCO savings for small BEV vs. Petrol ICE with addition of BEV subsidies
(top graph) & subsidies needed to maintain the modelled scenario marked in red (bottom graph)
It is best practice to phase out subsidies before tax breaks, as policy costs can quickly escalate as
higher proportions of first owners buy BEVs. There is an increasing risk of subsidising first owners who
would have likely bought a BEV anyway, especially by the time BEVs become cheaper than Petrol ICEs
in 2025. Furthermore, this may drive market inequity, which is discussed in detail in Section 3.4. Long-
term subsidies also risk OEMs focusing supply towards highly subsidised markets, being able to
artificially maintain inflated pricing, while limiting BEV supply in European countries without subsidies.
This shows the need for EU wide policy, with Euro 7 and manufacturer CO2 emissions standards
essential to ensure that BEVs, and their associated financial and carbon benefits, become available for
all European consumers.
11Electric Cars: Calculating the TCO for Consumers
Final Report
3.1.3 TCO component Evolution between Ownerships
Purchase price differences between ICEVs and BEVs become smaller for used owners, which means
that savings will be available to the eventual second and third owners of medium BEVs bought new
today.
First Owners
Figure 17 shows the TCO cost component break out – depreciation, VAT, fuel/electricity, insurance &
maintenance – for the first owners of different powertrains for a medium car bought new in 2025. For
first owners, depreciation is the largest single TCO component, with variation by powertrain largely a
result of differences in purchase price. However, by 2025, as the purchase prices of BEVs become
much more comparable to ICEVs, fuel/electricity costs become the deciding factor in which powertrain
is cheapest on a TCO basis for consumers.
Figure 17: first owner TCOs for different powertrains for a medium car bought new in 2025
The 2025 first owner TCO for PHEVs varies by around €4,000 depending on charging behaviour and,
even under a high charging scenario, PHEVs will cost over €1,000 more than a fully electric car. A BEV
bought new in 2025 will be €2,600 and €2,500 cheaper over the first ownership than a Petrol and Diesel
ICE respectively. The component differences are shown for a BEV vs. Petrol ICE in Figure 18.
Depreciation is slightly lower for Petrol ICEs, however, this is outweighed by fuels cost being
significantly higher than electricity.
12Electric Cars: Calculating the TCO for Consumers
Final Report
Figure 18: first owner TCO cost components compared for a medium car between Petrol ICEs
and BEVs bought new in 2025
Second Owners
As shown in Figure 19, for a second-hand medium car, that was originally bought new in 2025 (and
therefore the second owner bought in 2029), depreciation makes up a much smaller proportion of the
overall TCO for second owners, with variation between vehicle powertrains driven largely by differences
in fuel/electricity costs. A medium BEV, originally bought new in 2025, will provide a €4,100 saving for
its second owners over a Petrol ICE, which has fuel costs making up 30% of the overall TCO.
Figure 19: second owner TCOs compared for different powertrains for a medium car bought new
in 2025
The relative difference between a medium BEV vs. Petrol ICE bought new in 2025 and sold in the
second-hand market in 2029, is shown in Figure 20. As the impact of depreciation becomes significantly
less, the electricity vs. fuel savings available for BEVs drive additional savings worth €5,000 for
consumers. For third owners, the running costs continue to become increasingly important, and drive
additional value for consumers (see Appendix 6.3.4).
13Electric Cars: Calculating the TCO for Consumers
Final Report
Figure 20: second owner TCO cost components compared for a medium car between Petrol ICEs
and BEVs bought new in 2025
3.2 Country Specific Overview
In this sub-section, the variations from the baseline EU TCO results are compared for nine European
focus markets: Belgium, Cyprus, France, Germany, Italy, Lithuania, Slovenia, Spain and Portugal. The
drivers of country-by-country relative TCO differences and the consequences for BEV growth in each
market are discussed.
There is significant variation between the different European markets in scope for the year that BEVs
become cheaper than Petrol ICEs for first and second owners. However, BEVs are already the cheapest
option in all focus countries for their eventual third owners if bought new in 2020. Differences in the year
each country reaches parity, which is averaged over all car sizes, is shown in Figure 21 for each
ownership. Countries are compared to the EU baseline which excludes tax breaks & subsidies.
14Electric Cars: Calculating the TCO for Consumers
Final Report
Figure 21: year that BEVs become cheaper than Petrol ICEs, averaged over all car sizes. Note
the year indicated when the vehicle is bought new
In France & Germany, which have the highest BEV subsidies available to consumers, BEVs are already
cheaper than Petrol ICE for first owners on a TCO basis. BEVs in Spain reach first owner parity to Petrol
ICEs three years earlier than EU average, which is driven by a significantly longer 11 year first
ownership period that increases the running cost savings. Belgium, which has no purchase subsides,
is in line with the EU baseline, as is Italy, where there is a lower average annual mileage of 12,000km.
BEVs in Slovenia, Cyprus & Lithuania are shown to become cheaper on a TCO basis several years
later, due to the more limited government financial support and prevalence of cheaper Petrol ICEs.
Figure 22 shows a case study of what drives differences between the EU baseline and France for the
relative TCO of a medium Petrol ICE & BEV for first owners. Medium BEVs, based on EU averages
and excluding taxes & subsidies, are on average around €1,100 more expensive than Petrol ICEs for
first owners bought new in 2020. The impact of marginally more expensive BEVs is outweighed by
Petrol ICEs in France being ca. 5% more expensive. Running cost savings are increased in France due
to longer mileages, cheaper electricity & higher petrol prices. Without grants or tax breaks, BEVs in
France already save €440 for first owners, increasing to over €7,100 with government support.
15You can also read