Measurement of economic impact of - the Australian thoroughbred breeding industry
←
→
Page content transcription
If your browser does not render page correctly, please read the page content below
Measurement
of economic
impact of
the Australian
thoroughbred
breeding industry

by Glenn Hardy and
Paul Limoli, IER Unit Trust

December 2019
002

AgriFutures Australia contact details

Building 007, Tooma Way
Charles Sturt University
Locked Bag 588
Wagga Wagga NSW 2650

02 6923 6900
info@agrifutures.com.au
www.agrifutures.com.au

Researcher Contact Details

Glenn Hardy
03 9371 3000
glenn@ier.com.au

27A Stubbs Street,
Kensington VIC 3031

In submitting this report, the researcher has
agreed to AgriFutures Australia publishing this
material in its edited form.

Published by AgriFutures Australia
in December 2019

AgriFutures Australia is the trading name for Rural
Industries Research & Development Corporation
(RIRDC), a statutory authority of the Federal
Government established by the Primary Industries
Research and Development Act 1989.

© 2019 AgriFutures Australia
All rights reserved.

ISBN 978-1-76053-011-2
                                                                      Measurement of
                                                                      economic impact
ISSN 1440-6845

Measurement of economic impact of the
Australian thoroughbred breeding industry
Publication No. 18/046
Project No. PRJ-011162

                                                                      of the Australian
The information contained in this publication is intended for
general use to assist public knowledge and discussion and to help
improve the development of sustainable regions. You must not rely
on any information contained in this publication without taking
                                                                      thoroughbred
                                                                      breeding industry
specialist advice relevant to your particular circumstances.

While reasonable care has been taken in preparing this publication
to ensure that information is true and correct, the Commonwealth
of Australia gives no assurance as to the accuracy of any
information in this publication.

The Commonwealth of Australia, AgriFutures Australia, the
authors or contributors expressly disclaim, to the maximum extent
permitted by law, all responsibility and liability to any person,
arising directly or indirectly from any act or omission, or for any
consequences of any such act or omission, made in reliance
on the contents of this publication, whether or not caused by
any negligence on the part of the Commonwealth of Australia,
AgriFutures Australia, the authors or contributors.

The Commonwealth of Australia does not necessarily endorse the
views in this publication.

This publication is copyright. Apart from any use as permitted
under the Copyright Act 1968, all other rights are reserved.
However, wide dissemination is encouraged. Requests and
inquiries concerning reproduction and rights should be addressed
to AgriFutures Australia Communications Team on 02 6923 6900.
004                                                                                                                           005

Foreword                                                                                                                      About the author

Australia has the second largest thoroughbred breeding                                                                        IER is a leading strategic consulting business
industry in the world with 660 stud farms across the                                                                          specialising in the tourism, events and
country, predominantly in NSW, VIC and QLD. These                                                                             entertainment industries. For more than 20 years,
stud farms supply thoroughbred horses to both the                                                                             IER has provided economic impact evaluations for
domestic and overseas markets.                                                                                                both private and government clients.

The thoroughbred breeding industry is worth more than         Overall, 1681 horses were exported out of Australia, from       In particular, IER has specialised in consulting on a     The economic modelling for this study was undertaken
$1.16 billion per annum to the Australian economy, and        mares with foals, yearlings and racehorses through to           variety of projects related to the thoroughbred racing    by Associate Professor Barry Burgan B Ec (Hons), FINSIA
employs close to 8000 people, particularly in rural and       mature breeding stock. It is estimated 34% of thoroughbred      and breeding industries in Australia and New Zealand      (Fellow). Associate Professor Burgan is a director of Economic
regional areas. The Australian thoroughbred breeding          horses are exported for racing purposes (as yearlings, two-     during this time.                                         Research Consultants Pty Ltd and has extensive experience
industry is made up of a majority of breeders – 76%           year-olds and three-year-olds), with the largest export                                                                   in the area of economic and financial assessment and policy
– that have just one or two mares, and more than half         contribution generated by Hong Kong buyers. Approximately       This study constitutes an economic impact evaluation of   advice. He has a background in the public and private sectors,
of all mares are owned by breeders with five or fewer         79% of exports for the purposes of breeding are shipped to      the thoroughbred breeding industry in Australia. It has   academia, and has worked on various projects in the area of
horses. About 18,000 people are actively involved in          New Zealand with the majority being broodmares. The             been developed utilising the following source data:       economic policy, including in the area of economic modelling.
the thoroughbred breeding industry as a participant,          second largest and emerging market for bloodstock is China
employee or hands-off investor.                               (6.8%).                                                         •   Current year registration data relating to            In particular, Associate Professor Burgan has extensive
                                                                                                                                  participants and animals                              experience in the use of both computable general equilibrium
This research supports sound industry planning                The AgriFutures™ Thoroughbred Horses Program is funded                                                                    and input-output models, regional economic development
by understanding the economic benefit of the                  by statutory levies paid by industry participants and           •   Breeding expenditure data captured during             and cost/benefit analysis. He has undertaken a number of
thoroughbred breeding sector and developing a sound           industry contributions from Thoroughbred Breeders                   in-depth interviews with breeding participants        these studies and projects with the Sustainable Tourism
research methodology for industry assessment. It              Australia and Racing Australia. Levy and industry               •   Export data gathered through a variety of sources     Cooperative Research Centre.
delivers market research to quantify the size and scope       contributions are matched dollar for dollar by the Australian       including breeding peak bodies, sales agents and
of the thoroughbred breeding industry and its direct          Government (up to 0.5% of the industry GVP). In 2016-17, an                                                               Associate Professor Burgan has undertaken a
                                                                                                                                  transport companies
financial contribution to the Australian economy. More        estimated 19,174 broodmares were covered by 563 stallions                                                                 significant range of studies on special events, with some
than 65% of this impact occurs in NSW and specifically        producing 13,062 live foals.                                    •   Data provided by a sample of breeders                 specific examples:
in the Hunter Valley region with more than $500 million                                                                           via a direct survey tool.
of economic contribution.                                     This report is an addition to AgriFutures Australia’s diverse                                                             •   Size and Scope of the South Australian Racing
                                                              range of more than 2000 research publications and it forms      An understanding of the intricate and sometimes               Industry (2012)
The thoroughbred breeding sector provides the racing          part of our AgriFutures™ Thoroughbred Horses Program,           complex flow of money in the racing and breeding
                                                                                                                                                                                        •   Economic and Social Impact Study of Harness
animals who compete in more than 2600 race meetings           which aims to enhance the profitability and sustainability of   industry underpins the assessment of the breeding
                                                                                                                                                                                            Racing in Australia (2012)
throughout Australia each year. Overall, exports for racing   our levied industries.                                          sector. IER has recently prepared similar studies for:
purposes generate more than $121 million in export                                                                                                                                      •   Analysis of Economic Impact (CGE modelling
earnings. In 2016-17 predominant export destinations for      Most of AgriFutures Australia’s publications are available      •   Australian thoroughbred racing industry                   exercise) of 2006 Commonwealth Games on the
Australian bloodstock included New Zealand (45%),             for viewing, free downloading or purchasing online at           •   New Zealand racing industry (three codes)                 Victorian Economy (with KPMG, 2005)
Singapore (11.5%), Hong Kong (11.1%), China (10.9%).          www. agrifutures.com.au.
                                                                                                                              •   WA racing industry (three codes)                      •   Pre-event Evaluation of Impacts of the Sydney
                                                                                                                                                                                            Olympic Games on NSW (with KPMG)
                                                                                                                              •   NSW racing industry (three codes)
                                                                                                                                                                                        •   Size and Scope Study of the Victorian Racing
                                                                                                                              •   QLD racing industry (three codes)                         Industry (2017)
                                                                                                                              •   NT thoroughbred racing industry                       •   Annual Assessment of the Adelaide Fringe,
                                                                                                                              •   TAS racing industry (three codes)                         WomAdelaide and Clipsal 500 (over the last five to
                                                                                                                                                                                            10 years)
John Harvey                                                                                                                   •   SA racing industry (three codes).
Managing Director                                                                                                                                                                       •   Size and Scope Study of Racing Industry in NSW
AgriFutures Australia
                                                                                                                                                                                        •   Size and Scope of the New Zealand Racing
                                                                                                                                                                                            Industry (2014).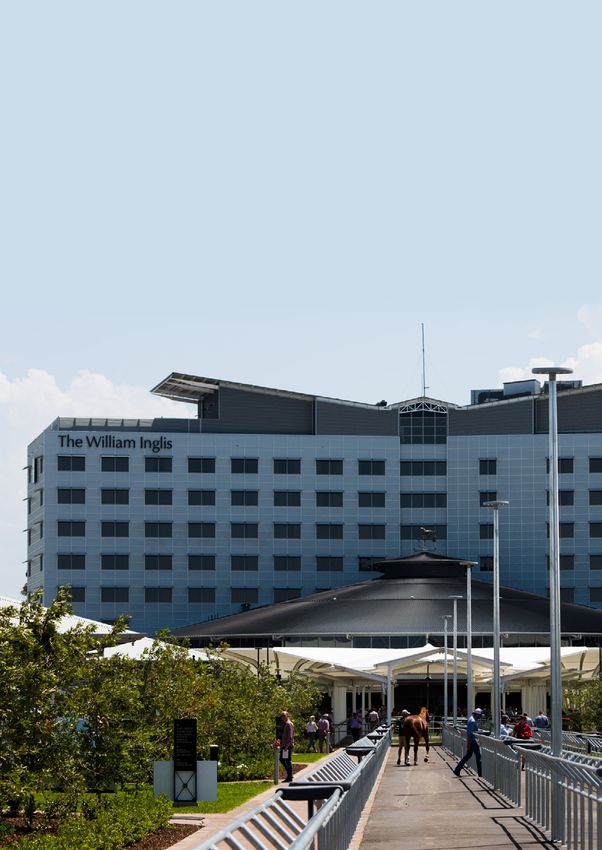
006                                                                                                                                      007

Acknowledgments

IER acknowledges the contribution of the following
organisations and individuals:

•   Racing Australia                                               •    Magic Millions
•   Australian Stud Book                                           •    Bloodstock agents
•   Thoroughbred Breeders Australia                                •    Breeders who agreed to provide financial and participation
                                                                        data
•   International Racehorse Transport
                                                                   •    Associate Professor Barry Burgan B Ec. (Hons), FINSIA
•   William Inglis & Son Limited
                                                                        (Fellow).

Definitions
Direct Expenditure: Expenditure generated across the breeding
sector, specifically in the following areas:
                                                                   Full time equivalent employment (FTE): A unit that indicates
                                                                   the workload of an employed person in a way that makes                This study aims to quantify the
                                                                                                                                         economic, employment and
                                                                   workloads or class loads comparable across various contexts.
• Maintenance of breeding animals
                                                                   An FTE of 1.0 is equivalent to a full time worker (i.e. 38 hours),
• Production of foals

                                                                                                                                         social contribution that the
                                                                   while an FTE of 0.5 signals half of a full workload (i.e. 19 hours)
• Profits on yearling sales
                                                                   Household income: Wages and salaries (before tax) earned
• Net contribution from exports

                                                                                                                                         thoroughbred breeding industry
                                                                   from employment generated by the thoroughbred breeding
• Stallion fees                                                    industry

                                                                                                                                         generates in each State and
• Expenditure generated at other industry events.
                                                                   Participants in breeding: The number of employees (full time,
                                                                   part time and casual), participants and volunteers directly
Direct value added: The amount of income included in the
                                                                   involved in the breeding industry. Does not include down-the-

                                                                                                                                         Territory of Australia.
direct in-scope expenditure, and therefore is the amount
                                                                   line suppliers of goods and services
of wages and salaries plus gross operating surplus directly
created in supplying these services and products, which is also
                                                                   Input-output modelling: Economic modelling used to
equal to the direct in- scope expenditure less the purchases
                                                                   determine the economic outputs within this study. It is an
the provider of the goods and services makes in providing the
                                                                   economy wide model, which shows the inter-linkages between
goods and services
                                                                   industry sectors in the economy. Therefore, the change in
                                                                   economic circumstances (specifically a change in final
Indirect (induced) value added: The value added activity
                                                                   demand), for one sector of the economy can be traced through
generated to support the purchases made in providing the
                                                                   to its effect on other sectors.
inputs to the providers of the direct services, along with the
value added impact in providing households with goods and
services as they spend their wages, and the trickle on effect of
this spending

Total value added: The sum of the direct value added plus the
indirect (induced) impact– which represents the total wage and
salary income plus gross operating surplus generated directly
in providing the goods and services involved in the direct in-
scope expenditure and the wages and salaries generated as
an extension. It therefore represents the contribution to gross
state product resulting from the events and activities of the
breeding industry in Australia
008 009
Contents Tables
Foreword 004 Table 1 Source of financial expenditure in the thoroughbred breeding industry 2016-17 019
About the author 005
Table 2 Direct value added impacts of thoroughbred breeding according to industry sector 021
Acknowledgments 006
006 Table 3 Income generated from thoroughbred breeding by state & territory 2016-17 023
Definitions
Executive summary 010 Table 4 Distribution of employment in the Australian thoroughbred breeding 025
014 industry by state and territory
Introduction and objectives
Table 5 Number of people engaged in the thoroughbred breeding industry 026
Methodology Economic methodology 016
Table 6 Foal production in Australia in 2016-17 029
Geography 018
Table 7 Export destinations of Australian thoroughbred bloodstock (2016-17) 036
Economic impacts Direct spending generated by the breeding sector 019 Table 8 Export destinations for thoroughbred breeding and racing stock (2016-17) 037
Economic contribution of the Australian 020
Table 9 Impacts of the Magic Millions Raceday to QLD 051
thoroughbred breeding industry
State and national impacts 021
024
Full time equivalent employment Figures
The thoroughbred breeding
industry Participants in the breeding industry 026 Economic impact of the thoroughbred breeding industry in Australia 2016-17
Figure 1 022
Breeding animals 027
Foal production in Australia in 2016-17
Figure 2 028
Profile of industry participants Demographic and life cycle profile 030 Gender profile of participants in the Australian thoroughbred breeding industry
Figure 3 030
Age of participants in the Australian thoroughbred breeding industry
Figure 4 030
Drivers to participation Changes in participation 033
Type of industry involvement in the Australian thoroughbred breeding industry
Figure 5 031
Associated breeding events 035
Age of initial involvement in the Australian thoroughbred breeding industry
Figure 6 031
Exports Exports of Australian 036 Figure 7 Reason for first involvement in thoroughbred breeding 032
Perception of involvement in thoroughbred breeding
Figure 8 032
Results Economic Contribution 039
Motivations for participation in the thoroughbred breeding industry
Figure 9 033
Disclaimer 040 Level of involvement in the thoroughbred breeding industry 2018 vs 2015
Figure 10 034
Expected level of involvement in the thoroughbred breeding industry over the next three years
Figure 11 034
At a glance New South Wales 042
Victoria 044 Figure 12 Expected level of future involvement in thoroughbred breeding over the period 2018- 21 035
Queensland 046 Top six destination markets for thoroughbred bloodstock 2016-17
Figure 13 038
Western Australia 048
The William Inglis Hotel, Warwick Farm Sydney NSW
Figure 14 053
South Australia 049
Tasmania 050 Scone Racing Carnival
Figure 15 052
Thoroughbred industry trainees participating in tuition
Figure 16 053
Appendices Magic Millions Raceday 051
Industry trainees in the Hunter Valley, NSW
Figure 17 054
Riverside Stables in Sydney’s west 051
Scone Racing Carnival 053
A traineeship to build a workforce 054
010 011
Executive summary
This report provides an assessment of the size Aims/objectives Methods used
and scope of the thoroughbred breeding sector in
Australia. It demonstrates the value-added economic • To provide an independent and reliable assessment
of the size and scope of the thoroughbred breeding
• IER sourced data from desktop research,
particularly in relation to previously published
impact, job creation and export impacts of the sector in Australia including participant, asset and
customer information.
thoroughbred racing and breeding industry studies
of a similar nature.
thoroughbred breeding sector on the Australian
economy. Furthermore, it illustrates the social and
• To provide an estimation of the value added • Racing Australia provided data relating to horse and
economic impact, job creation and export impacts of participant numbers.
community impacts of the breeding industry in terms the thoroughbred breeding sector, on the Australian
economy, including analysis by state/territory • Thoroughbred Breeders Australia provided support
of volunteerism, history, education and training and (including a number of smaller key breeding regions and guidance on the collection and analysis of
participant data as it related to this area of research
the environment.
throughout Australia).
• To highlight the number of horses by category – foals, • IER undertook more than 80 in-depth interviews with
broodmares and stallions and participants. thoroughbred breeders to develop a detailed financial
The Hunter Valley, NSW is responsible for generating In addition, the Hunter Valley is responsible for generating
model of the costs associated with the breeding
the highest economic impacts and job creation in the just over $500 million in total value-added economic
• To present the economic benefits information for function at various levels of the lifecycle stage.
thoroughbred breeding sector. This is followed by Greater impact and more than 3,350 direct and indirect FTE jobs.
distribution to Australian, state and local government
Sydney and Central Coast, NSW, Greater Melbourne, Overall, close to 6,250 mares were covered in the region
authorities, the broader equine sector and racing • More than 1,000 people with an involvement in
Victoria, South East Queensland and Brisbane, and producing 4,257 live foals.
industry, the media and other stakeholders, including breeding (both hands-on and hands-off) were surveyed
Goulburn and North East Victoria.
sponsors, commercial partners and community to inform the profiling of participants in the industry.
organisations.
• IRT, William Inglis & Son, Magic Millions and a range
• To understand the export implication of international thoroughbred horse trainers and
of the thoroughbred breeding sector and highlight bloodstock agents were interviewed to inform the
the global importance of the industry and Australia’s export analysis.
standing in the international racing community.
• To profile people within the breeding
sector (in particular studs and breeding farms)
to understand the demographic make-up
(i.e. gender, age, country of birth, lifecycle stage) as
well as their roles in the breeding industry.
• To assess the social and community impacts of
the breeding industry in terms of volunteerism,
community building, family, history, education and
training and the environment.
012                                                                                                                       013

Executive summary (continued)

Results/key findings                                          •   In 2016-17, it is estimated that 19,174 broodmares
                                                                  were covered, producing 13,062 live foals (at a
                                                                  success rate of 68.1%).
•   The thoroughbred breeding industry in Australia is
                                                              •   The research of breeding establishments found that
    responsible for generating more than $934 million in
                                                                  more than 78% of those people involved in breeding
    expenditure in Australia.
                                                                  are over the age of 50.
•   Overall, the thoroughbred breeding industry in
                                                              •   Overall, 1,681 horses were exported out of Australia,
    Australia generates more than $1.16 billion in value
                                                                  from mares with foals, yearlings and racehorses
    added impacts to the national economy. More than
                                                                  through to mature breeding stock.
    65% of this impact occurred in NSW.

                                                              •   It is estimated that 573 of the 1,681 (or 34%)
•   The economic activity created by the thoroughbred
                                                                  thoroughbred horses exported in 2016-17 were for
    breeding sector nationally is responsible for
                                                                  the purposes of breeding.
    sustaining nearly 8,000 FTE jobs. The direct impact
    on employment, generated specifically by the
                                                              •   It is estimated that the thoroughbred breeding
    activities of the breeding industry, sustains 3,289 FTE
                                                                  industry in Australia is responsible for generating
    jobs each year.
                                                                  $121.2 million in exports of bloodstock for the
                                                                  purposes of racing.
•   In total, there are nearly 18,000 individuals who
    participate in the breeding industry as a participant,
    employee or volunteer.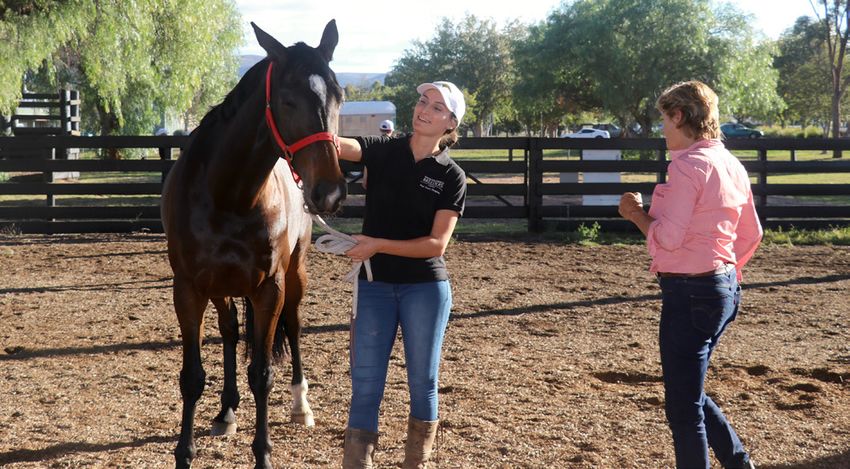
014                                                                                                           015

Introduction                                                                                                  Objectives

AgriFutures Australia                                                                                         This study aims to quantify the
commissioned IER to undertake                                                                                 economic, employment and social
this study into the size and                                                                                  contribution that the thoroughbred
scope of the thoroughbred                                                                                     breeding industry generates in
breeding industry in Australia.                                                                               each state and territory of Australia.
In part, this study provides an                                                                               The key focus of the study is to meet
update on the 2001 study.                                                                                     the following objectives:

Economic methodology

•   A measure of the whole of the horse industry
    impact including all sectors and breeds (racing
                                                      IER has undertaken a number of similar studies for
                                                      thoroughbred racing jurisdictions in Australia and      01    To provide an independent and reliable
                                                                                                                    assessment of the size and scope of the             05   To understand the export implication
                                                                                                                                                                             of the thoroughbred breeding sector and
    and otherwise).                                   New Zealand and has, in that time, developed a robust         thoroughbred breeding sector in Australia                highlight the global importance of the industry
                                                      methodology of collecting source data to underpin             including participant, asset and customer                and Australia’s standing in the international
•   Undertaken more than 15 years ago – and           these types of assessments. This study is based on            information.                                             racing community.
    improvements in data management and industry      assessment of the thoroughbred breeding industry
    modelling have occurred over that time.           during the 2016-17 season.
                                                                                                              02    To provide an estimation of the value added
                                                                                                                    economic impact, job creation and export impacts    06   To profile people within the breeding
                                                                                                                                                                             sector (in particular studs and breeding farms)
                                                                                                                    of the thoroughbred breeding sector, on the              to understand the demographic make-up
                                                                                                                    Australian economy, including analysis by state/         (i.e. gender, age, country of birth, lifecycle stage) as
                                                                                                                    territory (including a number of smaller key             well as their roles in the breeding industry.
                                                                                                                    breeding regions throughout Australia).

                                                                                                                                                                        07   To assess the social and community impacts of

                                                                                                              03
                                                                                                                    To highlight the number of horses by category –          the breeding industry in terms of volunteerism,
                                                                                                                    foals, broodmares and stallions and participants.        community building, family, history, education and
                                                                                                                                                                             training and the environment.

                                                                                                              04    To present the economic benefits information
                                                                                                                    for distribution to Australian, state and local
                                                                                                                    government authorities, the broader equine
                                                                                                                    sector and racing industry, the media and other
                                                                                                                    stakeholders, including sponsors, commercial
                                                                                                                    partners and community organisations.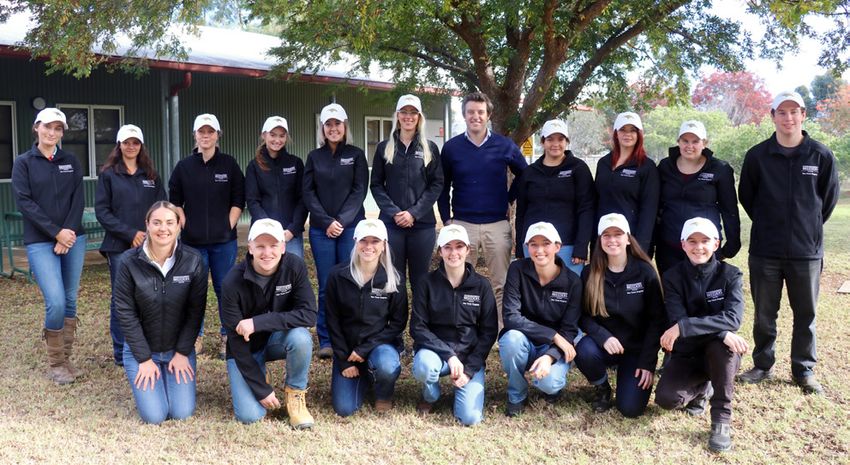
016 017
Methodology
In assessing the size and scope of the thoroughbred The assessment of animal related expenditure is based on
developing an understanding of the costs at various stages of
Overall, IER conducted 73 interviews of thoroughbred breeders
across 29 local government areas (LGA). In terms of commercial
breeding industry, this study reports on a number of the the breeding life cycle. This is undertaken within the following breeders 33% were large scale breeders, 38% were of medium
framework: size and 29% were smaller scale breeding operations.
traditional measures adopted by the breeding industry
(such as foal crops, breeders and exports) as well as • Development of separate cost profiles related to the
average cost of producing a yearling within four key State Number of Interviews
calculating a number of economic measures aimed at categories:
NSW 19
illustrating the industry’s contribution to the economy. 1. Commercial Stud Farm – prepared for yearling
sales VIC 18
2. Commercial Stud Farm – not prepared for yearling SA 12
sales
For the purpose of this study, the breeding industry is limited Throughout the report, data has been presented at a state/ QLD 11
to activities related to thoroughbred breeding and does not territory and national level. In some states, further geographic 3. Private Farm – prepared for yearling sales
include any other non-racing horse populations. segmentation was undertaken to specifically profile key 4. Private Farm – not prepared for yearling sales WA 8
breeding areas in their own right. These geographic segments
From an economic impact perspective, the aim is to measure have been developed specifically for the purpose of this study TAS 5
the expenditure that is generated as a result of breeding but are underpinned by the Australian Bureau of Statistics • Determining the relative proportion of yearlings which are Total 73
activity and the way that it impacts on the various economies (ABS) SA4 level of the Australian Statistical Geography produced by a commercial stud farm or a private farm in
in which they operate. The data that underpins this study Standard (ASGS) framework. each state/territory.
has been gathered from a number of sources and these are Of the seventy-three interviews, 45 were conducted with
outlined below: • Determining the proportion of yearlings which are sold commercial breeders and 28 with private breeding operations.
through a yearling sale by commercial stud farm and Commercial breeders constitute those operations whose primary
• IER sourced data from desk research, particularly in Economic methodology private farm in each state/territory. income is sourced from thoroughbred breeding activities e.g.
relation to previously published thoroughbred racing and thoroughbred studs (with or without stallions), broodmare
breeding industry studies of a similar nature. • Assess breeding data pertaining to the number of farms etc. Private breeders primarily breed for themselves
broodmares, fertility rates and live foals by postcode (including family or friends) on their own property – sometimes in
• Racing Australia provided data relating to horse and The development of an economic model for the which will allow extrapolation of the expenditures to conjunction with other farming activities.
participant numbers. thoroughbred breeding industry requires a strong determine a cost of production in each geographic region.
understanding of the internal and external flow of finance. Using the actual number of empty mares, mares in foal
• Thoroughbred Breeders Australia provided support and In this regard, the key is to identify final expenditures - and foals (provided by Racing Australia) and applying the Overall, IER conducted 73 interviews of
guidance on the collection and analysis of participant ensuring not to count the same expenditures as they flow average cost of production by different region and type of thoroughbred breeders across 29 LGA
data as it related to this study. between internal industry transactions. operations, this is scaled up to an industry level to estimate areas. In terms of commercial breeders
overall expenditures. 33% were large scale breeders, 38%
• IER undertook more than 70 in-depth interviews with In developing the economic model, the expenditure
breeders to develop a detailed financial model of the profile of the breeding sector was assessed based on the • Determination of the gross stallion fees (aligned with
were of medium size and 29% were
costs associated with the breeding function at various following key inputs: postcode) obtained throughout the breeding season by smaller scale breeding operations.
levels of the life cycle stage. matching every mare with the corresponding stallion.
• Animal related expenditure – the expenditure made
• More than 1,000 people with an involvement in breeding by breeders in the care and breeding activities The modelling for this study uses an input-output framework
• Analysis of sales and export data is also used to determine
(both hands-on and hands- off) were surveyed to inform undertaken. to add to the underlying information that is collected on stud,
the margins where yearlings yield more than the cost of
the profiling of participants in the industry. participant and thoroughbred sales purchasers. This process is
production plus the stallion fee (thus representing the
• Business related expenditure – the expenditure important as it translates these direct impacts into the impact
profit yield on yearling sales).
• IRT, Inglis, Magic Millions and a range of international made by breeding establishments on operating their by industry and on employment. The economic modelling
thoroughbred horse trainers and bloodstock agents were businesses. • It is important to note that cost profile of breeders may methodology is broadly consistent with other studies undertaken
interviewed to inform the export analysis. change year-to-year due to some thoroughbred breeding by IER for both state and national governments. The input-output
• Event related expenditure – the expenditure made areas being impacted by climatic and industry economic tables are based on underlying 2015/16 data and inflated to 2017.
by breeders (on preparing their yearling for sale) and conditions (i.e. drought, floods).
attending the sales events.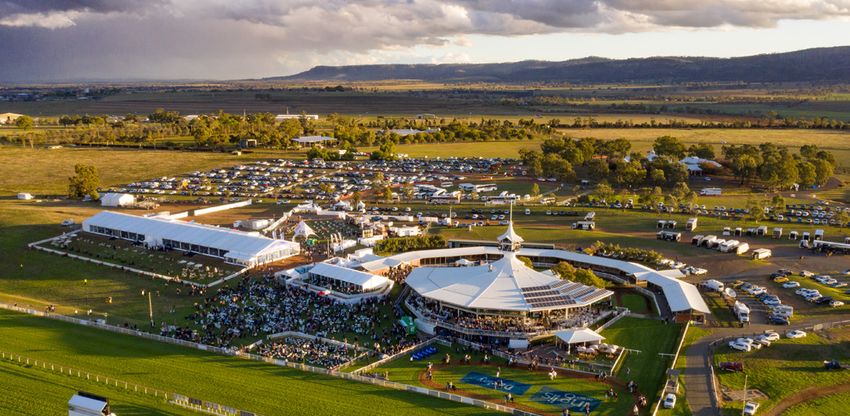
018 019
0019
Methodology (continued) Economic impacts
This includes items for consideration according to the level The modelling included an economic impact assessment
of closure assumed (e.g. production induced impact versus rather than the simple multiplier application and as such Direct spending generated by the breeding sector
consumption induced impact) and other model adaptions produced outputs by industry. The modelling also identified the
(unemployment and demography-based models). The modelling initial impact, the production induced, and the consumption
In 2016-17, the thoroughbred breeding industry in Australia The expenditure model takes into consideration the following
involves populating the value assumptions and providing induced impacts ensuring that not only full compliance with
generated more than $934 million in direct expenditure. inputs in Table 1:
indicative estimates of value by stakeholder. Treasury recommendations is achieved, but outputs can be
The calculation of direct expenditure is based on the final
benchmarked with other studies.
Thoroughbred breeder expenditure is allocated to the following expenditures of the breeding industry, or put another way, the
sectors - derived by a survey undertaken by IER in 2016. It The economic model captures expenditure by breeders’ customers point at which the expenditure leaves the internal breeding
should be noted that there is no uniformity across breeders and assumes that all revenues (received by breeders) are spent (i.e. industry and hits the broader economy.
that allows for the capture of exact expenditure profiles. not saved) and that capital expenditures are matched to profits. In
addition to this, it is assumed that all purchases are in the region
being evaluated. The input-output model is closed for households, Table 1 Source of financial expenditure in the thoroughbred breeding industry 2016-17
and so includes production and consumption induced impacts. The
Horse feed 28%
Gross Operating Surplus and Imports in the standard production
Proportion
Veterinary services 21% function are therefore considered a leakage. IER will include a Source of final Value of final
description of this in the report. expenditure Description ($ million) expenditure (%)
Repairs and maintenance 15%
Production of The expenditure incurred by owners on the maintenance 490.6 52.5
Breeding equipment 10% The modelling included an economic racing horses of broodmares and stallions, and the production of foals.
Transport 9%
impact assessment rather than the
simple multiplier application and as Expenditure impacts generally benefit the location at
Utilities/rates 8% such produced outputs by industry. which the broodmare is kept and foaled down.
Wages 6%
Stallion fees Payments made to owners of stallions for the rights to 239.7 25.7
Construction 4% Single region input-output tables were constructed for each breed with that stallion.
of the regions. The model was constructed at a 25-industry
100% sector level - between Australian and New Zealand Standard Expenditure impacts generally benefit the location at
which the stallion is kept (reduced by 15% to account for
Industrial Classification (ANZSIC) 1 and 2, with more detail
discounts on stallion fees).
around the industries most directly linked to the breeding
sector. The state tables were constructed using an adjusted
location quotient approach based on the 2015-16 national Profits on yearling The sales amount minus the cost of production and 157.0 16.8
input-output table (as prepared by the ABS) and labour force sales commissions paid to sales agents.
survey employment numbers by industry for 2015-16 using
superior national accounts data on GSP components. Sub state Profits generally benefit the geographic origin of the vendor.
tables are prepared using a simple location quotient approach
based on ABS census data for 2016.
Profit on exports The export revenue generated from the sale of Australian 34.1 3.6
bred/domiciled horses to overseas buyers.
Expenditure impacts generally benefit the origin from
Geography which the horse is sold.
Expenditure at The expenditure by attendees at various open days and 13.2 1.4
other events events held by the industry.
The outputs outlined in this study have been reported on a na-
tional and state/territory description. Additionally, some smaller Expenditure impacts generally benefit the location at
geographies have also been reported where they were deemed which the open day/event was held.
to be relevant breeding areas. The geographic framework is
based on the Australian Bureau of Statistics SA4 framework
with some regions aggregated for the purpose of this study. Total 934.6 100.0020 021
Economic impacts (continued)
The development of an expenditure model of the breeding Generally, the level of economic activity will not always When the direct value added impacts are assessed by industry
industry is challenging given the long-term nature of some proportionally follow the final expenditures, as regional areas sector, the industry sectors which benefit most significantly
transactions. For instance, the maintenance of breeding generally have higher import penetrations than metropolitan from thoroughbred breeding activity are listed in Table 2:
animals and the production of foals can be measured within areas, i.e. the major expenditure is on product imported
a given year, however elements such as profits on exports from the metropolitan area. As such, the model takes into
can occur at various stages of the horses’ life cycle. This study consideration these leakages between regions.
Table 2 Direct value added impacts of thoroughbred breeding according to industry sector
attempts to build a profile of the economic impacts that the
industry generated in the 2016-17 breeding season, however When considering the value added contribution generated by
some inputs (such as profits on yearling sales) rely on using the thoroughbred breeding sector, it is important to note that it Direct value added Proportion of breeding
known transaction data (the sale) from the current period and is made up of: Industry impact ($ million) industry impact (%) Sources of impact
inferring a maintenance cost (at today’s dollars) in order to
develop an understanding of the profit generated. • Direct value added ($435.2 million) – this represents Agriculture, forestry 110.9 25.5 Feed production
the amount of income included in the direct in-scope and fishing Breeding land
expenditure. It is the amount of gross wages and salaries in
Animal care and maintenance
the breeding industry and the direct provision of services to
breeding activity, plus the gross operating surplus (profits,
The thoroughbred breeding industry interest payment and direct taxes) directly created in Professional and 90.7 20.8 Veterinary services
in Australia is responsible for suppling these services and products. This is also equal to scientific services Specialist breeding services
generating more than $934 million the direct in-scope expenditure less the purchases that the Laboratory services
in expenditure in Australia. provider of the goods and services makes in providing the
goods and services, both supplied from within the region,
as well as externally (i.e. imported). Property services 65.1 15.0 Agistment and rent
Machinery hire and equipment
• Indirect (induced) value added ($729.6 million) – this Marketing and business
Economic contribution of the represents the value added activity (wages, salaries services
and gross operating surplus) generated to support the
Australian thoroughbred purchases made in providing the inputs to the providers
breeding industry of the direct services, along with the value added impact
Road transport 39.0 9.0 Freight transport
in providing households with goods and services as they Floating
spend their wages, and the trickle on effect of this.
The direct value added impacts are calculated using
The thoroughbred breeding industry in Australia is responsible the ratios within each of the relevant ANZSIC Industry
classification sectors identified within the input-output
for generating a real gross value added contribution of $1.16
table. The calculation of the indirect (induced) effects, which
State and national impacts
billion across the national economy. Real gross value added is
the generally accepted measure of the value of production from are allocated to the industry in which the impact occurs, is
economic activity. It is the sum of value added by all industries undertaken by running an impact assessment, and tracing the
in a region (in this case the nation). In any period of time, the whole of economy effect of the expenditure patterns linked to
value added contribution in an industry equates to the value of the thoroughbred breeding industry.
When all of the state/territory impacts are added together, the
sales less the value of inputs used in production. This means
value added contribution generated by the breeding sector is
value added is equal to the income (wages, salaries and profits)
$1.01 billion. This represents the extent to which each state/
generated in the course of production.
When the state/territory impacts territory generates contributions to their state’s economy
are combined, the value added (Figure 1). However, there is also an additional contribution
The real gross value added calculation uses constant prices
that the industry generates nationally, when allowing for
(prices in a selected year), hence it does not allow for general contribution generated by the feedback between states (or cross border transactions).
price level changes (inflation). Also, the calculation makes no breeding sector is $1.01b. The total When this is added, the impact rises to $1.16 billion which
allowance for capital used in production (depreciation).
impact, accounting for an additional represents the overall contribution of the industry to the
cross border contribution, is $1.16b. national economy (Table 3).022 023
Economic impacts (continued)
Table 3 Income generated from Thoroughbred breeding by state and territory 2016-17
Direct value Indirect value Total value
Region added ($ million) added ($ million) added ($ million) Proportion (%)
ACT 0.1 0.0 0.1 0.0
NSW 276.1 378.7 654.8 65.0
Hunter Valley 247.5 256.4 503.9
Greater Sydney and 8.7 104.4 113.1
Central Coast
NT
Southern Highlands 7.4 7.5 15.0
and South Coast
North Coast and New 4.6 4.0 8.7
England
QLD
Value Added Riverina and Murray 4.0 3.3 7.3
WA
Value Added $93.4m
Central and Far West 3.8 3.0 6.8
$39.4m
SA VIC 78.3 115.0 193.3 19.2
Value Added
NSW
$19.8m Value Added
Goulburn and North 34.4 23.1 57.5
East
$654.8m
Greater Melbourne 18.7 74.7 93.4
North West and 15.9 10.7 26.6
Macedon
VIC ACT Barwon and South West 6.9 4.8 11.7
Value Added Value Added
$193.3m $0.1m LaTrobe Gippsland 2.4 1.7 4.1
QLD 44.0 49.4 93.4 9.3
South East and 41.9 47.5 89.4
Brisbane
TAS
Value Added Central Coast 1.7 1.6 3.4
$6.4m Outback and Top End 0.4 0.3 0.7
Figure 1
Economic impact of the thoroughbred WA 21.6 17.8 39.4 3.9
breeding industry in Australia 2016-17 SA 9.8 10.1 19.8 2.0
TAS 3.7 2.7 6.4 0.6
The thoroughbred breeding industry NT 0.0 0.0 0.0 0.0
in Australia is responsible or
Sum of individual 433.5 573.7 1,007.2 100.0
generating an economic impact of states
more than $1.16 billion. Total national impact 435.2 729.6 1,164.8024 025
Economic impacts (continued)
NSW generates the largest economic impact when
compared to other states and territories. This is mainly
Full time equivalent employment Table 4 Distribution of employment in the Australian thoroughbred breeding industry by state and territory
driven by the size and scale of the breeding operations
in the Hunter Valley – generating more than $0.5 billion
in total valued added economic impact alone. The VIC Region Direct jobs (FTE) Indirect jobs (FTE) Total jobs (FTE) Proportion (%)
thoroughbred breeding industry generates the second
largest economic impact (close to 20% or nearly $195 The economic activity created by the thoroughbred breeding ACT 0 0 0 0.0
million in economic contribution) followed by QLD (close sector nationally is responsible for sustaining nearly 8,000
NSW 2,013 2,373 4,386 63.7
to 10% or nearly $95 million in economic contribution). Full time equivalent (FTE) jobs (Table 4). The direct impact
Although other states have smaller scale stud operations on employment, generated specifically by the activities
and comprise a higher ratio of private ‘hands-on’ breeders, of the breeding industry, sustains 3,289 FTE jobs each Hunter Valley 1,808 1,550 3,358
the contribution to their individual state economies is year. When the indirect impacts, generated by the flow-on
Greater Sydney and 59 714 773
significant and their breeding operations are vital in of economic benefits to other industries are taken into Central Coast
providing the racing stock for their individual jurisdictions. account, the total employment impact rises to nearly 8,000
FTE positions. Southern Highlands 54 46 100
and South Coast
The breeding sector, like the broader horse racing industry, North Coast and New 34 25 59
relies on a large amount of part time and casual labour to England
meet the labour demand created. It is important to note
Riverina and Murray 29 21 50
that the FTE job creation does not necessarily directly
follow direct spending within the national economy. This is Central and Far West 28 18 46
because some regions have a higher need to import labour
VIC 625 794 1,419 20.6
(due to supply side constraints) than others.
Goulburn and North 275 139 413
The national breeding industry’s FTE positions resulted in East
more than $558.6 million in wages and salaries for the FTE
Greater Melbourne 149 552 701
employment of people employed in the breeding industry as
well as those employed in other ‘down-the-line industries’. North West and 127 64 191
‘Down-the-line industries FTE has increased as a result Macedon
of industry generated demand. Some examples of the
Barwon and South West 55 30 85
other industries that are stimulated by the breeding sector
include veterinary, feed, retail, tourism, accommodation, LaTrobe Gippsland 19 10 30
transport and business services.
QLD 309 340 650 9.4
The thoroughbred breeding industry in Australia is now South East and 295 328 623
a worldwide leader, only second in size to the USA. The Brisbane
industry is focused across the east – QLD, NSW, VIC, TAS and
Central Coast 12 10 22
the southern regions of SA and WA. The Hunter Valley, NSW
is a hub of breeding activity, its farms producing almost half Outback and Top End 3 2 4
of the thoroughbreds born in Australia each year. Horses are
WA 127 104 232 3.4
exported to most racing nations in the world, particularly
South-East Asia. SA 76 71 147 2.1
TAS 27 20 47 0.7
NT 0 0 0 0.0
Sum of individual 3,177 3,703 6,881 100.0
states
Total national impact 3,289 4,647 7,936026 027
Thoroughbred breeding industry
Overall, there are 6,772 individual breeders who are It is important to also note that not all broodmares, that
Participants in the breeding industry involved in breeding thoroughbreds nationally (Table 5).
Breeding animals are covered in a given year, are kept and foaled down in
These individuals all have full or part ownership in one or that location. This is particularly true in some of the larger
more broodmares/foals however some have a hands-on breeding regions such as the Hunter Valley, NSW and the
involvement in the breeding function whilst others are Goulburn and north east VIC where broodmares often travel
involved only as owners/funders of breeding activity to a standing stallion, are covered and then leave that
The concept of ‘participation in the breeding sector’ is broader (hands-off). The thoroughbred breeding sector provides and replenishes jurisdiction and return to where they are normally domiciled.
than simply considering those employed in the industry. the racing animals who compete in thoroughbred racing This has been taken into consideration in the development
Participants include breeders (hands-on and hands-off), In addition to these participants, there are more than throughout Australia. Additionally, Australia is a strong exporter of this model, as it means that the expenditure profile, over
employees and volunteers who are involved in varying levels 5,300 individuals who are employed directly within the of thoroughbred racehorses, yearlings and breeding stock. the duration of the pregnancy, does not always occur in the
of engagement from occasional to full time. breeding industry in a full time, part-time or casual role. location where the covering took place.
The majority of these employees work at either a stud or From a production perspective, at the top end of the breeding
It is particularly important to distinguish between the concepts of broodmare farm. sector, large stud farms employ many staff and produce large When assessing the cost of production (not including the
‘hands-on’ and ‘hands-off’ breeding involvement. The distinction numbers of foals each year. They operate as service providers stallions fees), the average expenditures vary depending on
is outlined below: Finally, there are approximately 5,860 individuals who for those with an ownership interest in a broodmare or stallion three key factors:
volunteer their time and skills in a variety of roles within and provide the facilities, experience and expertise to breed
• Hands-off – those individuals who own thoroughbreds for the breeding industry. In total, there are nearly 18,000 with these animals. At the other end of the scale, there are a • The type of breeding farm (commercial or private farm).
the purposes of breeding (or shares in thoroughbreds for individuals who participate in the breeding industry as a large number of hobby breeders also producing foals, both for
such purpose) but are not involved in the day to day care or participant, employee or volunteer. sale and for racing purposes. • If the horse if being prepared for a yearling sale.
supervision of the horses. In other words, they are investors
in the breeding sector, but not involved in the breeding Breeders derive the majority of their income from the public
• The breeding region of assessment.
activities in a hands-on manner. Typically, these participants and private sale of their stock. This particular sector of the
would own (entirely or a share in) broodmares or stallions. industry has great potential to generate economic impacts,
The range of averages applied to the different breeding
as breeders often sell their stock to interstate and overseas
scenarios as outlined above can be seen in the following table.
• Hands-on – those individuals who own thoroughbreds for buyers, at sales events. This process leads to significant
Please note – averages for each region/state fall between the
the purposes of breeding (or shares in thoroughbreds for opportunities for foreign investment to flow into Australia as
‘lower average’ and ‘higher average’ within each category.
such purpose) and are involved in the day to day care or breeders sell their yearlings, two-year-olds and three-year-olds
supervision of the horses and those individuals who are to foreign interests. The opposite is also true as owners often
employed, or volunteer their services, in the activities related invest money outside Australia in the purchase of foreign bred
to animal husbandry. racehorses. The relative strength of the breeding sector in
Australia can dictate whether the nation is generating a net Commercial stud Lower average Higher average
surplus or deficit from the sale of racing stock. Additionally, the
Table 5 Number of people engaged in the thoroughbred breeding industry ability for a jurisdiction to entice a standing stallion to remain Mare in foal $32,369 $48,024
can have a significant impact for that jurisdiction with value (yearling sale)
being derived from the broodmare population (both local and
Full /part time/ Mare in foal $22,918 $34,450
those who travel) to be served by these stallions.
Region Breeders casual employees Volunteers Total (no yearling sale)
In 2016-17, it is estimated that 19,174 broodmares were Empty mare $9,827 $16,319
NSW 2,164 2,573 1,991 6,728
covered, producing 13,062 live foals (at a success rate of
VIC 2,054 1,444 1,623 5,121 68.1%). In addition to this, it is estimated that about 15% of
broodmares are not bred within any given year. NSW (47%) and
QLD 1,263 755 1,010 3,028
VIC (24%) domiciled broodmares accounted for nearly three- Private farm Lower average Higher average
SA 377 192 528 1,097 quarters of the foal crop in that year (Table 6).
Mare in foal $24,781 $39,727
TAS 172 77 224 472
(yearling sale)
WA 629 291 484 1,404
Mare in foal $16,946 $26,052
ACT 79 0 0 79 (no yearling sale)
NT 34 0 0 34 Empty mare $7,426 $11,144
Total 6,772 5,332 5,860 17,964028 029
Thoroughbred breeding industry (continued)
Table 6 Foal production in Australia in 2016-17
Region Broodmares covered Live foals Proportion (%)
NSW 9,091 6,193 47.4
Hunter Valley 6,249 4,257
Greater Sydney and 801 546
Central Coast
NT
Broodmares Southern Highlands and 721 491
Covered - 0 South Coast
Live foals - 0
North Coast and New 530 361
England
Central and Far West 427 291
QLD
Broodmares Riverina and Murray 363 247
Covered - 2,977
Live foals - 2,028 VIC 4,664 3,177 24.3
WA
Broodmares SA Goulburn and North East 2,036 1,387
Covered - 1,402 Broodmares
Live foals - 955 Covered - 694 NSW Greater Melbourne 1,082 737
Live foals - 473 Broodmares
Covered - 9,091 North West and Macedon 778 530
Live foals - 6,193
Barwon and South West 555 378
LaTrobe Gippsland 213 145
VIC
ACT QLD 2,977 2,028 15.5
Broodmares
Covered - 4,664 Broodmares
South East and Brisbane 2,766 1,884
Live foals - 3,177 Covered - 4
Live foals - 3
Central Coast 173 118
Outback and Top End 38 26
TAS WA 1,402 955 7.3
Broodmares
Figure 2 SA 694 473 3.6
Covered - 342
Foal production in Australia in 2016-17 Live foals - 233 TAS 342 233 1.8
ACT 4 3 0.0
There are more than 13,000
NT 0 0 0
live foals produced in Australia.
NSW (47%) and VIC (24%) are Total 19,174 13,062 100.0
responsible for more than 70% of
the live foals.030 031
Profile of industry participants
Nationally, there are nearly 18,000 people who are actively The age profile of breeding industry participants also shows Age of breeding industry participants Age of initial involvement in
involved in the thoroughbred breeding industry as a a significantly older skew. Overall, less than 7% of those by type of involvement thoroughbred breeding
participant, employee or hands-off investor. At an individual involved in the breeding industry are under the age of 40 years.
level, participants provide the breeding skills to produce Conversely, nearly 53% are aged over 60 years and when adding
much of the racing stock which sustains thoroughbred racing in the 50-59 age group, it means that more than 78% of those
activity. Additionally, there are a number of larger scale involved in breeding are over the age of 50 (Figure 4).
breeding establishments (stud farms) which provide these
Under 30 2.3% Under 20 27.6%
services and provide significant employment opportunities. 0.7% 10.4%
The hands-off investors provide the funding (either solely or
30-39 7.3% 20-29 23.3%
through syndicates) to fund the breeding function through the 2.2% 15.4%
ownership and care of broodmares, stallions and foals.
40-49 17.1% 30-39 17.6%
12.7% 19.9%
The breeding sector plays a crucial role in the thoroughbred
racing industry around Australia. It is the source of much of the Age of 50-59 26.6% 40-49 17.3%
25.4% 23.5%
racing stock (with the exception of imported racehorses) that breeding
underpins the more than 2,600 race meetings that are held industry 60-69
29.1%
34.2%
50-59 9.8%
20.1%
across the racing season. participants
17.6% 4.5%
70+ 24.9%
60+ 10.7%
A strong breeding industry also has the potential to generate
significant economic benefits to the national and state/territory
economies through export income. Australian owned standing
and shuttle stallions are held in high regard and have the ability
Hands on Hands on
to generate considerable export revenues.
Hands off Hands off
Under 30 1.6%
30-39 5.2%
Demographic and life cycle profile 40-49 14.9%
Figure 5 Type of industry involvement in the Figure 6 Age of initial involvement in the Australian
50-59 25.4%
Australian Thoroughbred breeding industry thoroughbred breeding industry
60-69 32.1%
Overall, across the Australian thoroughbred breeding industry,
70+ 20.8%
males make up the majority of those involved in the breeding
sector. It is worth noting that females who are involved in the
thoroughbred breeding industry are twice as likely to be in
hands-on roles than hands-off roles (Figure 3). Figure 4 Age of participants in the Australian
thoroughbred breeding industry There is a significant difference in the age when initial Overall, more than 63% of the hands-off participants identified
involvement occurred when comparing hands-on and hands-off racehorse ownership as their ‘entrée’ into the breeding side of
Gender of breeding industry participants breeding industry participants. The average age of hands-on the industry, with an additional 23% identifying ‘family history/
participants is 30.8 years – a result that is driven by the fact that involvement’. Amongst the hands-on participants, more than
Hands-off 27.6% were under the age of 20 when they first became involved. 90% identified previous involvement with the horse industry
More than 87% of these people identified a family/history (either through ownership, family history or previous horse
82.8% 16.5% There are, however, some differences in the age profile of background – not necessarily related to racing) as being the key
(67%) or previous racehorse ownership (21%) as how they first
hands-on and hands-off breeders in the industry. The older driver to their initial interest in thoroughbred breeding (Figure 7).
became involved in thoroughbred breeding.
Hands-on skew still exists in both areas; however, it is slightly less
60.6% 37.0% pronounced amongst the hands-on participants. Nearly 27% of Overall, more than half of all hands-on participants consider
The hands-off participants revealed that their involvement in
the hands-on participants are under the age of 50 compared to their involvement as being in a full time or part-time capacity
breeding tends to have been much later in their life, with the
15.6% of the hands-off participants. Overall, however, the data whilst a further 43% consider their involvement as being a
Male Female average age of hands-off participants being 39.5 years (Figure 6).
shows that the average age of the ‘hands-on’ participants is hobby (Figure 8).
57.2 years whilst the average age of the hands-off participants
Figure 3 Gender profile of participants in the is 61.1 years (Figure 5).
Australian thoroughbred breeding industry032 033
Profile of industry participants (continued) Drivers to participation
How first became involved in thoroughbred breeding Motivations for participation in the breeding industry (strong motivation)
Previous horse background 38.3% Perception of 73.4%
14.3% A love of thoroughbreds
involvement in 84.2%
As a racehorse owner 38.1% the breeding To be involved in a champion thoroughbred racehorse
47.9%
63.2% 66.8%
industry
36.5%
Family history/involvement
23.3%
36.2% (hands on) As a hobby 57.0%
22.1%
8.0% For fun and socialising 46.4%
Through friends/colleagues 14.5%
To try and make a living as my primary source of income 22.0%
3.0% 11.1%
Investment opportunity 4.5%
To generate a secondary source of income 19.7%
Commercial interest 6.1% 27.0%
5.0%
Other 4.1%
Enjoyment of the community of thoroughbred breeders 17.7%
Hobby 43.2% 37.9%
Hands on Full time 33.3% To carry on a family tradition/involvement in breeding 14.5% Hands on
15.3%
Hands off Part time 17.4% Hands off
Figure 7 Reason for first involvement in Figure 8 Perception of involvement in Figure 9 Motivations for participation in
thoroughbred breeding thoroughbred breeding the thoroughbred breeding industry
Thoroughbred breeding remains an industry that is heavily
driven by passion and intrinsic interest. This is not to say that
Changes in participation
breeders do not seek a return on their investment, however it is
not the major driver in motivating participation.
Participants, whether hands-on or hands-off are most
motivated by their love of thoroughbreds. For those with a When assessing the extent to which breeder involvement has
hands-off involvement, the chance to be involved in a champion changed over the last three years, the research suggests that
thoroughbred racehorse is also a strong motivation ahead of those who have increased their involvement outweigh those
the social aspects to do with their involvement. who have decreased their involvement by two-to-one. Across
both hands-on and hands-off attendees, more than 40%
Whilst hands-on participants identified more strongly with their indicated that they have increased their involvement compared
involvement being their primary source of making a living, this to 23% who have decreased their involvement (Figure 10).
motivation still remains at the lower end of the scale (Figure 9).You can also read