BE PREPARED: CLIMATE CHANGE AND THE NSW BUSHFIRE THREAT - CLIMATE COUNCIL
←
→
Page content transcription
If your browser does not render page correctly, please read the page content below
Be Prepared:
Climate
change
and the
NSW
bushfire
threat

The Climate Council is an independent, crowd-funded organisation
providing quality information on climate change to the Australian public.

Climatecouncil.org.au
Authorship:
Professor Lesley Hughes
Published by the Climate Council of Australia Limited
ISBN:    978-0-9941623-5-9 (print)
         978-0-9941623-4-2 (web)
© Climate Council of Australia Ltd 2014
This work is copyright the Climate Council of Australia Ltd. All material
contained in this work is copyright the Climate Council of Australia Ltd
except where a third party source is indicated.
Climate Council of Australia Ltd copyright material is licensed under
the Creative Commons Attribution 3.0 Australia License. To view a
copy of this license visit http://creativecommons.org.au
You are free to copy, communicate and adapt the Climate Council of
Australia Ltd copyright material so long as you attribute the Climate
Council of Australia Ltd and the authors in the following manner:
Be Prepared: Climate change and the NSW bushfire threat
by Professor Lesley Hughes (Climate Council of Australia).

© Climate Council of Australia Limited 2014.

Permission to use third party copyright content in this publication can
be sought from the relevant third party copyright owner/s.
This report is printed on 100% recycled paper.

                  Professor Lesley Hughes
                  Climate Councillor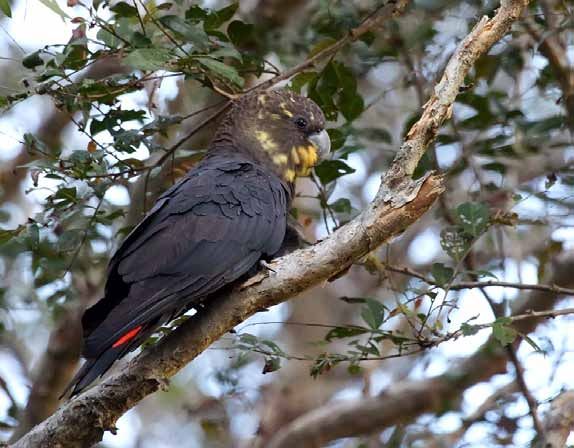
Introduction
     Residents of New South Wales (NSW)          We begin this report by describing
     have often experienced the serious          the background context of fire and its
     consequences of bushfires.                  history in NSW. We then outline the link
                                                 between bushfires and climate change,
     In 2013, bushfires in January and October
                                                 before considering how bushfire danger
     burnt 768,000 hectares of land and
                                                 weather is intensifying in NSW and
     destroyed 279 homes. Tragically, 2 people
                                                 what this means for the immediate
     lost their lives and damages were in
                                                 future. We explore the impacts of fire
     excess of an estimated $180 million.
                                                 on people, property, water supply
     Australians have always lived with          and biodiversity, before considering
     fire and its consequences, but climate      the future implications of bushfires
     change is increasing fire danger weather    for NSW fire managers, planners
     and thus the risk of fires. In NSW the      and emergency services.
     bushfire season has started early in 55
     Local Government Areas and properties
     have already been destroyed. It is time
     to think very seriously about the risks
     that future fires will pose.

Climatecouncil.org.au                                                                       Page 1
Be Prepared: Climate change and the NSW bushfire threat

              Key Findings
              1. Climate change is already                 2. In NSW the fire season is
                 increasing the risk of bushfires             starting earlier and lasting
                 in New South Wales (NSW).                    longer. Fire weather has
                 ›› Extreme fire weather has increased
                                                              been extending into Spring
                    over the last 30 years in NSW.
                                                              and Autumn.
                                                             ›› This year, the bushfire season has
                 ›› Hot, dry conditions have a major
                                                                started early in parts of NSW. The
                    influence on bushfires. Climate
                                                                state’s statutory Bush Fire Danger
                    change is making hot days hotter,
                                                                Period begins on the 1st of October,
                    and heatwaves longer and more
                                                                but this year 55 Local Government
                    frequent, with increasing drought
                                                                Areas have started the season early
                    conditions in Australia’s southeast.
                                                                with some beginning the danger
                 ›› 2013 was Australia’s hottest year           period on the 1st of August and
                    on record and in NSW the annual             others on the 1st of September.
                    mean temperature was 1.23°C
                                                             ›› The fire season will continue to
                    above average. The summer of
                                                                lengthen into the future, straining
                    2013/14 was also the driest summer
                                                                NSW’s existing resources for
                    that Sydney has experienced in 27
                                                                fighting and managing fires.
                    years. These conditions are driving
                    up the likelihood of very high fire    3. Recent severe fires in NSW
                    danger weather in the state.              have been influenced by
                 ›› Australia is a fire prone country         record hot, dry conditions.
                    and has always experienced               ›› Record breaking heat and hotter
                    bushfires. But all extreme weather          weather over the long term in
                    events are now being influenced             NSW has worsened fire weather
                    by climate change because they              and contributed to an increase
                    are occurring in a climate system           in the frequency and severity of
                    that is hotter and moister than it          bushfires.
                    was 50 years ago.

 Page 2                                                                  Climatecouncil.org.au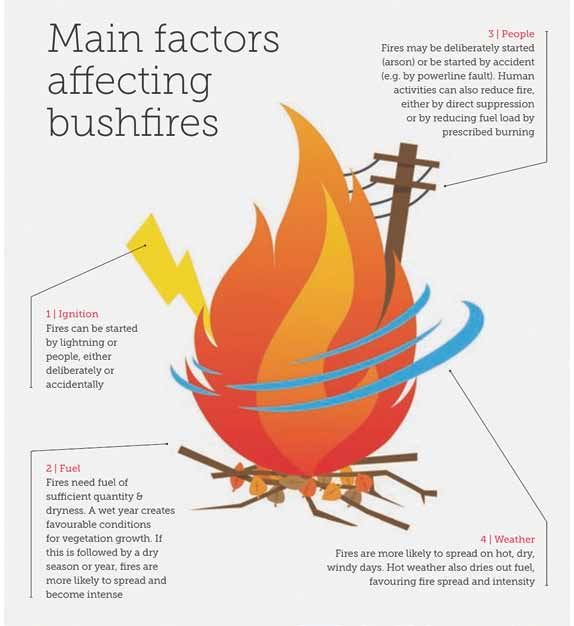
›› In October 2013, exceptionally       5. In the future, NSW is very
          dry conditions contributed to           likely to experience an
          severe bushfires on the Central         increased number of days
          Coast and in the Blue Mountains         with extreme fire danger.
          of NSW, which early estimates           Communities, emergency
          suggest caused over $180 million        services and health services
          in damages.                             across NSW must prepare.
       ›› At the beginning of August in 2014      ›› Fire severity and intensity is expected
          volunteers were fighting 90 fires          to increase substantially in coming
          simultaneously and properties              decades, especially in those regions
          were destroyed.                            currently most affected by bushfires,
                                                     and where a substantial proportion of
     4. The total economic costs of
                                                     the Australian population lives, such
        NSW bushfires in 2014 are
                                                     as NSW.
        projected to be $43 million.
        By around the middle of                   ›› Increased resources for our
        the century these costs will                 emergency services and fire
        almost triple.                               management agencies will be
                                                     required as fire risk increases. By
       ›› Bushfires have caused significant
                                                     2030, it has been estimated that the
          economic damage, estimated at
                                                     number of professional firefighters in
          $337 million per year (2011$) in
                                                     Australia will need to approximately
          Australia. With a forecast growth
                                                     double (compared to 2010) to keep
          in costs of 2.2% annually between
                                                     pace with increased population, asset
          2014 and 2050, the total economic
                                                     value, and fire danger weather.
          cost of bushfires is expected to
          reach $800 million annually by       6. This is the critical decade
          mid‑century.
                                                  ›› Australia must strive to cut emissions
       ›› These state and national                   rapidly and deeply to join global
          projections do not incorporate             efforts to stabilise the world’s climate
          increased bushfire incident rates          and to reduce the risk of even more
          due to climate change and could            extreme events, including bushfires.
          potentially be much higher.

Climatecouncil.org.au                                                                           Page 3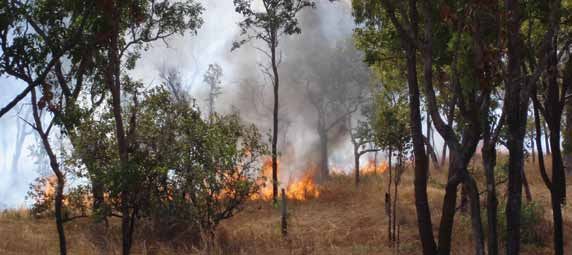
Be Prepared: Climate change and the NSW bushfire threat

            1. The nature of bushfires

              Figure 1: Hazard reduction burn in NSW

              Fire has been a feature of the Australian      describes a recurrent pattern of fire, with
              environment for at least 65 million years      the most important characteristics being
              (Cary et al. 2012). Human management of        the frequency, intensity, and seasonality of
              fires also has a long history, starting with   the fire. Significant changes in any of these
              fire use by indigenous Australians (“fire-     features of a fire regime can have a very
              stick farming”) up to 60,000 years ago.        important influence on its ecological and
              Between 3% and 10% of Australia’s land         economic impacts (Williams et al. 2009).
              area burns every year (Western Australian
                                                             Fire is a complex process that is very
              Land Information Authority 2013).
                                                             variable in space and time. A fire needs to
              In Australia, the Forest Fire Danger Index     be started (ignition), it needs something
              (FFDI) is used to measure the degree of risk   to burn (fuel) and it needs conditions that
              of fire in our forests (Luke and Macarthur     are conducive to its spread (weather and
              1978). The Bureau of Meteorology (BoM)         topography) (see Figure 2). Fire activity
              and fire management agencies use the           is strongly influenced by weather, fuel,
              FFDI to assess fire risk and issue warnings.   terrain, ignition agents and people. The
              The index was originally designed on a         most important aspects of weather that
              scale from 0 to 100, with fires between        affect fire and fuels are temperature,
              75 and 100 considered ‘extreme’. The           precipitation, wind and humidity. Once
              unprecedented ferocity of the 2009 Black       a fire is ignited, very hot days with low
              Saturday bushfires in Victoria saw a new       humidity and high winds are conducive
              ‘catastrophic’ category added to the FFDI      to its spread. The type, amount, and
              for events exceeding the existing scale.       moisture level of fuel available are also
                                                             critical determinants of fire behaviour,
              The concept of “fire regimes” is important
                                                             extent and intensity (Climate Council
              for understanding the nature of bushfires
                                                             2014d). The relationship between rainfall
              in Australia, and for assessing changes in
                                                             and fuel is complex. Wet seasons can lead
              fire behaviour caused by both human and
                                                             to increased plant growth and therefore
              climatic factors (Figure 2). A fire regime
                                                             increase fuel buildup in the months or

 Page 4                                                                      Climatecouncil.org.au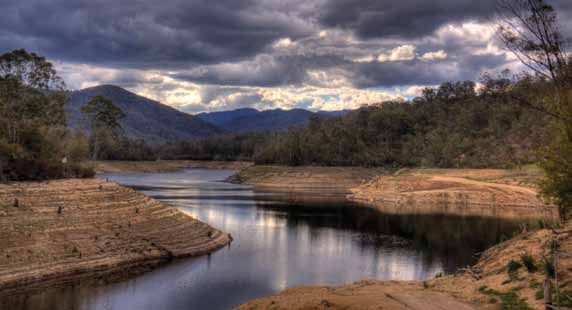
years before a fire is ignited (Bradstock    conditions and the moisture content
     et al. 2009). Warmer temperatures and        of the fuel. As fire weather conditions
     low rainfall in the period immediately       become more severe, fuel moisture
     preceding an ignition, however, can lead     content declines, making the fuel more
     to drier vegetation and soil, making the     flammable. By contrast, in arid regions,
     existing fuel more flammable. Warmer         vegetation and thus fuel in most years is
     temperatures can also be associated with     sparsely distributed and fires, if ignited,
     a higher incidence of lightning activity     rarely spread far. In Australia’s southeast,
     (Jayaratne and Kuleshov 2006), increasing    fires are common in the heathlands and
     the risk of ignition.                        dry sclerophyll forests, typically occurring
                                                  about every 5 to 30 years, with spring and
     In the temperate forests of NSW, fire
                                                  summer being peak fire season (Clarke et
     activity is strongly determined by weather
                                                  al. 2011; Bradstock et al. 2012).

     Figure 2: Main factors affecting bushfires

Climatecouncil.org.au                                                                            Page 5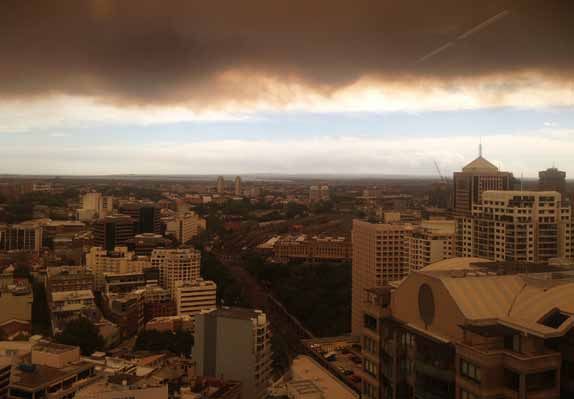
Be Prepared: Climate change and the NSW bushfire threat
Since 1926, in NSW 27 significant bushfire
events have affected hundreds of thousands of
hectares of land and killed livestock, destroyed
thousands of homes, and claimed 116 lives.
Since 1926, in NSW 27 significant and settlements (Willis 2005; Penman
bushfire events have affected hundreds et al. 2013). Some of Australia’s most
of thousands of hectares of land and catastrophic bushfires have been ignited
killed livestock, destroyed thousands by powerline faults. But people also play
of homes, and claimed 116 lives (NSW an important role in reducing fire risk,
PRS 2014). by vegetation management including
prescribed burning to reduce fuel
People are a very important component
load and conducting fire suppression
of the fire equation. Many fires are
activities. Interventions such as total
either deliberately or accidentally
fire ban days also play a pivotal role in
lit, and in places where population
reducing ignitions under dangerous
density is high, the probability of a
fire conditions.
fire igniting increases close to roads
Ten major bushfires in NSW that have seen major damage to
homes, property, land and loss of life since 1926
CASINO
North
MOREE
Coast
North West
New COFFS
Darling England HARBOUR
ARMIDALE
1926 Glen Innes, Dubbo, Forbes,
GUNNEDAH Cowra, Parkes, Wagga Wagga,
KEMPSEY Pambula and Eden
1944 Blue Mountains and Lochinvar
BROKEN Central North
HILL Central West TAREE 1979-80 Duffys Forests and surrounds
DUBBO Mid-Coast 1984-5 Western Division
Western 1990-91 Baulkham Hills, Gosford,
Wyong and Lake Macquarie
NEWCASTLE
1993-94 North and South Coast, Blue
Mountains and Sydney
Lachlan FORBES
BATHURST
1997-98 Burragong, Shoalhaven,
COWRA Central Coast and surrounds
Tablelands SYDNEY
GRIFFITH 2002-03 Greater Sydney, North and
South Coast and Tablelands
COOTAMUNDRA
Riverina GOULBURN
January 2013 Coonabarabran,
WAGGA NOWRA Cooma, Yass and surrounds
WAGGA
October 2013 Blue Mountains,
DENILIQUIN Hume Souther Highlands, Central Coast and
ACT
surrounds
COOMA
South East
0 75 150 300
km
Figure 3: Ten major bushfires in NSW that have damaged homes, property, land and
resulted in loss of life since 1926
Page 6 Climatecouncil.org.au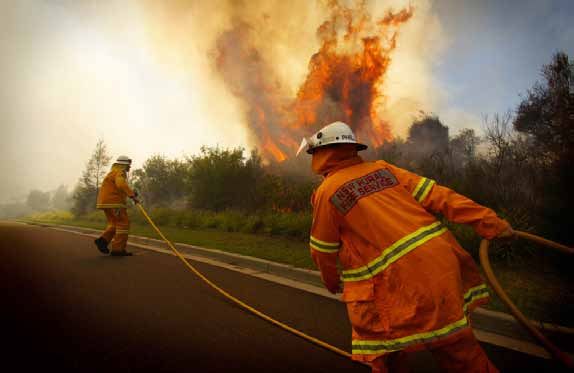
2. W
         hat is the link
        between bushfires
        and climate change?

     Figure 4: The NSW Rural Fire Service in Belrose, NSW

     A fire needs to be started (ignition), it needs   between bushfires and climate change
     something to burn (fuel) and it needs             therefore comes from the relationship
     conditions that are conducive to its spread       between the long-term trend towards
     (weather) (Section 1). Climate change             a warmer climate due to increasing
     can affect all of these factors in both           greenhouse gas emissions—the increasing
     straightforward and more complex ways.            amount of heat in the atmosphere—
                                                       and the incidence of very hot days. Put
     The role of climate change in ignition
                                                       simply, climate change is increasing the
     is likely to be relatively small compared
                                                       frequency and severity of very hot days
     to the fuel and weather, but may still
                                                       (IPCC 2012; 2013), and is driving up the
     be significant. For example, lightning
                                                       likelihood of very high fire danger weather
     accounts for ~27% of the ignitions in
                                                       (see Section 3). The 2013 October bushfires
     the Sydney region (Bradstock 2008) and
                                                       in the Blue Mountains of NSW illustrate the
     the incidence of lightning is sensitive to
                                                       role of weather conditions in affecting fire
     weather conditions, including temperature
                                                       severity. The bushfires were preceded by
     (Jayaratne and Kuleshov 2006). Climate
                                                       the warmest September on record for the
     change can also affect fuel. For example,
                                                       state, the warmest 12 months on record
     a lack of rainfall can dry out the soil and
                                                       for Australia, and below average rainfall
     vegetation, making existing fuel more
                                                       in forested areas, leading to very dry fuels
     combustible. But whilst climate change
                                                       (Bushfire CRC 2013).
     can affect ignition and fuel, it is the impact
     of climate change on weather that has the         It is important to note that climate change
     most significant influence on fire activity.      is already increasing the intensity and
                                                       frequency of some extreme events such
     Very hot, dry and windy days create very
                                                       as very hot days and droughts.
     high bushfire risk. The most direct link

Climatecouncil.org.au                                                                                 Page 7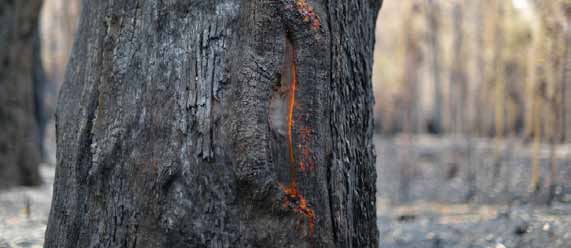
Be Prepared: Climate change and the NSW bushfire threat

              The strength of trends and the               is expected to increase the number
              confidence in their attribution, however,    of days with very high and extreme
              varies between regions and between           fire weather, particularly in southern
              different types of event (IPCC 2012;         Australia (IPCC 2014).
              2013; 2014). Extreme weather events,
              like bushfires, are influenced by a
              number of different factors. That’s why
                                                           Climate change is
              asking if a weather event is “caused” by     expected to increase
              climate change is the wrong question.
              All extreme weather events are now           the number of days
              being influenced by climate change           with very high and
              because they are occurring in a climate
              system that is hotter and moister than       extreme fire weather,
              it was 50 years ago (Trenberth 2012).
              The latest IPCC report confirms with
                                                           particularly in
              high confidence that climate change          southern Australia

              3. Observations
                  of changing
                  bushfire danger
                  weather in NSW
              Increasing hot days, heatwaves and           These heatwaves are becoming
              rainfall deficiencies in NSW are driving     more intense over time, with average
              up the likelihood of very high fire danger   heatwave intensity increasing in
              weather in the state.                        Sydney by 1.5°C, since 1950 (BoM 2013a;
                                                           Climate Council 2014c). Record high
              While hot weather has always been
                                                           temperatures persisted into 2013, which
              common in Australia’s southeast, it
                                                           proved to be Australia’s hottest year
              has become more common and severe
                                                           on record, with the mean maximum
              over the past few decades, including
                                                           temperature during the year 1.45°C
              in NSW (see Figure 5). The southeast of
                                                           above average (BoM 2014c; Climate
              Australia has experienced significant
                                                           Council 2014a). Temperatures soared in
              warming during the last 50 years (Timbal
                                                           NSW, with annual mean temperature
              et al. 2012). The summer of 2012/13 was
                                                           1.23°C above average. The monthly
              the hottest on record nationally, with
                                                           average temperature record for NSW
              two intense and prolonged heatwaves
                                                           in September was shattered by 4.68°C
              in early January and March setting all
                                                           and October was also the second
              time-high maximum temperatures
                                                           warmest month on record in Sydney,
              in Sydney (Climate Council 2014c).

 Page 8                                                                   Climatecouncil.org.au
at 3.6°C above the long-term average throughout the 21st century and predicts
(BoM 2014d; Climate Commission with high confidence that bushfire
2013; Climate Council 2014a). The danger weather will increase in most of
IPCC projects with virtual certainty southern Australia, including New South
that warming in Australia will continue Wales (IPCC 2014).
Figure 5: NSW/ACT increasing heat (Australian Bureau of Meteorology). Blue bars
indicate years where annual temperatures were below average, and red bars indicate
years of above average temperatures.
Much of eastern Australia has become the driest summer that Sydney has
drier since the 1970s, with the southeast experienced in 27 years (BoM 2014a;
experiencing a drying trend due to Climate Council 2014b). BoM projections
declines in rainfall combined with indicate that this drying trend will persist
increased temperatures (BoM 2013b; this year, with a drier than normal
Climate Commission 2013). Since the October to December likely for most of
mid-1990s, southeast Australia has eastern and northern NSW (BoM 2014b).
experienced a 15 percent decline in late This long-term rainfall deficit across
autumn and early winter rainfall and a southern Australia, coupled with above
25 percent decline in average rainfall average temperatures, has reduced soil
in April and May (CSIRO & BoM 2014). moisture and has lead to the drying of
Rainfall deficiencies for the eight months heavy fuels in forests, increasing bushfire
from December 2013 to July 2014 have potential in NSW (Bushfire and Natural
increased in extent over northeastern Hazards CRC 2014).
NSW and the summer of 2013/14 was
Climatecouncil.org.au Page 9Be Prepared: Climate change and the NSW bushfire threat
It is very likely that an increased the 1970s, with the FFDI increasing
incidence of drought in the southeast significantly at 16 of 38 weather stations
—coupled with consecutive hot and dry across Australia between 1973 and
days—will in turn result in longer fire 2010, with the majority of these stations
seasons and an ever larger number of concentrated in Australia’s southeast
days of extreme fire danger in coming and none of the stations recording a
decades (e.g. Clarke et al. 2011; 2013). significant decrease (Clarke et al. 2013).
These changes have been most marked
The concept of a in spring, indicating a lengthening fire
season across southern Australia, with
‘normal’ bushfire fire weather extending into October
season is rapidly and March.
changing as bushfires This year the bushfire season has started
early in parts of NSW. The state’s statutory
continue to increase Bush Fire Danger Period begins on the
in number, burn for 1st of October, but this year 55 Local
Government Areas have started the
longer and affect season early with some beginning the
larger areas of land. danger period on the 1st of August and
others on the 1st of September. At the
beginning of August volunteers were
The concept of a ‘normal’ bushfire fighting 90 fires simultaneously and
season is rapidly changing as bushfires properties were destroyed (NSW RFS 2014).
continue to increase in number, burn The lengthening fire season means that
for longer and affect larger areas of land opportunities for fuel reduction burning
(Bushfire and Natural Hazards CRC 2014). are reducing (Matthews et al. 2012). The
The influence of hotter, drier weather Southern Australia Seasonal Bushfire
conditions on the likelihood of bushfire Outlook for 2014/15 (see Figure 7) projects
spread in NSW is captured by changes in that due to the hotter, drier weather in
the Forest Fire Danger Index (FFDI), an southeast Australia, above normal fire
indicator of extreme fire weather. NSW activity can be expected in the coastal
has already experienced a significant tablelands and central slopes of NSW
increase in extreme fire weather since (Bushfire and Natural Hazards CRC 2014).
Figure 6: Charred tree after a bushfire, NSW
Page 10 Climatecouncil.org.auThe Southern Australia Seasonal Bushfire
Outlook for 2014/15 projects that due to the
hotter, drier weather in southeast Australia,
above normal fire activity can be expected in
the coastal tablelands and central slopes of NSW
Bushfire Bushfire
Potential 2014-15
Potential 2014-15
Above Normal
Above Normal Normal
Normal
Figure 7: Southern Australia Seasonal Bushfire Outlook
(Bushfire and Natural Hazards CRC 2014)
Research aimed at understanding future Future changes in the El Niño-Southern
fire activity in NSW has a long history Oscillation (ENSO) phenomenon are
(Table 1). While the detailed results of also likely to have an influence on fire
these studies vary due to the use of activity. There is a strong positive
different global circulation models relationship between El Niño events
(GCMs) and different climate scenarios, and fire weather conditions in southeast
their collective conclusion is clear— and central Australia (Williams and
weather conditions conducive to fire Karoly 1999; Verdon et al. 2004; Lucas
in the southeast and southwest of the 2005) and between El Niño events and
continent are becoming increasingly actual fire activity (Harris et al. 2013).
frequent and this trend will continue
(Climate Council 2014d).
Climatecouncil.org.au Page 11Be Prepared: Climate change and the NSW bushfire threat
Significant changes have occurred in El Niño-driven drying in the western
the nature of ENSO since the 1970s, with Pacific Ocean by mid-to late 21st century
the phenomenon being more active and (Power et al. 2013); such a change would
intense during the 1979–2009 period increase the incidence of heat and
than at any other time in the past 600 drought, and potentially fire activity,
years (Aiken et al. 2013). Although there in eastern Australia.
is no consensus on the influence of
Table 1: Summary of projections from
climate change on ENSO behaviour, modelling studies aimed at projecting
recent projections suggest increases in changes in fire risk in southeast Australia
Study Projections
Beer et al. (1988) 10%–20% increase in FFDI in southeast
Beer and Williams (1995) Increase in FFDI with doubling of atmospheric CO2, commonly
>10% across most of continent, especially in the southeast, with a
few small areas showing decreases
Williams et al. (2001) General trend towards decreasing frequency of low and moderate fire
danger rating days, but an increasing frequency of very high and in
some cases extreme fire danger days
Cary and Banks (2000), Direct effects of a 3–4°C temperature increase in the ACT would more
Cary (2002) than double fire frequency, increase average fire intensity by 20%,
increase the area burned in autumn, and reduce areas burned in spring
Hennessy (2007) Potential increase of very high and extreme FFDI days 4%–25% by
2020, 15%–70% by 2050
Lucas et al. (2007) Increases in annual FFDI of up to 30% by 2050 over historical levels in
southeast Australia and up to a trebling in the number of days per year
where the uppermost values of the index are exceeded. The largest
changes projected to occur in the arid and semi-arid interior of NSW
and northern Victoria.
Pitman et al. (2007) Probability of extreme fire risk in 2050 increased by about 20%
under both relatively low and relatively high scenarios, and increased
dramatically (50%–100%) by 2100 under high scenario along the
NSW coast and more than 100% along the QLD coast. In the Perth
region, impact projected to be more limited (less than 25% in both 2050
and 2100 (less than 25% in both 2050 and 2100).
Bradstock et al. (2009) 20%-84% increase in potential ignition days for large (> 1000 ha)
fires in the Blue Mountains and Central Coast regions by 2050
Hasson et al. (2009) Analysed likelihood of increase in incidence of synoptic weather
pattern in southeast Australia known to be associated with extreme
fire events. Projected potential frequency of extreme events to increase
from around 1 event every 2 years during the late 20th century to
around 1 event per year in the middle of the 21st century, and to
around 1 to 2 events per year by the end of the 21st century
Clarke et al. (2011) FFDI projected to decrease or show little change in the tropical
northeast. In the southeast, FFDI projected to increase strongly by
end of the 21st century, with the fire season extending in length and
starting earlier
Matthews et al. (2012) Warming and drying climate projected to produce drier, more
flammable fuel, and to increase rate of fire spread
Page 12 Climatecouncil.org.au4. Impacts of
bushfires in NSW
In NSW, bushfires have had a very wide Communities in NSW are particularly
range of human and environmental vulnerable to bushfires because
impacts, including loss of life and severe large populations live close to highly
health effects, damage to property, flammable native vegetation, such as
devastation of communities and effects eucalyptus trees, that are exposed to
on water and natural ecosystems frequent severe fire weather (Chen and
(Stephenson 2010). McAneney 2010; Handmer et al. 2012;
Price and Bradstock 2013). For example,
4.1 Health Impacts in the Blue Mountains, approximately
38,000 homes are within 200 metres of
Large populations in NSW are at risk bushland, and 30,000 within 100 metres;
from the health impacts of bushfires, with many of these homes backing
which have contributed to physical directly onto bushland (McAneney 2013).
and mental illness as well as death.
Large populations in NSW are at risk from
the health impacts of bushfires, which have
contributed to physical and mental illness as
well as death.
Tragically, in Australia bushfires have to its impacts (Spracklen et al. 2009;
accounted for more than 800 deaths Dennekamp and Abramson 2011;
since 1850 (Cameron et al. 2009; King Bernstein and Rice 2013). Smoke from
et al. 2013), and have contributed to 116 bushfires in the Blue Mountains regularly
deaths since 1926 in NSW (NSW PRS affects Sydney’s air quality. Days with
2014). In addition to fatalities, bushfire severe pollution from bushfires around
smoke can seriously affect health. Smoke Sydney are associated with increases
contains not only respiratory irritants, in all-cause mortality of around 5%
but also inflammatory and cancer- (Johnston et al. 2011). The estimated
causing chemicals (Bernstein and annual health costs of bushfire smoke in
Rice 2013). Smoke can be transported Sydney are also high, at $8.2 million per
in the atmosphere for hundreds or annum (adjusted to 2011 values) (Deloitte
even thousands of kilometres from the Access Economics 2014).
fire front, exposing large populations
Climatecouncil.org.au Page 13Be Prepared: Climate change and the NSW bushfire threat
During the Blue Mountains bushfires at higher risk (Morgan et al. 2010).
in October 2013, air quality levels in the
In addition to physical health impacts,
Sydney region were measured at 50 times
the trauma and stress of experiencing a
worse than normal. NSW Health recorded
bushfire can also increase depression,
that 228 people attended hospital
anxiety, and other mental health issues,
with breathing difficulties; 778 other
both in the immediate aftermath of
individuals were treated by ambulance
the trauma and for months or years
staff and there was a 124 per cent increase
afterwards (McFarlane and Raphael
in patients with asthma conditions
1984; Sim 2002; Whittaker et al. 2012).
seeking hospital treatment (AEM 2013). A
Following the 2013 Blue Mountains
study of hospital admissions from 1994–
bushfires, mental health charity ‘Beyond
2007 has found that hospital admissions
Blue’ collaborated with the Australian
for respiratory illness increased by 12
Red Cross to develop resources to assist
percent on days with bushfire smoke in
bushfire victims with increases in
Sydney (Martin et al. 2007). The health
depression and anxiety (Beyond Blue
impacts of bushfire smoke are by no
2013a; 2013b) and over 100 households
means confined to Sydney, with cities
requested wellbeing assistance from
such as Newcastle and Wollongong
Red Cross volunteers (Red Cross 2013).
also experiencing increases in hospital
Not for profit organisation, Nepean-Blue
admissions due to respiratory conditions
Mountains Medicare Local (NBMML) has
(Martin et al. 2007). The impacts of
also established a program to assist those
bushfire smoke in the community are
with mental health problems resulting
also uneven, with the elderly, infants and
from the October disaster (NBMML
those with chronic heart or lung diseases
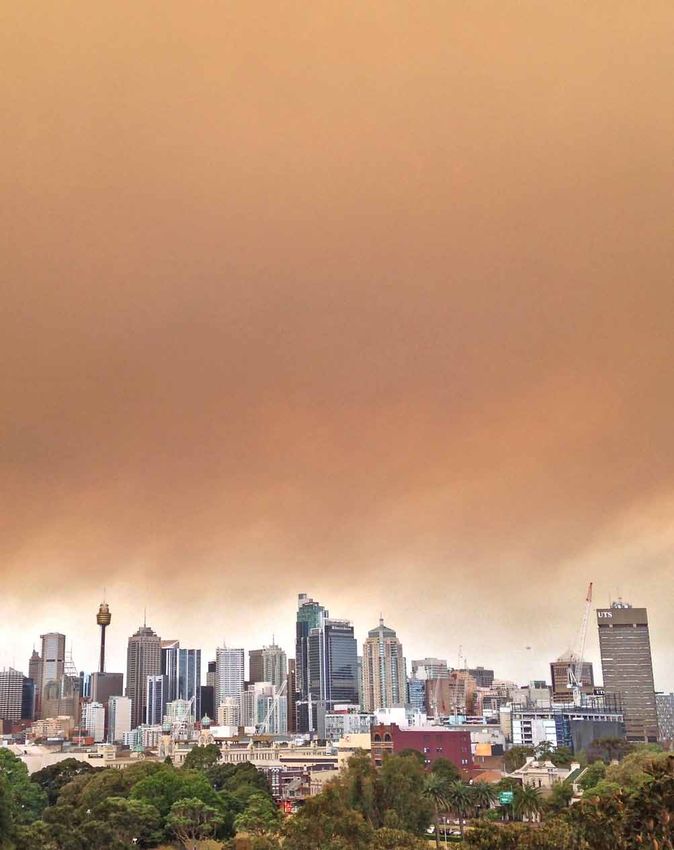
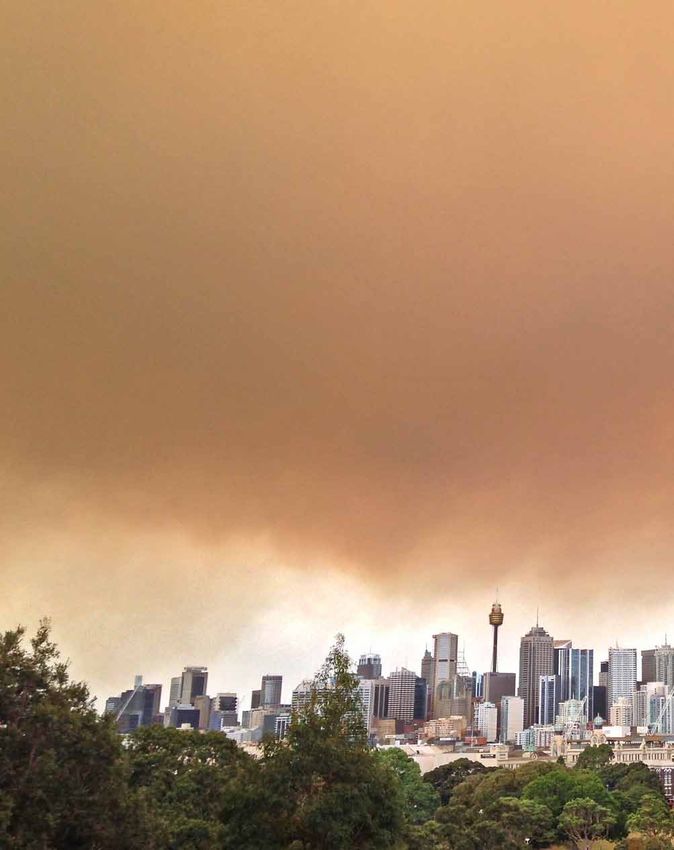
Figure 8: Bushfire smoke from the Blue Mountains blankets Sydney in 2013
Page 14 Climatecouncil.org.au2014)—although data on the numbers of a measure that includes insured losses
patients involved in the program is not as well as broader social costs, is
yet publicly available. Post-traumatic estimated to be $337 million per year
stress, major depression, anxiety and in Australia (2011$), a figure that is
suicide can also manifest among expected to reach $800 million by 2050
firefighters, sometimes only becoming (Deloitte Access Economics 2014). The
evident many months after an extreme total economic costs of NSW bushfires
event (McFarlane 1988; Cook et al. 2013). for 2014 are projected to be $43 million
(2011$). By about mid century these costs
4.2 Economic Costs will almost triple, potentially reaching
$103 million (Deloitte Access Economics
The economic cost of bushfires— 2014). These estimates take into account
including loss of life, livelihoods, increases in the number of households,
property damage and emergency growth in the value of housing stock,
services responses—is very high. population growth and increasing
The total economic cost of bushfires, infrastructure density.
The total economic costs of NSW bushfires
for 2014 are projected to be $43 million (2011$).
By about mid century these costs will almost
triple, potentially reaching $103 million
Figure 9: After a bushfire in Ku-ring-gai
Climatecouncil.org.au Page 15Be Prepared: Climate change and the NSW bushfire threat
Table 2: Damage and loss estimates in ten significant bushfire events in NSW since
mid-1970s (NSW PRS 2014) (for full list of damages see Appendix A).
Date Location Area/Property Damage Deaths Normalised
/Injured Cost ($2011
AUD)
1974–75 Far west, Cobar, Balranald 4,500,000 ha. 50,000 stock 6 deaths n/a
& Moolah-Corinya
1977–78 Blue Mountains 54,000 ha. 49 buildings 3 deaths n/a
destroyed
1979–80 Duffys Forest, Lucas > 1,000,000 ha. 28 houses 13 deaths n/a
Heights, Terry Hills, destroyed. 20 houses
Ingleside, Belrose, damaged
Elanora Heights,
Lithgow, Mt Wilson,
Mt Tomah & Grose Valley
1984–85 Western Division 3,500,000 ha. 40,000 stock 5 deaths $179m
1990–91 Baulkham Hills, Gosford, 14 houses destroyed 2 deaths $54m
Wyong & Lake Macquarie
1993–94 North coast, Hunter, > 800,000 ha. 206 houses 4 deaths $215m
South coast, Blue destroyed
Mountains & Sydney
1997–98 Burragorang, Pilliga, > 500,000 ha. 10 houses 4 deaths $8m
Hawkesbury, Hunter, destroyed
Shoalhaven, Central Coast
& Menai
2001–02 44 LGAs in Greater 744,000 ha. 109 houses 0 deaths $131m
Sydney, Hunter, North destroyed. 40 houses
Coast, Mid North Coast, damaged
Northern Tablelands & 6,000 stock
Central Tablelands
2002–03 81 LGAs in Greater 1,464,000 ha. 86 houses 3 deaths $43m (October
Sydney, Hunter, destroyed. 11 houses 2002 fires)
North Coast, Northern damaged
Tablelands, Northern 3,400 stock
Rivers, north‑west slopes,
north-west plains, Central
Tablelands, Southern
Tablelands, Illawarra
& South Coast
October Blue Mountains, 118,000 ha. 222 houses 2 deaths $183.4m
2013 Port Stephens, destroyed, 168 houses (early figures)
Lake Munmorah, damaged
Hunter, Hawkesbury,
Central Coast &
Southern Highlands
NSW has already experienced a (Table 2). Indirect costs, such as impacts
significant increase in extreme fire on local tourism industries can also be
weather since the 1970s, and bushfires significant. For example, a month after
occurring in NSW from 1970–2013 have the 2013 Blue Mountains bushfires,
contributed to 60 deaths, the destruction tourism operators estimated losses of
of nearly 800 properties and have nearly $30 million due to declines in
affected over 14 million hectares of land visitors and cancellations alone.
Page 16 Climatecouncil.org.auBushfires can cause significant losses in 4.3 Environmental
farming areas of regional and rural NSW.
As shown in Table 2, bushfires can cause
Impacts
the death of hundreds of thousands of Fire can affect the quality and quantity of
livestock and affect significant amounts water in catchments and have significant
of farming land. Stock that survives the impacts on ecosystems.
initial bushfires can face starvation in
the post-fire period, as well as threats 4.3.1 Impact on water
from predators due to the destruction of quality and quantity
fences around properties (Stephenson
2010). Smoke damage can also taint fruit Large-scale high intensity fires that
and vegetable crops, with wine grapes remove vegetation expose topsoils
particularly susceptible (Stephenson to erosion and increased runoff after
2010). For example, bushfires in 2003 subsequent rainfall (Shakesby et al. 2007).
significantly tainted grapes in NSW with This can increase sediment and nutrient
smoky, burnt, ash aromas, making them concentrations in nearby waterways,
unusable (Jiranek 2011). potentially making water supplies unfit
for human consumption (Smith et al.
It is important to note that these 2011; IPCC 2014). For example, bushfires
economic losses shown in Table 2 do in January 2003 devastated almost all of
not account for the full range of costs the Cotter catchment in the Australian
associated with bushfires—few attempts Capital Territory, causing unprecedented
have been made to account for loss of life, levels or turbidity, iron and manganese
social disruption and trauma, opportunity and significantly disrupting water supply.
costs for volunteer fire fighters, fixed Fires can also affect water infrastructure.
costs for bushfire fighting services, Fires in the Sydney region in 2002 affected
government contributions for rebuilding the Woronora pumping station and water
and compensation, impacts on health, filtration plants, resulting in a community
and ecosystem services (King et al. 2013). alert to boil drinking water (WRF 2013).
Figure 10: Brogo Dam, NSW
Climatecouncil.org.au Page 17Be Prepared: Climate change and the NSW bushfire threat
4.3.2 Impact on ecosystems too long, plant species that rely on fire for
reproduction may be eliminated from an
Fire is a regular occurrence in many
ecological community. Animals are also
Australian ecosystems, and many species
affected by bushfires, for example if they
have evolved strategies over millions of
are restricted to localised habitats and
years to not only withstand fire, but to
cannot move quickly, and/or reproduce
benefit from it (Crisp et al. 2011, Bowman
slowly, they may be at risk from intense
et al. 2012). Fire does not “destroy”
large-scale fires that occur at short
bushland, as is often reported; rather, it
intervals (Yates et al. 2008). Deliberate
acts as a major disturbance with a range
fuel reduction burning can also destroy
of complex impacts on different species
habitats if not managed properly. For
and communities. Particular fire regimes
example in the Shoalhaven region of
(especially specific combinations of fire
NSW, the threatened eastern bristlebird
frequency and intensity) can favour
and the glossy black cockatoo face the
some species and disadvantage others.
potential destruction of their habitats
If fires are too frequent, plant species can
which overlap with areas of bushland that
become vulnerable to local extinction as
are being targeted in hazard reduction
the supply of seeds in the soil declines.
burning (Whelan et al. 2009).
Conversely, if the interval between fires is
Figure 11: A glossy black cockatoo in NSW
Page 18 Climatecouncil.org.au5. Implications of
increasing fire activity
The population of NSW is expected to costs of bushfires in selected Australia
grow from 7.4 million people (as of June states, finding that bushfires in NSW will
2013), up to 12.6 million people by 2061 cost $103 million by about mid century
(ABS 2013a; 2013b). The steady urban (2011$). In addition to insured and social
encroachment into bushland, along with losses, health costs from particulate
increasing fire danger weather, present matter emitted during bushfires in NSW
significant and growing challenges for are projected to cost $8.2 million per
the state. This challenge is exemplified annum. Attempting to mitigate these
in Greater Sydney, a region considered damages through practices such as
to be one of the more bushfire-prone prescribed burning can also be costly.
areas in Australia. It is home to a quarter For example, it is likely that NSW is
of Australia’s population, and 2005 burning around 0.5% of bushland in any
projections have found that 190,000 given year, at a cost of 13.3 tonnes of
homes were exposed to greater bushfire carbon equivalent emissions per hectare
risk due to their close proximity (within (Deloitte Access Economics 2014). The
80m) to dense bushland (Chen 2005). Deloitte analysis notes that climate
The Rural Fire Service Commissioner change will increase very high fire
Shane Fitzsimmons has said that during danger weather and associated bushfire
this bushfire season more than a million incidents over time. Despite this, the
NSW homes are at risk (Sydney Morning Deloitte projections do not incorporate
Herald 2014). increased bushfire incident rates
due to climate change, making them
The economic, social and environmental
conservative economic forecasts that
costs of increasing bushfire activity in
could be significantly higher if climate
NSW are potentially immense. In one of
change was incorporated into the
the few analyses to consider projected
projections (Deloitte Access Economics
costs of bushfires in NSW, Deloitte
2014). As NSW bushfires increase in
Access Economics (2014) calculated the
frequency and intensity, a detailed cost
potential insured losses and broader
benefit analyses of bushfire mitigation
social costs, to forecast total economic
and adaptation are needed.
Health costs from particulate matter emitted
during bushfires in NSW are projected to cost
$8.2 million per annum.
Climatecouncil.org.au Page 19Be Prepared: Climate change and the NSW bushfire threat
Figure 12: A hazard reduction burn being conducted by the NSW RFS in Belrose, 2011
There is increasing interest in how and environmental amenity, and
adaptation to an increasingly bushfire- controlling air pollution near urban
prone world may reduce vulnerability. areas (Penman et al. 2011; Williams and
Current initiatives centre on planning Bowman 2012; Adams 2013; Altangerel
and regulations, building designs to and Kull 2013). The increasing length of
reduce flammability, burying powerlines the fire season will reduce the window
in high risk areas and retrofitting of opportunity for hazard reduction at
electricity systems, fuel management, the same time that the need for hazard
fire detection and suppression, improved reduction becomes greater.
early warning systems, and community
education (Preston et al. 2009; Buxton et
al. 2011; O’Neill and Handmer 2012; King
Australia’s premier
et al. 2013). Responses to bushfires can fire and emergency
be controversial, particularly the practise
of prescribed burning, where fires are services agencies
lit in cool weather to reduce the volume have recognised
of fuel. For example, during 2012–13,
the largest ever hazard reduction burn the implications of
was conducted in NSW, with 330 burns
carried out over 205, 890 ha of national
climate change for
parks (NSW Government 2014). Fire bushfire risk and
managers are constantly faced with
the challenge of balancing the need to
fire‑fighting resources
reduce risk to life and property whilst for some time.
simultaneously conserving biodiversity
Page 20 Climatecouncil.org.auAustralia’s premier fire and emergency will need to increase from approximately
services agencies have recognised 11,000 in 2010 to 14,000 by 2020 and
the implications of climate change for 17,000 by 2030 (NIEIR, 2013). When
bushfire risk and fire-fighting resources the increased incidence of extreme
for some time (AFAC, 2009; 2010). fire weather under a realistic warming
Longer fire seasons have implications scenario is also taken into account, a
for the availability and costs of fire- further 2000 firefighters will be needed
fighting equipment that is leased from by 2020, and 5000 by 2030 (NIEIR, 2013).
fire fighting agencies in the Northern Overall, this represents a doubling of
Hemisphere. As fire seasons in the two professional firefighter numbers needed
hemispheres increasingly overlap, such by 2030, compared to 2010. These
arrangements may become increasingly estimates are likely to be conservative
impractical (Handmer et al., 2012). because they do not account for the
Substantially increased resources for fire potential lengthening of the fire season,
suppression and control will be required. in addition to increased fire weather.
Most importantly, a substantial increase Further, they do not account for the
in the number of both professional and increased pressures on the professional
volunteer firefighters will be needed. firefighting services due to declining
To keep pace with asset growth and numbers of volunteer firefighters
population, it has been estimated that (NIEIR, 2013).
the number of professional firefighters
6. This is the
Critical Decade
The impacts of climate change are impacts as the temperature rises. For
already being observed. Sea levels are NSW, these impacts include increased
rising, oceans are becoming more acidic, fire danger weather and longer bushfire
and heatwaves have become longer and seasons. Ensuring that this guardrail is
hotter. We are now more confident than not exceeded will prevent even worse
ever that the emission of greenhouse impacts from occurring.
gases by human activities, mainly
The evidence is clear and compelling.
carbon dioxide from the combustion
The trend of increasing global emissions
of fossil fuels, is the primary cause for
must be halted within the next few
the changes in climate over the past
years and emissions must be trending
half‑century (IPCC 2013; 2014).
downwards by 2020. Investment in
Projections of future climate change and renewable, clean energy must therefore
its impacts have convinced nations that increase rapidly. And, critically, most
the global average temperature, now of the known fossil fuel reserves must
at 0.9°C above the pre-industrial level, remain in the ground.
must not be allowed to rise beyond 2°C–
This is the critical decade to get on
the so-called ‘2°C guardrail’. Societies
with the job.
will have to adapt to even more serious
Climatecouncil.org.au Page 21Be Prepared: Climate change and the NSW bushfire threat
Appendix A: Cost of
bushfires in NSW
Date Location Area/Property Damage Deaths Normalised
/Injured Cost ($2011
AUD)
1969–70 Roto & Riverina 280,000 ha. 1 death n/a
1972–73 Kosciusko, Eden, 300,000 ha 0 deaths n/a
Queanbeyan &
Burrinjuck Dam
1974–75 Far west, Cobar, Balranald 4,500,000 ha. 50,000 stock 6 deaths n/a
& Moolah-Corinya
1976–77 Blue Mountains & 74,000 ha. 3 houses 0 deaths n/a
Hornsby destroyed
1977–78 Blue Mountains 54,000 ha. 49 buildings 3 deaths n/a
destroyed.
1978–79 Southern Highlands & > 50,000 ha. 5 houses 0 deaths n/a
South West Slopes destroyed. Heavy stock
losses
1979–80 Duffys Forest, Lucas > 1,000,000 ha. 28 houses 13 deaths n/a
Heights, Terry Hills, destroyed. 20 houses
Ingleside, Belrose, damaged.
Elanora Heights, Lithgow,
Mt Wilson, Mt Tomah &
Grose Valley
November Waterfall n/a 5 deaths n/a
1980
1982–83 Blue Mountains, 60,000 ha 3 deaths n/a
Sutherland & Southern
NSW
1984–85 Western Division 3,500,000 ha. 40,000 stock 5 deaths $179m
1986 Mt Kaputar National Park 10,000 ha 0 deaths n/a
1987–88 Bethungra, Warurillah/ 180,000 ha 4 deaths. n/a
Yanco, Kosciusko, 20 injured
Sutherland & Penrith
1990–91 Baulkham Hills, Gosford, 14 houses destroyed 2 deaths $54m
Wyong & Lake Macquarie
1993–94 North coast, Hunter, > 800,000 ha. 206 houses 4 deaths $215m
South coast, Blue destroyed.
Mountains & Sydney
Page 22 Climatecouncil.org.auDate Location Area/Property Damage Deaths Normalised
/Injured Cost ($2011
AUD)
1997–98 Burragorang, Pilliga, > 500,000 ha. 10 houses 4 deaths $8m
Hawkesbury, Hunter, destroyed
Shoalhaven, Central
Coast & Menai
June 2000 Mt Ku-ring-gai n/a 4 deaths. 3 n/a
injured
2001–02 44 LGAs in Greater 744,000 ha. 109 houses 0 deaths $131m
Sydney, Hunter, North destroyed. 40 houses
Coast, Mid North Coast, damaged.
Northern
6,000 stock
Tablelands & Central
Tablelands
2002–03 81 LGAs in Greater 1,464,000 ha. 86 houses 3 deaths $43m (October
Sydney, Hunter, destroyed. 11 houses 2002 fires)
North Coast, Northern damaged.
Tablelands,
3,400 stock.
Northern Rivers, north-
west slopes, north-
west plains, Central
Tablelands, Southern
Tablelands, Illawarra &
South Coast
January Coonabarabran, Yass, 650,000 ha. 57 houses 0 deaths. 1 n/a
2013 Cooma, Shoalhaven, destroyed. 22 houses injured
Jugiong & Gundaroo damaged. 14,500 stock.
October Blue Mountains, 118,000 ha. 222 houses 2 deaths $183.4m (early
2013 Port Stephens, Lake destroyed. 168 houses figures)
Munmorah, Hunter, damaged
Hawkesbury,
Central Coast & Southern
Highlands
Source: NSW Parliamentary Research Service (PRS) (2014)
Climatecouncil.org.au Page 23Be Prepared: Climate change and the NSW bushfire threat
References
ABC News (14 November 2013) Tourism losses hit Bernstein AS and Rice MB (2013) Lungs in a
$30m after Blue Mountains bushfires. Accessed warming world: climate change and respiratory
at http://www.abc.net.au/news/2013-11-14/ health. CHEST Journal 143:1455–59.
tourism-losses-hit-2430m-after-blue-mountains-
Beyond Blue (2013a) Information for people
bushfires/5090840. Sarah Hawke.
living in bushfire affected areas. Accessed at
ABS (Australian Bureau of Statistics) (2013a) http://www.beyondblue.org.au/about-us/news/
New South Wales: Population Size. Accessed news/2013/10/23/nsw-bushfire-victims-can-use-
at http://www.abs.gov.au/ausstats/abs@.nsf/ beyondblue-resources.
Lookup/3222.0main+features72012%20(base)%20
Beyond Blue (2013b) Bushfire affected Australians
to%202101.
urged to go online for help. Accessed at http://
ABS (2013b) Australian Demographic Statistics: www.beyondblue.org.au/media/media-releases/
December key figures. Accessed at http://www.abs. media-releases/bushfire-affected-australians-
gov.au/ausstats/abs@.nsf/mf/3101.0/. urged-to-go-online-for-help.
Adams, M (2013) Mega-fires, tipping points BoM (Bureau of Meteorology) (2013a) Data source:
and ecosystem services: managing forests and BoM ACORN-SAT station data and network
woodlands in an uncertain future. Forest Ecology maximum temperature data. Accessed at: http://
and Management 294: 250–261. www.bom.gov.au/climate/change/acorn-
sat/#tabs=Data-&-network.
AFAC (Australasian Fire and Emergency Services
Council) (2009) Climate Change and the Fire BoM (2013b) Australian climate variability and
and Emergency Services Sector. Position paper change—Time series: Annual mean temperature
prepared for the Australasian Fire and Emergency anomaly—Australia (1910–2012). Accessed at
Service Authorities Council. Accessed at: http:// http://www.bom.gov.au/climate/change/index.
www.afac.com.au/positions/Climate_Change_ shtml#tabs=Tracker&tracker=timeseries.
and_the_Fire_and_Emergency_Services_Sector.
BoM (2014a) Rainfall deficiencies map: 9 months
AFAC (Australasian Fire and Emergency Services 1 December 2013 to 31 August 2014. Accessed at
Council) (2010) Climate Change and the Fire and http://www.bom.gov.au/climate/drought/
Emergency Services Sector. Discussion paper archive/20140905.1.col.gif.
prepared for the Australasian Fire and Emergency
BoM (2014b) Climate outlook for October to
Service Authorities Council. Accessed 10.11.13 at
December: a dry forecast for parts of the east
http://www.afac.com.au/positions/Climate_Change_
and northwest. Accessed at http://www.bom.
and_the_Fire_and_Emergency_Services_Sector.
gov.au/climate/ahead/archive/outlooks/latest-
Aiken CM, Santoso A, McGregor S and England MH outlook.shtml.
(2013) The 1970’s shift in ENSO dynamics: A linear
BoM (2014c). Annual climate statement 2013 (issued
inverse model perspective. Geophysical Research
Friday 3 January 2014). Accessed at http://www.
Letters 40: 1612–1617.
bom.gov.au/climate/current/annual/aus/2013.
Altangerel K, Kull CA (2013) The prescribed burning
BoM (2014d). Annual mean temperature anomaly:
debate in Australia: conflicts and compatibilities.
New South Wales. Accessed at http://www.bom.
Journal of Environmental Planning and
gov.au/climate/change/index.shtml#tabs=Tracker
Management 56:103–120.
&tracker=timeseries&tQ%5Bgraph%5D=tmean&tQ%
Australian Emergency Management (AEM) (2013) 5Barea%5D=nsw&tQ%5Bseason%5D=0112&tQ%5Ba
Environmental—Bushfire Pollution, Sydney 2013. ve_yr%5D=T.
Accessed at https://www.emknowledge.gov.au/
Bowman DMJS, Murphy BP, Burrows GE and
resource/?id=4470.
Crisp MD (2012) Fire regimes and the evolution of
Beer T, Gill AM and Moore RHR (1988) Australian the Austrlaian biota. In Flammable Australia: Fire
bushfire danger under changing climatic regimes. regimes, biodiversity and ecosystems in a changing
In Pearman GI (ed.), Greenhouse: Planning for world. Bradstock RA, Gill AM, Williams RJ (eds),
Climatic Change 29:169–188. CSIRO Publishing, Collingwood, VIC, pp 27–48.
Beer T and Williams A (1995) Estimating Australian Bradstock RA (2008) Effects of large fires on
forest fire danger under conditions of doubled biodiversity in south-eastern Australia: disaster
carbon dioxide concentrations. Climatic Change or template for diversity? International Journal
29: 169–188. of Wildland Fire 17:809–822.
Page 24 Climatecouncil.org.auBradstock RA, Cohen JS, Gill AM, Bedward M and Clarke H, Smith PL and Pitman AJ (2011) Regional
Lucas C (2009) Prediction of the probability of signatures of future fire weather over eastern
large fires in the Sydney region of south-eastern Australia from global climate models. International
Australia using fire weather. International Journal Journal of Wildland Fire 20: 550–562.
of Wildland Fire 18: 932–943.
Clarke H, Lucas C and Smith P (2013) Changes in
Bradstock RA, Boer MM, Cary GJ, Price, OF, Australian fire weather between 1973 and 2010.
Williams RJ, Barrett DJ, Cook G, Gill AM, Hutley International Journal of Climatology 33: 931–944.
LBW, Keith H, Maier S W, Meyer M, Roxburgh
Climate Commission (2013) The Critical Decade:
SH and Russell-Smith J (2012) Modelling the
Extreme Weather. Hughes L, Steffen W.
potential for prescribed burning to mitigate carbon
emissions from wildfires in fire-prone forests of Climate Council (2014a) Off the Charts: 2013 was
Australia. International Journal of Wildland Fire Australia’s hottest year on record. Steffen W.
21:629–639.
Climate Council (2014b) The Angry Summer
Bushfire CRC (2013) Southern Australia seasonal 2013/2014. Steffen W.
bushfire outlook 2013–14. Fire Note Issue 116.
September 2013. Climate Council (2014c) Heatwaves: hotter, longer,
more often. Steffen W, Hughes L and Perkins S.
Bushfires and Natural Hazards Cooperative
Research Centre (Bushfires and Natural Hazards Climate Council (2014d) Be Prepared: climate
CRC) (2014). Accessed at http://www.bnhcrc.com. change and the Australian bushfire threat.
au/news/2014/southern-australia-seasonal- Hughes L, Steffen W.
bushfire-outlook-2014-15. Cook B, Mitchell W (2013) Occupational health
Buxton M, Haynes R, Mercer D and Butt A (2011) effects for firefighters: the extent and implications
Vulnerability to bushfire risk at Melbourne’s urban of physical and psychological injuries. Report
fringe: The failure of regulatory land use planning. prepared for the United Firefighters Union of
Geographical Research 49: 1–12. Australia, Centre of Full Employment and Equity.
Accessed a https://www.firecrisis.com.au/wp-
Cameron PA, Mitra B, Fitzgerald M, Scheinkestel content/uploads/2013/02/CofFEE-report-Final.pdf.
CD, Stripp A, Batey C, Niggemeyer L, Truesdale
M, Holman P, Mehra R, Wasiak J and Cleland H Crisp MD, Burrows GE, Cook LG, Thornhill
(2009) Black Saturday: the immediate impact of AH and Bowman DMJS (2011) Flammable
the February 2009 bushfires in Victoria, Australia. biomes dominated by eucalypts originated at
Medical Journal of Australia 191: 11–16. the Cretaceous-Palaeogene boundary. Nature
Communications 2: 1–8.
Cary GJ and Banks JCG (2000) Fire regime
sensitivity to global climate change: an Australian CSIRO and BoM (2014) State of the Climate 2014.
perspective. In Advances in Global Change CSIRO and Bureau of Meteorology, Melbourne.
Research, Innes JL, Verstraete MM, Beniston M Deloitte Access Economics (2014) Scoping study
(eds), Kluwer Academic Publishers, Drrecht and on a cost benefit analysis of bushfire mitigation.
Boston. Australia Forest Products Association. Accessed at
Cary GJ (2002) Importance of a changing climate http://www.ausfpa.com.au/wp-content/uploads/
for fire regimes in Australia. In Flammable Australia: AFPA-DAE-report-Amended-Final-2014-05-27.pdf.
The Fire Regimes and Biodiversity of a Continent, Dennekamp M and Abramson MJ (2011) The
Bradstock RA, Gill AM and Williams JE (eds), effects of bushfire smoke on respiratory health.
Cambridge University Press, Cambridge, pp 26–46. Respirology 16: 198–209.
Cary GJ, Bradstock RA, Gill AM and Williams RJ Handmer J, Mckellar R, McLennan B, Whittaker J,
(2012) Global change and fire regimes in Australia Towers B, Duggie J and Woolf M (2012) National
pp 149–170 in Flammable Australia: Fire regimes, Climate Change Adaptation Research Plan:
biodiversity and ecosystems in a changing world. Emergency Management—Revised 2012 Edition,
(Eds Bradstock RA, Gill AM, Williams RJ). CSIRO National Climate Change Adaptation Research
Publishing, Collingwood, VIC. Facility, Gold Coast, 60pp.
Chen K and McAneney J (2010) Bushfire Harris S, Nicholls N and Tapper N (2013)
Penetration into Urban Areas in Australia: A Spatial Forecasting fire activity in Victoria, Australia, using
Analysis. Report for the Bushfire CRC Accessed at: antecedent climate variables and ENSO indices.
http://www.bushfirecrc.com/managed/resource/ International Journal of Wildland Fire http://dx.doi.
bushfire_penetration_into_urban_areas_in_ org/10.1071/WF13024.
australia_crc-304-001-0001.pdf.
Hasson AEA, Mills GA, Timbal B and Walsh K (2009)
Chen K (2005) Counting bushfire-prone addressed Assessing the impact of climate change on extreme
in the Greater Sydney Region. Proceedings of the fire weather even over southeastern Australia.
Symposium on Planning for Natural Hazards— Climate Research 39: 159–172.
how can we mitigate these impacts? University of
Wollongong. Accessed at http://www.riskfrontiers. Hennessy KJ (2007) Fire Weather. In Climate change
com/publications/FireAUS_NSW_paper.pdf. in Australia: technical report 2007, Pearce KB, Holper
PN, Hopkins M, Bouma WJ, Whetton PH, Hennessy
KJ, Power SB (eds), CSIRO Marine and Atmospheric
Research, Aspendale, Victoria, pp 90–91.
Climatecouncil.org.au Page 25Be Prepared: Climate change and the NSW bushfire threat
IPCC (Intergovernmental Panel on Climate Matthews S, Sullivan AL, Watson P and Williams RJ
Change) (2012) Managing the Risks of Extreme (2012) Climate Change, fuel and fire behaviour in
Events and Disasters to Advance Climate Change a eucalypt forest. Global Change Biology 18:
Adaptation. A Special Report of Working Groups I 3212–3223.
and II of the Intergovernmental Panel on Climate
McFarlane AC and Raphael B (1984) Ash
Change. Field CB, Barros V, Stocker TF, Qin D,
Wednesday: the effect of a fire. Australian and
Dokken DJ, Ebi KL, Mastrandrea.
New Zealand Journal of Psychiatry 18: 341–51.
IPCC (2013) Climate Change 2013: The Physical
McAneney J (2013) Climate change and bushfires:
Science Basis. Working Group I Contribution to
you’re missing the point! Accessed at: http://
the IPCC 5th Assessment Report—Changes to
theconversation.com/climate-change-and-
the underlying Scientific/Technical Assessment.
bushfires-youre-missing-the-point-19649.
Accessed at http://www.ipcc.ch/report/ar5/wg1/.
McFarlane AC (1988) The longitudinal course of
IPCC (2014) Climate Change 2014:Impacts,
post-traumatic morbidity: the range of outcomes
adaptation, and vulnerability. Working Group II
and their predictors. Journal of Nervous and Mental
Contribution to the IPCC 5th Assessment Report.
Diseases 176: 30–9.
Chapter 25: Australasia. Accessed at http://ipcc-
wg2.gov/AR5/images/uploads/WGIIAR5-Chap25_ Morgan G, Sheppeard V, Khalaj B, Ayyar A,
FGDall.pdf. Lincoln D, Jalaludin B, Beard J, Corbett S and
Lumley T (2010) The effects of bushfire smoke
Jayaratne R and Kuleshov E (2006) The relationship
on daily mortality and hospital admissions in
between lightning activity and surface wet bulb
Sydney, Australia, 1994 to 2002. Epidemiology
temperature and its variation with latitude in
21: 47–55.
Australia. Meteorology and Atmospheric Physics
91:17–24. Nepean-Blue Mountains Medicare Local (NBMML)
(2014) Extreme Climatic Events: bushfire program:
Johnston FH, Hanigan IC, Henderson SB, Morgan
Nepean-Blue Mountains. Accessed at http://www.
GG and Bowman DMJS (2011) Extreme air pollution
nbmml.com.au/General-Practice/Programs-
events from bushfires and dust storms and their
Services/Mental-Health/Mental-Health-programs-
association with mortality in Sydney, Australia
ATAPS/Referring-to-ATAPS-Bushfire.aspx.
1994–2007. Environmental Research 111: 811–16.
NIEIR (2013) Firefighters and climate change: The
Jiranek V (2011) Smoke taint compounds in wine:
human resources dimension of adapting to climate
nature, origin, measurement and amelioration of
change. Final and consolidated report prepared by
affected wines. Australian Journal Grape and Wine
the National Institute of Economic and Industry
Research. 17 (2).
Research for the United Firefighters Union of
King D, Ginger J, Williams S, Cottrell A, Gurtner Australia. Submission to the Senate Standing
Y, Leitch C, Henderson D, Jayasinghe N, Kim Committee on Environment and Communications’
P, Booth K, Ewin C, Innes K, Jacobs K, Jago- Inquiry into recent trends and preparedness for
Bassingthwaighte M and Jackson L (2013) extreme weather events. February 2013.
Planning, building and insuring: Adaptation of built
NSW Government (2014) Preparation and Hazard
environment to climate change induced increased
Reduction. Department of Environment and
intensity of natural hazards. National Climate
Heritage. Accessed at http://www.environment.
Change Adaptation Research Facility, Gold Coast,
nsw.gov.au/fire/prepandhazreduction.htm.
361 pp.
NSW Rural Fire Service (NSW RFS) (2014) NSW
Lucas C (2005) Fire weather history of
RFS declares early start to bush fire season in
south-east Australia. (Bushfire CRC) Accessed
additional LGAs. Accessed at http://www.rfs.nsw.
at http://www.bushfirecrc.com/managed/
gov.au/news-and-media/media-releases/nsw-
resource/fireweatherhistory.pdf.
rfs-declares-early-start-to-bush-fire-season-in-
Lucas C, Hennessy K, Mills G and Bathols J additional-lgas.
(2007). Bushfire weather in southeast Australia:
NSW Parliamentary Research Service (NSW PRS)
recent trends and projected climate change
(2014) Bushfires in NSW: timelines and key sources.
impacts. Bushfire CRC and Australian Bureau of
Accessed at https://www.parliament.nsw.gov.au/
Meteorology. September 2007, Consultancy Report
prod/parlment/publications.nsf/key/Bushfiresin
prepared for the Climate Institute of Australia.
NSW:timelinesandkeysources/$File/Bushfires%20
Luke RH and McArthur AG (1978) Bushfires in in%20NSW%20-%20timelines%20and%20key%20
Australia. Australian Government Publishing sources.pdf.
Service, Canberra.
O’Neill SJ and Handmer J (2012) Responding
Martin, KL, Hanigan IC, Morgan GG, Henderson to bushfire risk: the need for transformative
SB and Johnston FH (2007). Air pollution from adaptation. Environmental Research Letters 7:
bushfires and their association with hospital 014018.
admissions in Sydney, Newcastle and Wollongong,
Penman TD, Bradstock RA and Price O (2013)
Australia 1994–2007. Australian and New Zealand
Modelling the implications of ignition in the
Journal of Public Health, 37 (3): 238–243.
Sydney Basin, Australia: implications for future
management. International Journal of Wildland
Fire 22: 469–478.
Page 26 Climatecouncil.org.auYou can also read