PEOPLE'S REPUBLIC OF CHINA- HONG KONG SPECIAL ADMINISTRATIVE REGION
←
→
Page content transcription
If your browser does not render page correctly, please read the page content below

IMF Country Report No. 19/21

 PEOPLE’S REPUBLIC OF CHINA––
 HONG KONG SPECIAL
 ADMINISTRATIVE REGION
 SELECTED ISSUES
January 2019
 This Selected Issues paper on the People’s Republic of China was prepared by a staff
 team of the International Monetary Fund. It is based on the information available at the
 time it was completed on December 20, 2018.

 Copies of this report are available to the public from

 International Monetary Fund • Publication Services
 PO Box 92780 • Washington, D.C. 20090
 Telephone: (202) 623-7430 • Fax: (202) 623-7201
 E-mail: publications@imf.org Web: http://www.imf.org
 Price: $18.00 per printed copy

 International Monetary Fund
 Washington, D.C.

 © 2019 International Monetary Fund
PEOPLE'S REPUBLIC OF
 CHINA—HONG KONG SPECIAL
 ADMINISTRATIVE REGION
 SELECTED ISSUES
December 20, 2018

 Approved By Prepared By Emilia Jurzyk, Rui Mano, and Ananya Shukla (all
 Asia and Pacific APD), Sally Chen (Resident Representative Office, MCM),
 Department Alexander Klemm, Sebastian Beer (both FAD), and Sheheryar
 Malik (MCM).

 CONTENTS

 INCOME INEQUALITY IN HONG KONG SAR __________________________________________ 3
 A. Background ___________________________________________________________________________ 3
 B. Empirical Analysis _____________________________________________________________________ 7
 C. Policy Recommendations ____________________________________________________________ 12
 References ______________________________________________________________________________ 16

 TABLES
 1. Panel Regression Estimates of the Drivers of Inequality ______________________________ 14
 2. Summary Results from Literature on Growth and Inequality _________________________ 15

 FINANCIAL CONDITIONS AND GROWTH-AT-RISK IN HONG KONG SAR __________ 18
 References ______________________________________________________________________________ 23

 TABLE
 1. Underlying FCI Variables by Category ________________________________________________ 18

 FIGURE
 1. Changes in Financial Conditions Affect Growth Risks ________________________________ 21
PEOPLE’S REPUBLIC OF CHINA—HONG KONG SAR

 APPENDIX
 I. Estimation of the Conditional Quantiles ______________________________________________ 24

 POSSIBLE SPILLOVERS FROM INTERNATIONAL TAX REFORMS ____________________ 27
 A. The 2018 U.S. Tax Reform and Other Recent Reforms _______________________________ 27
 B. Impact on Hong Kong SAR from U.S. Tax Rate Cut___________________________________ 28
 C. Impact from Other Reforms __________________________________________________________ 30
 D. Conclusions __________________________________________________________________________ 30
 References ______________________________________________________________________________ 31

2 INTERNATIONAL MONETARY FUND
PEOPLE’S REPUBLIC OF CHINA—HONG KONG SAR

INCOME INEQUALITY IN HONG KONG SAR 1

Income inequality in Hong Kong SAR remains high, despite declining recently. Redistributive
policies implemented by the authorities have helped to lower income inequality. But inequality is
likely to rise in the medium-term due to aging and thus more needs to be done. A package of
policies could lower the Gini index by 3-4 points by 2050 including: more progressive salaries tax;
higher reliance on recurrent property taxes; and increased public expenditure on social welfare,
health, housing, education and child care. According to recent evidence in the literature, these
policies could also boost growth by 0.2-0.5 percentage points per year.

A. Background

 Income inequality in Hong Kong SAR remains high, both historically but also
compared to other economies. The market Gini coefficient, which measures household income
inequality prior to taxes and transfers, stood at 49.9 in 2016, while the net Gini coefficient, reflecting
the impact of redistributive policies in the form of taxes and transfers, stood at 42. Both coefficients
declined compared to the 2011 level, indicating a small reduction in income inequality. Comparison
with other economies indicates that inequality in Hong Kong SAR is relatively high, even when
measured post taxes and transfers, and it appears higher than in most other cities with large
financial centers. That said, the data shows that the increase since 1990 has not been as high as in
Mainland China, the U.S. or other advanced economies, both in Asia and elsewhere. 2 3

 Evolution of Gini Coefficients in Hong Kong SAR 1/ Levels and Trends in Income Inequality Across Countries
 (Per Capita Gini; Index) (Per Capita Gini; Net Gini Coefficient)
 45 8
 55 40
 SWIID Market Gini 6
 35
 SWIID Net Gini
 50 30
 Official Market Gini 4
 25
 Official Net Gini
 45 20
 2
 15 Difference 1990-2016 (RHS)
 2016 Level
 40 10 0
 5
 35 0 -2
 1964 1968 1972 1976 1980 1984 1988 1992 1996 2000 2004 2008 2012 2016 UK ASEAN EM SGP HKG OECD Indust. US China
 Source: SWIID 7.1; Hong Kong SAR C&SD; and IMF staff calculations. Asia SAR Asia
 Note:1/ Inequality measured by Gini coefficients. Shaded area represents the degree of
 redistribution. Sources: SWIID 7.1 and IMF staff estimates.

1
 Prepared by Emilia Jurzyk, Rui C. Mano, and Ananya Shukla.
2
 See Box 2 in People’s Republic of China—Hong Kong SAR 2016 Article IV Staff Report on discussion of difficulties in
comparing Gini coefficients across countries and data sources.
3
 Levels of market and net Gini coefficients used in this paper for Hong Kong SAR differ, as some of the coefficients
have been taken from the Hong Kong SAR Census and Statistics Department and from the Standardized World
Income Inequality Database on per capita basis, while others are reported on a household level basis (also from the
Hong Kong SAR Census and Statistics Department). The narrative, however, remains unchanged.

 INTERNATIONAL MONETARY FUND 3
PEOPLE’S REPUBLIC OF CHINA—HONG KONG SAR

 Gini coefficients and degree of redistribution Market Gini Index: Hong Kong SAR and Other
 (Per Capita Gini; Percentage points) Cities with Sizable Financial Industry
 55 (Household Gini; Percentage points)
 Greater London (2011)
 50
 New York Metro Area (2017)
 45 Chicago Metro Area (2017)
 Boston Metro Area (2017)
 40 Luxembourg (2013)
 Greater Tokyo (2009) 1/
 35
 Washington Metro Area (2017)
 GINI: disposable income
 30 Zurich (2010)
 GINI: market income Singapore (2017) 2/
 25
 Redistribution
 Hong Kong, SAR (2016)
 20
 ASEAN EM Asia SGP HKG China Indust. OECD US UK 0 20 40 60
 SAR Asia Sources: U.S. Census, Statistics Singapore, HKSAR C&SD, OECD.
 1/ Southern Kanto region; 2/ Singapore's Gini coefficient is reported based on household income from work
 Sources: SWIID 7.1 and IMF staff estimates. per household member.

 Government policies are helping counteract the effects of rising inequality. Between
1996 and 2016, market per capita Gini rose by 0.6 points but the net Gini actually declined by
0.6 points, indicating a rising degree of redistribution due to government policies, measured as the
difference between the two Gini indices. A similar picture emerges when looking at the long-term
trends in the Standardized World Income Inequality Database (SWIID): between 1964 and 2016, the
degree of redistribution increased from 3.4 Gini points to 4.6 Gini points. Redistribution in Hong
Kong SAR is also higher than in many other economies in Asia, though significantly below levels
observed in other advanced economies.

 The authorities put in place policies to help Household post-tax and transfer income to original income
 (Percent, per income decile)
those at the bottom of the income distribution. 250%

Progressive taxation rates, a statutory minimum wage
 200% 2006 2016
introduced in 2011 and increased since, various family and
old age allowances, which have been reformed in 2017 150%

and 2018 to further enhance the retirement protection 100%
system and social security coverage of working families,
transportation subsidies, as well as housing, education, 50%

and health benefits, helped counteract income inequality. 0%

These policies in total appear to be progressive: when 1st 2nd 3rd 4th 5th 6th 7th 8th 9th 10th
 Source: Hong Kong SAR 2016 Household Survey.
comparing household income post taxes and social
 Average growth rate of real household income 1/
transfers, households in the lowest decile of the income (Percent)

distribution receive close to 125 percent of their original 25

 2006-11 2011-16
income in additional transfers, while net income of 20

households in the highest decile decreases by around 15

10 percent. 10

 …and rising incomes have helped. Since 2006, the 5

average real median household income increased on 0
 1st-2nd decile 3rd-8th decile 9th-10th decile
average by almost 24 percent in the lowest two income Sources: Table 2.3, 2016 Hong Kong SAR Household Survey and IMF staff estimates.

deciles. That increase is almost twice as high as for the rest
 Note: 1/Median monthly income from main employment at constant prices by decile group of
 working population.

4 INTERNATIONAL MONETARY FUND
PEOPLE’S REPUBLIC OF CHINA—HONG KONG SAR

of Hong Kong SAR’s population, where the cumulative real growth—while still significant—did not
exceed 10 percent.

 Domestic housing affordability indicators Distribution of benefits by household income quintile
 (Q1 2004 = 100) (Percent)
 400 35%
 Rents Lowest quintile
 350 30%
 Wages
 300 House prices Highest quintile
 25%
 250 Mortgage payment to income ratio
 20%
 200
 15%
 150
 10%
 100

 50 5%

 0 0%
 2006 2011 2016 2006 2011 2016 2006 2011 2016
 Mar-09

 Mar-10

 Mar-11

 Mar-12

 Mar-13

 Mar-14

 Mar-15

 Mar-16

 Mar-17

 Mar-18
 Sep-09

 Sep-10

 Sep-11

 Sep-12

 Sep-13

 Sep-14

 Sep-15

 Sep-16

 Sep-17
 Educational Housing Medical
 Sources: Haver and IMF staff estimates. Sources: Hong Kong SAR C&SD and IMF staff estimates.

 …but problems remain. Levels of inequality in Hong Kong SAR remain high, both by
historical standards and by international comparison. Over 10 percent of the population lives in
poverty (with the poverty line defined as half of the median income for a given household size)—
even after the policy measures—and this ratio has increased since 2014. Sharply rising house prices,
which outpaced wage growth, put private housing out of reach for a significant share of the
population; consequently, around 30 percent of all Poverty rates
households live in public rental housing, where the (Percent)
 25
 After policy intervention (recurrent cash and in kind)
average wait time has increased from 1.8 years for Before policy intervention
 20
family applicants and 1.1 years for the elderly in 2008,
to 5.5 years and 2.9 years, respectively, in September 15

2018, and additional 15 percent of households live in 10

subsidized sale flats. The share of housing benefits 5
going to households in the lowest income quintile
has been falling while the share of government
 0
 2009 2010 2011 2012 2013 2014 2015 2016

spending dedicated to housing has remained steady, Sources: Hong Kong SAR C&SD and IMF staff estimates.

at around 1.1 percent of GDP since 2005.

 Looking at equality of opportunities, Hong Kong SAR compares well on many of the
indicators, though pockets of inequality remain. Over 95 percent of the population have access
to financial services; adult literacy rates, as well as secondary and primary school enrollment are very
high and similar to other advanced economies, while on PISA scores Hong Kong SAR surpasses its
peers. However, achievement differentials do exist between children based on their family’s income,
and between children who do and do not speak Chinese at home (with non-Chinese speaking
children considered to be at a disadvantage), indicating that more resources might be needed to
address these challenges.

 INTERNATIONAL MONETARY FUND 5
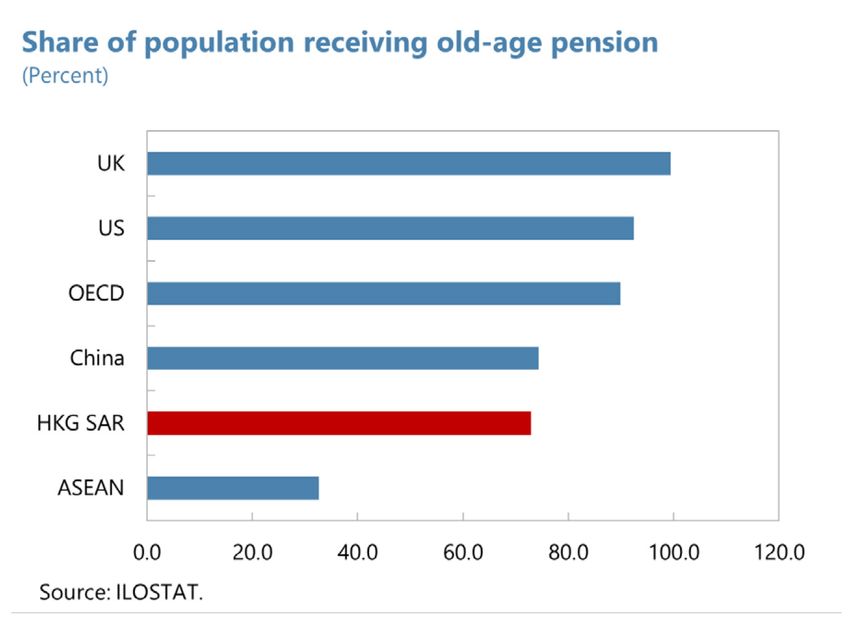
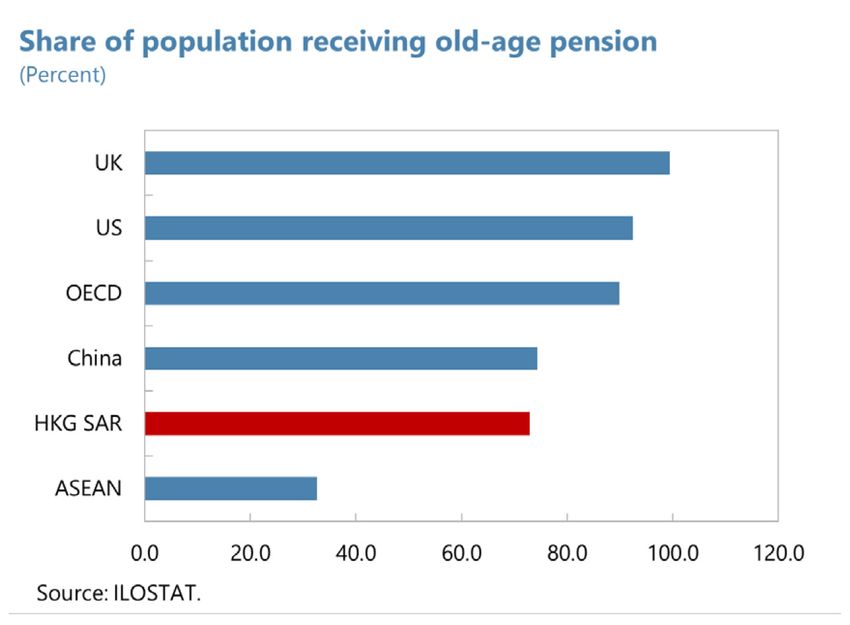
PEOPLE’S REPUBLIC OF CHINA—HONG KONG SAR

 Education Indicators Gaps in Learning Achievement 1/
 (Latest value available) (TIMSS 2015, 4th level, difference in percentage points)
 Hong Kong SAR ASEAN AEs OECD 35
 120 540
 30 Wealth Gap Language Gap
 100 520 25
 20
 80 500
 15
 60 480 10
 5
 40 460
 0
 20 440 Mathematics Mathematics Science (primary) Science (lower
 (primary) (lower secondary) secondary)

 0 420 Sources: World Education Inequality Database; and IMF staff estimates.
 Adult literacy Net Enrollment, Net Enrollment, PISA Total (rhs) Note: 1/ Wealth gap defined as a difference between households in the
 rate primary secondary bottom 20 percent vs. top 20 percent of income distribution. Language gap:
 whether child speaks Chinese at home.
 Source: IMF FAD Expenditure Assessment Tool (EAT), World Bank.

 Levels of pension and health coverage are also high, but there is room to increase the
safety net for the elderly. While health coverage extends to the whole population and health
outcomes in Hong Kong SAR compare favorably to other advanced economies, the share of out-of-
pocket medical expenses is higher than in other advanced economies. Among the elderly, the share
receiving old-age pension is lower than in other advanced economies (though it is important to
note that over 70 percent of Hong Kong SAR’s population aged 65 and above receive social security,
and the share rises to 87 percent for those over 70) and close to 40 percent of elderly households
live in poverty.
 Health and Health System Characteristics Indicators Poverty rates among elderly households
 (Latest value available) (Percent)
 Hong Kong SAR ASEAN AEs OECD 80
 100 11
 90 10
 80 9
 60
 Numbers

 8
 Numbers

 70
 7 After policy intervention
 60
 6
 50 Before policy intervention
 5 40
 40
 4
 30 3
 20 2
 10 1 20
 0 0
 Number of Life expectancy Hospital beds, Nurses and Physicians, per
 infant deaths, at birth per 1,000 midwives, per 1,000 people
 per 1,000 people (rhs) 1,000 people (rhs)
 0
 people (rhs) 2009 2010 2011 2012 2013 2014 2015 2016

 Source: IMF FAD Expenditure Assessment Tool (EAT), World Bank, World Health Organization. Sources: Hong Kong SAR C&SD and IMF staff estimates.

 Health and Health System Characteristics Indicators
 (Latest value available)
 Hong Kong SAR ASEAN AEs OECD
 100 11
 90 10
 80 9
 Numbers

 8
 Numbers

 70
 7
 60
 6
 50
 5
 40
 4
 30 3
 20 2
 10 1
 0 0
 Number of Life expectancy Hospital beds, Nurses and Physicians, per
 infant deaths, at birth per 1,000 midwives, per 1,000 people
 per 1,000 people (rhs) 1,000 people (rhs)
 people (rhs)

 Source: IMF FAD Expenditure Assessment Tool (EAT), World Bank, World Health Organization.

6 INTERNATIONAL MONETARY FUND
PEOPLE’S REPUBLIC OF CHINA—HONG KONG SAR

B. Empirical Analysis

In the years to come, aging is projected to push inequality up. More active government policies,
including increased tax progressivity, higher public spending on transfers, health and social
welfare, and public housing provision could reduce the Gini index by 3½ points by 2050. At the
same time, growth does not need to be lower. Based on the empirical relationship between
growth and inequality established in the literature, growth could be boosted by
0.2-0.5 percentage points on average per year if these active policies are implemented.

 In this section, we estimate the link between inequality and its drivers, and project
such drivers to create two forward-looking scenarios for inequality in Hong Kong SAR.

 Health coverage
 (Percent)
 Out-of-pocket medical expenses (as percent of total)

 Health coverage (share of population)
 100

 80

 60

 40

 20

 0
 ASEAN US China OECD HKG SAR UK SGP
 Sources: ILOSTAT, and IMF staff estimates.

Using the same setting as Jain-Chandra and others (2018) (JC et al) and extending the data to
include Hong Kong SAR, we first document the main drivers of inequality in 1992-2010 splitting
them into structural and policy variables. We then formulate a baseline scenario in which structural
variables are projected forward and policies respond only passively. In addition, an “active policy”
scenario is formulated and its impact on inequality assessed. Finally, estimates from the literature on
the link between inequality and growth are used to generate a range of impacts of such “active
policies” on growth.

 We estimate the drivers of inequality using the approach in Jain-Chandra and others,
2018. Concretely, we estimate a fixed-effects panel regression that spans 1980-2010 and 29
economies, including Hong Kong SAR. The inclusion of Hong Kong SAR is the only difference to the
analysis in JC et al.

 Drivers can be divided into two groups: structural factors and policies. 4

• Structural factors: (i) urbanization measured by the share of the population living in urban areas;
 (ii) aging as represented by the Higgins (1998) polynomial; (iii) sectoral change as measured by

4
 A thorough discussion of each of these variables and the literature on their connection to inequality can be found
in JC et al.

 INTERNATIONAL MONETARY FUND 7
PEOPLE’S REPUBLIC OF CHINA—HONG KONG SAR

 the share of employment in the services and industry sector; and (iv) educational levels
 measured by the share of the population with higher education.

• Policies: (i) individual income tax revenue; (ii) property tax revenue; (iii) public spending on
 health; (iv) public spending on social protection; and (v) overall redistribution as proxied by the
 difference between the Gini index before (market Gini) and after transfers and taxes (net Gini).
 Policies (i)-(iv) are measured as a share of GDP. The inclusion of the two types of taxes is due to
 their progressive nature, either relying on progressive scales (individual income tax more often
 than property taxes) or falling disproportionately on high-income/wealth households.

 Including Hong Kong SAR in the empirical analysis retains all of the main conclusions
of JC et al (see Table 1). 5 Given that HKSAR is an outlier in many dimensions (being a major
financial center) and is often hard to treat in a panel setting, the fact that results are broadly
consistent between JC et al (column 1 of Table 1) and those here (column 2 of Table 1) is reassuring.
There are some differences though that are worth outlining. Estimates for structural variables are
very comparable, except those pertaining to the industry share in employment which are somewhat
weaker but still significant at 5 percent level and with the same sign. However, the joint impact of
the two industry share variables (linear and quadratic terms) are similar across the two specifications,
because both terms are smaller in absolute terms in column (2) compared to (1) while still having
opposite signs. Employment in services was barely significant in (1) and is now insignificant. Results
for structural variables are intuitive and consistent with the literature. Within the policy variables, the
main difference is a slightly higher coefficient on individual income tax which is now marginally
significant. Other policies are very comparable across columns (1) and (2). In general, higher
spending on health and social protection, more redistribution and higher tax revenues on properties
and individual income taxes all lower inequality as measured by the Gini after transfers and taxes.

 Having established an empirical link between inequality and its drivers, we project
structural variables and passive policies forward to forecast inequality under a “Baseline
Scenario”. Structural variables are easier to Net Gini: Hong Kong SAR
predict. Population trends are taken from the UN’s
 (Baseline versus Active Policies Scenarios)
 50

medium-variant population projections, urbanization 45
and sectoral variables are held constant given full
 40
 35

urbanization and preponderance of services in Hong 30
 25
Kong SAR. Educational attainment is also held 20

constant. 6 As for policies, two are held constant for 15
 10
lack of specific policy intentions in these areas 5 Data Baseline Scenario Active Policies Scenario

(redistribution and individual income tax), but the 0
 1992
 1995
 1998
 2001
 2004
 2007
 2010
 2013
 2016
 2019
 2022
 2025
 2028
 2031
 2034
 2037
 2040
 2043
 2046
 2049

other three are allowed to adjust passively to
 Sources: SWIID 7.1 and IMF Staff Estimates.

5
 We found significant differences between SWIID based inequality data and official sourced data for HKSAR. We
decided to take the latter for this study, while maintaining the dataset in JC et al for all other countries which was
based on SWIID data.
6
 Underlying these assumptions is the idea that education, urbanization and sectoral compositions are close to their
long-run steady-state levels while ageing is not.

8 INTERNATIONAL MONETARY FUND
PEOPLE’S REPUBLIC OF CHINA—HONG KONG SAR

projected changes in conditions, most importantly demographics. For the two expenditure variables,
we use the projections in Mano (2017) that build on Clements and others (2015), Clements and
others (2013) and IMF (2017), and essentially assume that the demographic structure drives the path
of public expenditures on health and social protection. Property tax revenues are assumed to
decline to the level consistent with a zero house price gap by 2030, analogous to analysis in Mano
(2017) applied to property tax revenues rather than to headline fiscal revenues. 7

 Under the Baseline Scenario, inequality is expected to rise further. Inequality declined
by 0.7 Gini points between 1996 and 2016. Taking our baseline projections for structural variables
and policies, the net Gini could rise by 2.6 points between 2016 and 2050. This underlines the
challenge of tackling inequality in Hong Kong SAR. Note that inequality rises despite our
assumption that public expenditure adjusts naturally to demographic trends, something that
alleviates some of the inequality generated by rapid aging.

 An “active policies” scenario is then Baseline and Alternative Scenarios
 (in percent of GDP1)
constructed. In this scenario, structural variables are 20
 18 16.7 16.7

kept unchanged from the baseline scenario, but 16
 14
 13.9 13.9

policies are adjusted to combat rising inequality. In
 12
 10 8.8 8.8
 7.9 7.9

particular, all policies except property tax revenue are
 8 6.2 6.3 6.3
 5.6
 6 4.3 4.7
 3.5
 4 2.6 2.8 2.3 2.6 2.6
assumed to converge to the mean of those in other 2
 0

financial centers 8 by 2050. This would entail a rise of
 2050 target

 2050 target

 2050 target

 2050 target

 2050 target
 Other FCs

 Other FCs

 Other FCs

 Other FCs

 Other FCs
 2017

 2050

 2017

 2050

 2016

 2050

 2017

 2050

 2017

 2050
7.7 percentage points of GDP in public social Baseline Alternative Baseline Alternative Baseline Alternative Baseline Alternative Baseline Alternative

expenditure, of 0.7 percentage points of GDP in public Public Social
 Protection
 Expenditure
 Public Health
 Expenditure
 Absolute
 Redistribution
 Property Tax Revenue Individual Income Tax
 Revenue

health expenditure, of 8.8 points in the coefficient of Sources: IMF Staff Estimates.
 Note: Except for absolute redistribution.
absolute redistribution, and of 6.2 percentage points of
 Contributions (with baseline policies)
GDP of individual income tax revenue. For property tax (Gini points)

revenue, Hong Kong SAR’s revenues under the baseline 6
 Structural Contribution Policy Contribution HKG Norm

are projected to be higher than the current average of 4 4.7 4.7
other financial centers, this despite the projected 2 2.7
 2.6

decline due to the normalization of the housing cycle. 0
 0.7

Because of its economic structure, Hong Kong SAR is -2
 -2.0 -2.1 -0.8

likely to continue to rely on property taxation over the
 -5.5
 -4
long run and thus the active policies scenario assumes -6
that recurrent property taxes are raised to partially 1996-2016 2016-2050 2016-2050

 Baseline Active Policies

 Sources: IMF Staff Estimates.

7
 This is done by estimating the historical relationship between the IMF team’s estimates of the house price gap
(which is an average over 5 different approaches) and property tax revenues between FY95/96 and FY17/18. Such an
analysis finds that the tax revenues in FY17/18 of 4.7 percent of GDP were almost 2 percentage points higher than
the level consistent with a zero house price gap (or the full period average since full-sample estimates of house price
gaps are around zero).
8
 These include Belgium, Ireland, Luxembourg, Netherlands, Singapore, and Switzerland.

 INTERNATIONAL MONETARY FUND 9
PEOPLE’S REPUBLIC OF CHINA—HONG KONG SAR

offset the loss of revenue with the eventual removal of stamp duties in the housing market as the
house price gap closes. 9

 Under “active policies”, inequality declines by 0.8 points from its 2016 level. The active
policies package prevents inequality from rising 2.6 points, and thus its effect is to lower Hong Kong
SAR’s net Gini by 3.4 points by 2050 relative to the baseline. It is instructive to decompose the
changes in net Gini in both baseline and active policies scenarios.

 Structural factors have contributed to a Contribution of Structural Trends
 (Gini points)
rise in inequality and are expected to continue Age_Contribution Sector_Contribution
 Urbanization_Contribution Education_Contribution
to pose a challenge, particularly aging. In the Structural
 5
past, the move from industry to services created 4
 4.7 0.0 4.7 0.0

some inequality and aging was not a major factor 3
 2.7
 4.7 4.7
 2
as the demographic transition was still in its 1
 3.4

inception. However, Hong Kong SAR’s population 0
 -0.6

is expected to age quickly in the medium-term -1 -0.2
 -2
and this is by far the largest challenge to 1996-2016 2016-2050 2016-2050

inequality, possibly pushing the net Gini index Baseline Active Policies

 Sources: IMF Staff Estimates.
higher by close to 5 points by 2050.

 Policies have been supportive in the Contribution of Policies
past, but if not adjusted, will lose some of their (Gini points)
 Health Social Protection Redistribution
redistributive power. In the past, larger 1
 Property tax Income tax Total

redistribution and property taxes have been 0
 0.2 0.1
 -0.9
successful in containing increases in inequality due -1 -0.1
 -0.6
 -2.1 -2.0

to structural change. But going forward, under the -2 -0.4
 -0.3
 -2.0 -2.1 -1.2
baseline scenario, policies will not be able to
 -3

 -4 -1.6
further contain rising inequality due to aging. -5
Health expenditure is assumed to increase in line -6 -5.5

with changing demographics and thus it is not
 1996-2016 2016-2050 2016-2050

 Baseline Alternative
surprising that it is the one policy that seems most Sources: IMF Staff Estimates.

effective under the baseline.

 Under the active policies scenario, all policies make a significant contribution to
reducing inequality. After the needed rise in health expenditure, the largest impact is due to higher
overall redistribution, whose contribution to lowering inequality is 1.6 Gini points compared to the
baseline. This variable is a summary statistic of all efforts to contain market-generated inequality
and is shown to be crucial in preventing the rise of inequality in the baseline. It would include all
efforts mentioned below plus those to expand public housing supply among others. Public social
protection expenditure comes second contributing 0.9 points to lowering the Gini compared to

9
 The assumed level of property tax revenue to GDP in 2050 (3.5 percent) is still lower than its current level (4.7
percent), but higher than the current average of financial centers or its “natural” level if the house price gap closes
(2.3 and 2.8, respectively).

10 INTERNATIONAL MONETARY FUND
PEOPLE’S REPUBLIC OF CHINA—HONG KONG SAR

baseline. This would entail strengthening programs, like Working Family Allowance, Old Age Living
Allowance, child care policies and boosting public education. Higher and more progressive
individual income taxes would contribute another 0.7 points. Property taxes which were declining
significantly under the baseline, contribute to lowering the Gini index by 0.1 points compared to
baseline with a switch to higher reliance on recurrent property taxes which are less dependent on
the housing cycle. Health expenditure is not much changed between baseline and active policies
scenarios reflecting the strong increase that it is already embedded in the baseline.

 Thus, active policies generate a decline of the net Gini of 3.4 points. But what about
the impact on growth?

 Although the early literature found a positive relationship between initial inequality
and subsequent growth, several recent studies found the opposite. Two papers utilized the
Deininger and Squire Database, 1996, where income inequality is measured by the Gini index after
transfers and taxes. Barro (1999) found that the effect of inequality on growth was negative for per
capita GDP below around $5000 (in 1985 USD) and positive above, implying that increases in
income inequality negatively affect growth in poor countries, and positively in rich countries. 10
Forbes (2000) found a significant positive link between inequality and growth in the short- and
medium-term. More recently, however, several studies have found a negative relationship between
inequality and growth (Castello-Climent (2007), Cingano (2014), Ostry et al (2014), and Dabla-Norris
and others (2015)). Table 2 summarizes these results, focusing on estimates of how the Gini index
affects growth.

 There are various channels through which higher inequality could lead to lower
growth.

• Human capital: income disparities limit the ability of poor households to stay healthy and
 accumulate human capital. (Perotti, 1996; Galor and Moav, 2004; Aghion, Caroli, and Garcia-
 Penalosa, 1999);

• Credit market imperfections: lower-income households are unable to make long-term
 investments, such as in human capital, due to limited access to credit (Galor and Zeira, 1993);

• Fertility: lower-income households tend to have a higher number of children, and invest less in
 each of them, which leads to lower average human capital (De la Croix and Doepke, 2003; Moav,
 2005);

10
 Refers to growth rate regression with fertility variable omitted (Table 4 in Barro,1999).

 INTERNATIONAL MONETARY FUND 11
PEOPLE’S REPUBLIC OF CHINA—HONG KONG SAR

• Public Policy Choices: higher inequality may lead to voter backlash against economic
 liberalization, and create protectionist pressures for policymakers (Claessens and Perotti, 2007) 11;

• Socio-political unrest: increased inequality can lead to higher political and economic instability
 (Alesina and Perotti, 1996);

• Aggregate Demand: concentration of income can depress aggregate demand and lower growth
 given higher propensity to save of richer households (Carvalho and Rezai, 2015)

 Reducing income inequality could raise growth in the medium term. Applying the
literature’s more recent estimates, the reduction of 3.4 points in the net Gini envisioned in the active
policies scenario could result in higher growth of real per capita GDP by 0.2 to 0.5 percentage points
per year compared to the baseline scenario. Given that Hong Kong SAR is an advanced economy, its
growth rate is expected to stay in lower single digits, and fall over the medium-term due to aging,
this would be a significant boost to the city’s potential.

C. Policy Recommendations

More active fiscal policies could be used to lower income inequality without sacrificing medium-
term growth prospects.

 Hong Kong SAR’s tax system could be made more progressive. To that end, the
authorities could increase progressivity of the salaries tax, especially at the top, and reverse the
recent tax cuts. Recurrent property taxes—general rates and government rent—could be raised.
That would lower the reliance on volatile transaction taxes, making the revenue source more
immune to the housing cycle. The recurrent property tax schedule could also be made more
progressive, with higher taxes levies on high-value properties.

 Public spending in several areas could be raised to help stem inequality increases.

• Public spending on social welfare could continue to be raised to boost redistribution and
 increase access of poorer households.

• Given the impending aging problem, public health expenditure will need to go hand in hand
 with the pace of aging, resulting in a considerable expansion of more than a third by between
 FY2017/18 and 2030, and doubling by 2050.

• Public social protection expenditure will also need to be expanded, including the Old Age Living
 Allowance (OALA) and the Working Family Allowance, while targeting could be improved by

11
 Another older strand of the literature asserts that higher inequality may prompt voters to demand higher taxation
and regulation, higher public expenditure programs and transfer payments, which in turn could lower investment and
reduce economic efficiency (Bertola, 1993; Alesina and Rodrik, 1994; Persson and Tabellini, 1994; Benabou, 1996;
Perotti, 1996) but empirical evidence is weakas recent studies have shown (Ostry, 2014, Cingano, 2014).

12 INTERNATIONAL MONETARY FUND
PEOPLE’S REPUBLIC OF CHINA—HONG KONG SAR

 phasing out Old Age Allowance that is not means-tested in favor of OALA or other means-
 tested programs.

• Public housing expenditure should be expanded to help alleviate the acute housing shortage
 and shorten the average waiting time for public rental housing.

• The offsetting mechanism in the Mandatory Provident Fund should be abolished, in line with the
 authorities’ intentions.

• Spending on education and child care should be raised to help lower the market income
 inequality directly. The commissioned study aiming to determine the demand and supply for
 child care services and map out the long-term service development programs, as well as the
 initiatives mentioned in the 2018 Policy Address, should help in this regard.

• The level of statutory minimum wage should be revised regularly to keep in line with rising cost
 of living. The authorities could consider moving to annual from the current biennial reviews if
 deemed necessary at any stage.

 INTERNATIONAL MONETARY FUND 13
PEOPLE’S REPUBLIC OF CHINA—HONG KONG SAR

 Table 1. Hong Kong SAR: Panel Regression Estimates of the Drivers of Inequality

 Dependent variable: Net Gini Coefficient JC et al Adding
 HKSAR
 (1) (2)

 Share of Employment in Services -0.320+ -0.108
 (-1.91) (-0.65)

 Share of Employment in Services Squared 0.002 0.000
 (1.30) (0.12)

 Share of Employment in Industry -0.886** -0.444*
 (-4.11) (-2.23)

 Share of Employment in Industry Squared 0.010** 0.002
 (2.64) (0.63)

 Age Distribitution D11 66.942** 54.739**
 (7.22) (6.09)

 Age Distribitution D21 -8.758** -7.219**
 (-7.12) (-6.05)

 1
 Age Distribitution D3 0.338** 0.278**
 (7.02) (5.94)

 Share of Population living in Urban Areas 1.576** 1.458**
 (12.60) (11.73)
 Structural Variables

 Share of Population living in Urban Areas Squared -0.011** -0.010**
 (-11.94) (-10.85)

 Share of Population with Some Tertiary Education -0.160* -0.192**
 (-2.29) (-2.77)

 Share of Population with Some Tertiary Education Squared 0.004** 0.005**
 (3.69) (4.44)

 Public Social Protection Expenditure as Share of GDP -0.146** -0.117**
 (-3.92) (-3.15)

 Public Health Expenditure as Share of GDP -2.314** -2.253**
 (-5.67) (-5.57)

 Public Health Expenditure as Share of GDP Squared 0.183** 0.190**
 (5.60) (5.86)

 Absolute Redistribution -0.138** -0.141**
 (-3.60) (-3.64)
 Policy Variables

 Propert Tax Revenue as Share of GDP -0.241 -0.258
 (-1.22) (-1.36)

 Individual Income Tax Revenue as Share of GDP -0.065 -0.121+
 (-0.90) (-1.68)
 Number of Observations 573 588
 Adjusted R-squared 0.968 0.967
 Country Fixed Effects Yes Yes
 Year Fixed Effects No No
 t statistics in parentheses
 + p
PEOPLE’S REPUBLIC OF CHINA—HONG KONG SAR

 Table 2. Hong Kong SAR: Summary Results from Literature on Growth and Inequality

 Source Measure of Marginal impact of 1 additional Gini Controls for
 inequality point on average annual real GDP per redistribution?
 capita

 Dabla-Norris and Net Gini index -0.067* No
 others, 2015
 Ostry et al, 2014 Net Gini index -0.144*** Yes
 Cingano, 2014 Net Gini index -0.155** No
 Castello-Climent, Income Gini -0.053* No
 2010 Coefficient
 Forbes, 2000 Gini 0.13** No
 Coefficient
 Barro, 1999 Gini 0.06 No
 Coefficient
*, **, and *** indicate statistical significance at the 10, 5, and 1 percent levels, respectively.

 INTERNATIONAL MONETARY FUND 15
PEOPLE’S REPUBLIC OF CHINA—HONG KONG SAR

 References
Aghion, P., E. Caroli, and C. Garcia-Penalosa, 1999, “Inequality and Economic Growth: The
Perspective of the New Growth Theories,” Journal of Economic Literature, Vol. 37(4), pp. 1615–60.

Alesina, A., and R. Perotti, 1996, “Income Distribution, Political Instability and Investment,” European
Economic Review, Vol. 40(6), pp. 1203–28.

Alesina, A., and D. Rodrik, 1994, “Distributive Politics and Economic Growth,” Quarterly Journal of
Economics, Vol. 109(2), pp. 465–90.

Barro, R.J.,2000, “Inequality and Growth in a Panel of Countries,” Journal of Economic Growth, Vol.
5(1), pp. 5–32.

Bénabou, R., 1996, “Inequality and growth” NBER Working Paper n° 5658, July.

Bertola, G., 1993, “Factor shares and savings in endogenous growth,” American Economic Review,
83(5):1184-1198.

Carvalho, L., & Rezai, A., 2015, “Personal income inequality and aggregate demand,” Cambridge
Journal of Economics, 40(2), 491-505.

Castello-Climent, 2007, “Inequality and Growth in Advanced Economies: An Empirical Investigation,”
Institute of International Economics, University of Valencia.

Cingano, F., 2014, “Trends in Income Inequality and its Impact on Economic Growth”, OECD Social,
Employment and Migration Working Papers, No. 163, OECD Publishing.

Claessens, S., & Perotti, E. C., 2007, “Finance and Inequality: Channels and Evidence,” Journal of
Comparative Economics, 35 (4): 748-73.

Clements, B., D. Coady, F. Eich, and S. Gupta, A. Kangur, B. Shang and M. Soto, 2014, “Equitable and
Sustainable Pensions: Challenges and Experience.”

Clements, B., D. Coady, F. Eich, and S. Gupta, A. Kangur, B. Shang and M. Soto, 2013, “The Challenge
of Public Pension Reform in Advanced and Emerging Economies”, IMF Working Occasional Paper No.
275.

Clements, B., K. Dybczak, V. Gaspar, S. Gupta, and M. Soto, 2015, “The Fiscal Consequences of
Shrinking Populations,” IMF Staff Discussion Note, SDN/15/21.

De la Croix, D., and M. Doepke, 2003, “Inequality and Growth: Why Differential Fertility Matters,”
American Economic Review, 93(4), 1091-113.

16 INTERNATIONAL MONETARY FUND
PEOPLE’S REPUBLIC OF CHINA—HONG KONG SAR

E. Dabla-Norris, K. Kochhar, N. Suphaphiphat, F. Ricka, E. Tsounta, 2015, “Causes and Consequences
of Income Inequality: A Global Perspective,” IMF Staff Discussion Note, SDN/15/13.

Forbes, K.J., 2000, “A Reassessment of the Relationship between Inequality and Growth,” American
Economic Review, Vol. 90(4), pp. 869–87.

Galor, O. and J. Zeira, 1993, “Income Distribution and Macroeconomics,” Review of Economic Studies,
60, 35-52.

Galor, O., and O. Moav, 2004, “From Physical to Human Capital Accumulation: Inequality and the
Process of Development,” Review of Economic Studies, Vol. 71(4), pp. 1001–26.

Hong Kong SAR Government, 2016, “Hong Kong 2016 Population By-census - Thematic Report:
Household Income Distribution in Hong Kong”.

Hong Kong SAR Government, 2017, “The Gini Coefficients of Hong Kong in 2016: Trends and
Interpretations”, Half-yearly Economic Report.

IMF, 2017, “Fiscal monitor”

Jain-Chandra, S., N. Khor, R. Mano, J. Schauer, P. Wingender and J. Zhuang, 2018, “Inequality in
China - Trends, Drivers and Policy Remedies,” IMF Working Paper 18/127.

Mano, R.C., 2017, “Medium-term fiscal prospects and implications” in People’s Republic of China-
Hong Kong Special Administrative Region: Selected Issues

Moav, O., 2005, “Cheap Children and the Persistence of Poverty”, Economic Journal, 115, 88-110.

Ostry, J., A. Berg, C. Tsangarides, 2014, “Redistribution, Inequality, and Growth,” IMF Staff Discussion
Note, SDN/14/02.

Perotti, R., 1996, “Growth, Income Distribution, and Democracy: What the Data Say,” Journal of
Economic Growth, Vol. 1(2), pp. 149–87.

Persson, T., and G. Tabellini, 1994, “Is Inequality Harmful for Growth?” The American Economic
Review, Vol. 84(3), pp. 600–21.

Solt, Frederick, 2016, “The Standardized World Income Inequality Database,” Social Science Quarterly
97(5):1267-12

 INTERNATIONAL MONETARY FUND 17
PEOPLE’S REPUBLIC OF CHINA—HONG KONG SAR

FINANCIAL CONDITIONS AND GROWTH-AT-RISK IN
HONG KONG SAR 1

As a small, open economy and a regional financial center, Hong Kong SAR’s financial conditions
are affected by domestic and external developments and can exert a sizable impact on growth.
Financial conditions indicators are useful in detecting financial vulnerabilities and can serve as a
predictor of downside risks to growth. Using a country-specific Financial Conditions Index for
Hong Kong SAR, we find that asset market valuations play an important role in determining its
financial conditions. While near-term risks to growth are limited, easy financing conditions pose
downside risks to medium-term growth. Moreover, a sizable correction to equity and property
markets could have a large negative impact on near-term growth.

 Financial conditions refer to the ease with which households and corporates access
funding. To measure funding conditions, including the costs of credit as well as the terms and
conditions borrowers face, financial condition indexes (FCI) include information on the price of risks,
credit aggregates and external conditions. Using methodologies introduced in the IMF GFSR
(2017b), the FCI for Hong Kong SAR is estimated using principal component analysis (PCA) and
incorporates information from 17 variables. 2 FCI variables are grouped into separate (i.e.
“partitioned”) categories to help better assess different financial conditions.

 Table 1. Hong Kong SAR: Underlying FCI Variables by Category
 Price-based indicators Property Leverage-based
 Equity indicators FX
 (Price of risk) indicators indicators
 Residential property Equity market capitalization, HKD REER,
 3-month Hibor change, yoy, bps HKD domestic credit, log diff.
 price index, log diff. log diff. Log diff

 3-month Hibor-Libor spread, Office space price Hang Seng Index (HSI), log HK credit gap (HKMA
 bps index, log diff. diff. measure), level diff.

 3-month Hibor-3-month EFB Realized HSI volatility, log
 Household loans, log diff.
 spread, bps diff

 2-year EFN - 3 month EFB Household loans/bank asset,
 spread, bps level diff.

 Property-related loans, log diff.

 Property-related loans/bank
 asset, level diff.

 Outstanding HKD debt
 instruments, excluding EFBN,
 log diff.
 Source: Bloomberg, CEIC, HKMA, IMF staff estimates

1
 Prepared by Sally Chen and Sheheryar Malik. We thank Romain Lafarguette, Alan Feng and Prasad Ananthakrishnan
for their thoughtful comments and suggestions.
2
 The FCI is normalized to have a zero mean over the estimated period of January 1995 to June 2018.

18 INTERNATIONAL MONETARY FUND
PEOPLE’S REPUBLIC OF CHINA—HONG KONG SAR

For example, given concerns regarding housing market overvaluation and to better understand the
role asset prices play in Hong Kong SAR’s financial conditions, property and equity market indicators
are grouped together to summarize asset price valuations. Other variables, such as price-based
indicators, are grouped separately to measure the cost of borrowing.
 Hong Kong SAR Financial Conditions Index
 While financial conditions in Hong Kong SAR 4
 Tightening

remain accommodative, the degree of accommodation 3

 2
is declining. Since the end of 2017, interest rates, 1

reflecting rising rates in the U.S., have increased. These 0

 -1
developments, combined with sizable equity market losses -2

have contributed to a tightening of financial conditions in -3

 -4
Hong Kong SAR.

 Jul-10

 Jul-17
 Mar-08

 Mar-15
 Aug-07

 Aug-14
 Jan-07

 Oct-08

 Oct-15
 May-09

 Feb-11

 Jan-14
 Sep-11

 May-16

 Feb-18
 Dec-09

 Nov-12

 Dec-16
 Jun-13
 Apr-12
 Sources: Bloomberg LP, CEIC and IMF Staff Estimates.

 Financial conditions in Hong Kong SAR are
highly correlated with external conditions, reflecting its role as a financial center. Not
surprisingly, given the presence of international banks and Hong Kong SAR’s role as a trade
intermediary, including as a gateway to Mainland China, global risk sentiment affects local market
volatility. Financial conditions have been mostly accommodative since the Great Financial Crisis.
However, increased volatility and uncertainty during the European sovereign debt crisis in late 2011
as well as changes to the RMB fixing mechanism in 2015 tightened financial conditions in Hong
Kong SAR.

 Asset market performance – changes in property and equity market valuations in
particular – plays a large role in the swings in Hong Kong SAR’s FCI. On average, property
market valuation explains 27 percent of FCI movements in 2016-2018. Equity valuation and volatility
captured another 13 percent. Price-based Underlying FCI Variables by Category
indicators, a proxy for funding costs, captured 3

roughly 25 percent while leverage, proxied by 2
 Tightening

credit supplied, played a relatively limited role, 1
at 13 percent over the same period. Gains in 0
property and equity markets as well as low Price-based indicators
 -1
borrowing costs in 2017 helped to ease overall Leverage-based indicators
 Property indicators
 -2
financial conditions. However, recent losses in
 FX
 Other (e.g. China growth)
 Equity indicators
equities, combined with rising rates and
 -3
 Jul-15

 Jul-16

 Jul-17
 Mar-15

 Mar-16

 Mar-17

 Mar-18
 Jan-15

 May-15

 Jan-16

 Jan-18
 Sep-15

 May-16

 Jan-17
 Sep-16

 May-17

 Sep-17

 May-18
 Nov-15

 Nov-16

 Nov-17

reduced credit growth in the economy, have
moved overall financial conditions closer Source: Bloomberg, CEIC, Staff estimates

towards neutral.

 Quantile regressions, based on the partitioned FCI components, offer insights into the
impact of financial conditions on growth and underscore the large role asset prices play in
Hong Kong SAR’s financial conditions. These regressions show that different aspects of financial
conditions – risks or asset valuations, for example – exert varying degrees of impact on growth and
their impacts vary across different growth quantiles (Figure 1, Annex tables 1 & 2 and Technical

 INTERNATIONAL MONETARY FUND 19
PEOPLE’S REPUBLIC OF CHINA—HONG KONG SAR

Appendix). For example, while a one-unit increase 3 in the price of risk is associated with declines in
growth rates in the near term, 4 higher risk prices have bigger impacts when growth rates are low
(e.g. below the 50th percentile). Specifically, increases in the price of risks, such as higher funding
costs or wider yield spreads by one standard deviation, for example, have limited impact on growth
when growth rate is at the 90th percentile, but could slow growth by as much as 0.8 percentage
points when growth rates are at the 25th or 10th percentile. By contrast, over the same horizon,
increases in property market values are particularly supportive during low growth periods but have
relatively muted impact when growth is high (e.g. above the 50th percentile). Meanwhile, while
leverage and property prices tend to be positively correlated, increases in leverage are supportive of
growth only in high-growth scenarios, as noted earlier, while property price increases provide bigger
boosts to growth at lower growth levels. This divergence is likely related to the fact that house
prices in Hong Kong SAR are relatively more detached from leverage (HKMA Quarterly Bulletin
2002).

 Interestingly, while increases in leverage are generally correlated with higher growth,
leverage can also detract from growth. An increase in leverage is associated with reduced growth
at lower growth quantiles in the near term (though the results are not conclusive). This finding,
taken together with insights from the impact of higher risk prices on growth distribution, suggests a
negative feedback loop between higher debt, higher funding costs and growth. In particular, rising
debt service payments, combined with a growing debt load, is particularly pernicious during low-
growth periods, and could amplify the negative feedback loop between debt service capacity and
investment and consumption.

 Over the medium term, easier financing conditions tend to be associated with weaker
growth, underscoring their risks to longer-term growth. Notably, property price gains are
associated with lower growth over the medium term, in contrast to the boost these increases
provide over the near term. Reflecting the large role asset prices play in Hong Kong SAR’s financial
conditions, changes in property prices generally have larger impacts on growth relative to price and
leverage, particularly at lower growth quantiles. This suggests that property prices can be a powerful
amplifier of risks during lower-growth periods, providing sizable boosts to growth during upturns
but also considerable drags during downturns.

3
 Units are measured in standard deviations to standardize measures across different variables.
4
 Near term refers to the 1-year horizon; medium term refers to the 3-year horizon.

20 INTERNATIONAL MONETARY FUND
PEOPLE’S REPUBLIC OF CHINA—HONG KONG SAR

 Figure 1. Hong Kong SAR: Changes in Financial Conditions Affect Growth Risks
 Quantile regression estimates; growth 4 quarters ahead

 1. Price of Risk 2. Property 3. Leverage
 0.0 0.9 0.3

 -0.2 0.8 0.2

 -0.3 0.6 0.1

 -0.5 0.5 0.0

 -0.6 0.3 -0.1

 -0.8 0.2 -0.2

 -0.9 0.0 -0.3
 10th 25th 50th 75th 90th 10th 25th 50th 75th 90th 10th 25th 50th 75th 90th
 percentile percentile percentile

 Quantile regression estimates; growth 12 quarters ahead

 1. Price of Risk 2. Property 3. Leverage
 0.3 0.0 0.7

 -0.2 0.6
 0.2 0.5
 -0.3
 0.4
 -0.5 0.3
 0.0
 -0.6 0.2
 0.1
 -0.2 -0.8
 0.0
 -0.9 -0.1
 -0.3 -1.1 -0.2
 10th 25th 50th 75th 90th 10th 25th 50th 75th 90th 10th 25th 50th 75th 90th
 percentile percentile percentile

 Note: The coefficients are standardized to show the impact of one standard deviation increase in the current quarter FCI on GDP 4 and 12 quarters ahead
 (also expressed as standard deviations). Solid blocks indicate statistical significance.

 Given current financial conditions, the Growth-at-Risk analysis suggests a low
probability of recession in the near and medium term. Financial conditions are currently still
easy and are moving towards neutral. The distribution of risks to growth is thus largely stable over
the next three years. The forecasted probability of a recession over the next year was around 10
percent, not much different from 2017. Over the medium term out to 2020, recession risks edge
higher to about 18 percent. Using quantile regressions, the
 Growth at Risk Density
5th percentile in the near term is -2.12 percent, and (Probability Density as of 2018 Q2)

medium term is -3.36 percent. 5 0.25

 Recession Near term - 2019 Medium term - 2021

 The large role asset valuations play in Hong 0.2

Kong SAR’s financial conditions suggests that their
 0.15
correction – with some already underway – could
negatively affect financial conditions and output 0.1

growth. These potential changes in financial conditions 5th percentile
matter as they can amplify adverse shocks to the economy 0.05

through financial frictions. Buoyant asset markets lift risk
appetite, encourage investment and reduce funding costs.
 0
 -6 -4 -2 0 2 4 6 8 10 12

However, as these conditions deteriorate, they can Sources: Bloomberg Finance L.P.; IMF, World Economic Outlook database; and IMF staff estimates.

5
 The estimation of conditional quantiles for growth forecasts is based on Adrian et al (forthcoming) and IMF (2017).
The estimation of t-skew distribution parameters is based on Singer and Nelder (2009) which provides the basis from
which to calculate the associated growth at risk (GaR).

 INTERNATIONAL MONETARY FUND 21
PEOPLE’S REPUBLIC OF CHINA—HONG KONG SAR

introduce sizable downside risks. Tighter financial conditions have historically been associated with a
decline in output growth. As seen in the results from the quantile regression discussed above,
higher funding costs, lower credit supplied and reduced wealth effects from lower asset prices could
weigh on growth, introducing a negative feedback loop between tightening financial conditions and
weakening consumption and investment. There is also a trade-off between growth over the near
term and the medium term as suggested by the quantile regressions: to the extent that near-term
growth slows due to tightened financial conditions, risks to medium-term growth is lower by
comparison.

22 INTERNATIONAL MONETARY FUND
PEOPLE’S REPUBLIC OF CHINA—HONG KONG SAR

 References
Adrian, T., N. Boyarchenko, and D. Giannone, "Vulnerable Growth", American Economic Review,
forthcoming.

He, X. and L. Zhu, 2003, "A Lack-of-fit Test for Quantile Regression", Journal of the American
Statistical Association 98, no. 464: 1013-1022.

Hong Kong Monetary Authority (2002) Quarterly Bulletin, August 2002.

International Monetary Fund, 2017a, “Are Countries Losing Control of Domestic Financial
Conditions?”, Global Financial Stability Report April 2017, Chapter 3, Washington DC.

International Monetary Fund, 2017b, “Financial Conditions and Growth at Risk”, Global Financial
Stability Report October 2017, Chapter 3, Washington DC.

International Monetary Fund, 2018, “A Bumpy Road Ahead”, Global Financial Stability Report April
2018, Chapter 1, Washington DC.

Koenker, R. and Machado, J.A., 1999. “Goodness of Fit and Related Inference Processes for
Quantile Regression”, Journal of the American Statistical Association, 94(448), pp.1296-1310.

Singer, S. and Nelder, J., 2009. “Nelder-mead algorithm”, Scholarpedia, 4(7), p.2928.

 INTERNATIONAL MONETARY FUND 23
PEOPLE’S REPUBLIC OF CHINA—HONG KONG SAR

 Appendix I. Estimation of the Conditional Quantiles
For the horizon ℎ ∈{4,12}, where h represents the quarters ahead, quantile regressions of the
dependent GDP growth variables +ℎ are estimated conditional on macro-financial variables , ,
 � +ℎ , | { , } ∈ �, for a given date t, based on the point estimates of the coefficients � and ̂ :

 ( +ℎ , | { } ∈ ) = � + � ̂ ,
 ∈

Where +ℎ represents future growth h quarters ahead, , is the partition i (for instance price,
property or leverage), is the coefficient of the quantile regression, is the associated constant
and ,

 the residual. The quantile regressions are estimated at different points of the distribution of
 +ℎ , ∈ {0.1, 0.25, 0.5, 0.75 , 0.9}. Each beta coefficients represents the macrofinancial linkage
between the variable , and future growth, at different points of the distribution of GDP growth
(basically, the business cycle).

Using quantile regressions for estimating the conditional distribution has many advantages: first,
under standard assumptions, quantile regressions provides the best unbiased linear estimator for
the conditional quantile; second, quantile regressions are robust to outliers. Finally, the asymptotic
properties of the quantile regression estimator are well-known and easy to derive.

For a more detailed discussion, please refer to Adrian et al.

24 INTERNATIONAL MONETARY FUND
PEOPLE’S REPUBLIC OF CHINA—HONG KONG SAR Appendix Table I. Quantile Regressions Results 4 Quarters Ahead Estimates Standard Quantile 95% Confidence Limits P-Value (standardized) Error (intercept) 0.1 -1.07 0.26 -1.33 -0.81 0.00 Price 0.1 -0.74 0.25 -0.98 -0.49 0.00 Property 0.1 0.80 0.36 0.44 1.16 0.00 Equity 0.1 -0.58 0.37 -0.95 -0.21 0.01 Leverage 0.1 -0.20 0.43 -0.63 0.23 0.44 REER 0.1 0.20 0.34 -0.14 0.53 0.33 Real GDP CHN (yoy growth) 0.1 0.06 0.30 -0.24 0.36 0.73 (intercept) 0.25 -0.56 0.17 -0.73 -0.39 0.00 Price 0.25 -0.77 0.20 -0.97 -0.57 0.00 Property 0.25 0.51 0.24 0.27 0.74 0.00 Equity 0.25 -0.24 0.23 -0.47 -0.01 0.09 Leverage 0.25 -0.06 0.28 -0.34 0.23 0.73 REER 0.25 0.14 0.23 -0.09 0.38 0.32 Real GDP CHN (yoy growth) 0.25 0.28 0.22 0.06 0.50 0.03 (intercept) 0.5 0.12 0.12 0.00 0.23 0.10 Price 0.5 -0.36 0.17 -0.53 -0.19 0.00 Property 0.5 0.45 0.16 0.30 0.61 0.00 Equity 0.5 -0.10 0.17 -0.28 0.07 0.33 Leverage 0.5 0.12 0.19 -0.07 0.32 0.30 REER 0.5 -0.15 0.16 -0.31 0.00 0.11 Real GDP CHN (yoy growth) 0.5 0.24 0.16 0.07 0.40 0.02 (intercept) 0.75 0.43 0.13 0.30 0.56 0.00 Price 0.75 -0.24 0.17 -0.41 -0.07 0.02 Property 0.75 0.19 0.17 0.02 0.36 0.07 Equity 0.75 0.00 0.18 -0.18 0.18 0.99 Leverage 0.75 0.21 0.22 0.00 0.43 0.10 REER 0.75 -0.28 0.18 -0.46 -0.10 0.01 Real GDP CHN (yoy growth) 0.75 0.22 0.20 0.03 0.42 0.06 (intercept) 0.9 0.96 0.18 0.78 1.14 0.00 Price 1.9 -0.03 0.27 -0.30 0.24 0.85 Property 2.9 0.02 0.29 -0.27 0.31 0.92 Equity 3.9 0.27 0.31 -0.04 0.58 0.15 Leverage 4.9 0.22 0.33 -0.11 0.54 0.28 REER 5.9 -0.51 0.28 -0.79 -0.23 0.00 Real GDP CHN (yoy growth) 6.9 0.17 0.28 -0.11 0.44 0.32 INTERNATIONAL MONETARY FUND 25
You can also read