JUNE 2020 - Mercy Corps AgriFin
←
→
Page content transcription
If your browser does not render page correctly, please read the page content below
JUNE 2020
CONTENTS
ACRONYMS & ABBREVIATIONS: 3
TABLE OF FIGURES: 3-4
EXECUTIVE SUMMARY: 5-8
INTRODUCTION: 9-10
           OBJECTIVES
           CONTEXT
           METHODOLOGY
CURRENT SOLAR IRRIGATION MARKET & CONSTRAINTS: 11-12
           THE KENYAN IRRIGATION LANDSCAPE
           CONSTRAINTS TO SOLAR WATER PUMP UPTAKE
              AFFORDABILITY
              AWARENESS
              WATER ACCESS
RECOMMENDATIONS FOR POLICY INTERVENTIONS: 13-21
           INTERVENTION 1: DESIGN A TARGETED INCENTIVES / SUBSIDY SCHEME FOR SMALL
           HOLDER FARMERS AIMED AT PURCHASE OF SWPS
           INTERVENTION 2: INCENTIVIZE FINANCIAL INSTITUTIONS TO EXTEND CREDIT TO SHFS FOR
           SWPS
           INTERVENTION 3: CONDUCT A TARGETED AWARENESS AND EDUCATION CAMPAIGN
           OVER THE NEXT FIVE YEARS TO RAISE AWARENESS OF BOTH THE SHORT-TERM AND LONG-
           TERM BENEFITS OF SOLAR IRRIGATION PRODUCTS AMONG SHF
           INTERVENTION 4: PROVIDE FINANCIAL SUPPORT FOR INCREASING ACCESS TO
           APPROPRIATE WATER SOURCES
           ADDITIONAL ENABLING INTERVENTIONS
AGGREGATE IMPACT: 22-25
           IMPACT ON MARKET GROWTH
           IMPACT IN TERMS OF YIELD AND INCOME
           IMPACT IN TERMS OF FOOD SECURITY AND RESILIENCE
COUNTY ROLL-OUT: 26
APPENDIX: 27-29
BIBLIOGRAPHY: 29

                                             2
ACRONYMS & ABBREVIATIONS
  SHF: SMALL HOLDER FARMER
  SWP: SOLAR WATER PUMP
  HH: HOUSEHOLD
  RBF: RESULTS BASED FINANCING
  SME: SMALL AND MEDIUM ENTERPRISES
  CGS: CREDIT GUARANTEE SCHEME
  LGF: LOAN GUARANTEE FUND
  NPV: NET PRESENT VALUE
  GDP: GROSS DOMESTIC PRODUCT
  MT: METRIC TONNES
  NTL: NIGHT-TIME LIGHT
  PAYG: PAY-AS-YOU-GO
  ROI: RETURN ON INVESTMENT
  SSA: SUB-SAHARAN AFRICA
  PV: PHOTO-VOLTAIC

TABLE OF FIGURES
  FIGURE 1: INCREASE OF LAND IRRIGATED UNDER COMBINED POLICY INTERVENTIONS (THOUSANDS
  OF HECTARES)
  FIGURE 2: PROJECTED ANNUAL FOOD PRODUCTION DUE TO COMBINED POLICY INTERVENTIONS
  (MILLION MT)
  FIGURE 3: INCREASE OF THE AGRICULTURAL PROPORTION OF GDP UNDER COMBINED POLICY
  INTERVENTIONS
  FIGURE 4: INCREASE IN SMALL-HOLDER FARMERS INCOME DUE TO THE UPTAKE OF A SOLAR WATER
  PUMP (KES, THOUSANDS)
  FIGURE 5: IMPACT OF EACH POLICY INTERVENTIONS IN TERMS OF SWPS SOLD, TOTAL FOOD
  PRODUCTION IN 5 YEARS AND INCREASE OF SMALL-HOLDER FARMER INCOMES
  FIGURE 6: IRRIGATED LAND PER COUNTY IN KENYA
  FIGURE 7: MAP OF KEY ACTORS IN THE KENYAN IRRIGATION LANDSCAPE
  FIGURE 8: PERCENTAGE OF HOUSEHOLDS PER COUNTY THAT ARE LIKELY TO PURCHASE THE SWPS
  AFTER A SUBSIDY SCHEME
  FIGURE 9: PROJECTED AVERAGE ANNUAL YIELD INCREASE OVER 10 YEARS UNDER THE SUBSIDY
  SCHEME (MILLION MT)
  FIGURE 10: PROJECTED AVERAGE ANNUAL INCREASE IN SHF INCOME UNDER THE SUBSIDY SCHEME
  (BILLION KES)

                                           3
FIGURE 11: CASE STUDY ON TARGETED SUBSIDY
FIGURE 12: PROJECTED AVERAGE ANNUAL YIELD INCREASE OVER 10 YEARS UNDER THE RISK-
SHARING SCHEME (MILLION MT)
FIGURE 13: PROJECTED AVERAGE ANNUAL INCREASE IN SHF INCOME UNDER THE RISK-SHARING
SCHEME (BILLION KES)
FIGURE 14: CASE STUDY ON RISK-SHARING
FIGURE 15: PROJECTED AVERAGE ANNUAL YIELD INCREASE OVER 10 YEARS UNDER A TARGETED
AWARENESS AND EDUCATION CAMPAIGN (MILLION MT)
FIGURE 16: PROJECTED AVERAGE ANNUAL INCREASE IN SHF INCOME OVER 10 YEARS UNDER A
TARGETED AWARENESS AND EDUCATION CAMPAIGN (BILLION KES)
FIGURE 17: PROJECTED AVERAGE ANNUAL YIELD INCREASE OVER 10 YEARS WITH RELIABLE ACCESS
TO WATER (MILLION MT)
FIGURE 18: PROJECTED AVERAGE ANNUAL INCREASE IN SHF INCOME OVER 10 YEARS WITH RELIABLE
WATER ACCESS (BILLION KES)
FIGURE 19: CASE STUDY ON FINANCIAL INCENTIVES FOR WATER ACCESS
FIGURE 20: ENABLING INTERVENTIONS, TO SUPPORT BROADER UPTAKE
FIGURE 21: CUMULATIVE UPTAKE OF SOLAR WATER PUMPS IN KENYA FOR EACH POLICY
INTERVENTION (NO. OF HHS)
FIGURE 22: CUMULATIVE UPTAKE OF SOLAR WATER PUMPS IN KENYA UNDER CUMULATIVE POLICY
INTERVENTIONS (NO. OF HHS)
FIGURE 23: AGGREGATED IMPACT IN TERMS OF YIELD PER COUNTY UNDER COMBINED POLICY
INTERVENTIONS 1,2,3 AND 4 (THOUSAND METRIC TONS)
FIGURE 24: BREAKDOWN OF THE MAIN DRIVERS OF YIELD (MT/HECTARE) AND INCOME INCREASE
(THOUSAND KES) FOR SMALL-HOLDER FARMERS IN KENYA
FIGURE 25: INCREASE OF FOOD PRODUCTION DUE TO RESILIENCE (%)
FIGURE 26: PROJECTED UPTAKE PER COUNTY IN KENYA
FIGURE 27: MAP OF NYANDARUA SWP USAGE, AT SUB-LOCATION LEVEL, BASED ON INTERVENTIONS
BEING ENACTED (POLICY INTERVENTION 1, 2, 3, 4 COMBINED)
FIGURE 28: LIST OF ASSUMPTIONS USED IN THE MODELLING

                                            4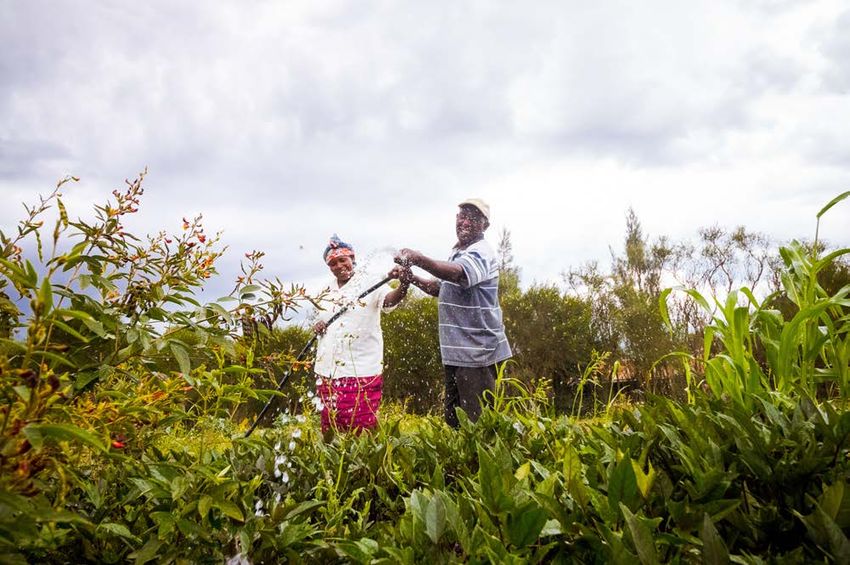
EXECUTIVE SUMMARY

Kenya has set a goal of reaching 100% food security in the country as part of the President’s Big 4 Agenda, with
irrigation as a key part of the solution. 11 million people are actively employed in primary production agriculture,
with the majority of these (80%) in small holder farms of less than three acres. In the FY19/20 budget, several
food security priorities were announced, including i) reducing over-reliance on rain-fed agriculture; ii) developing
85,000 acres under the National Expanded Irrigation Programme, and iii) increasing area under smallholder
irrigation by 1,617 acres.
Solar water pump uptake is nascent but is primed to play a major
role in agriculture in Kenya. In order to achieve the government’s
goals, solar irrigation must be part of the answer. With irrigation, a
farmer can increase their production 1
                                        between 2 and 4 times, and
their income between 2 and 6 times. Whilst diesel pumps and large-
scale irrigation programmes are common, fewer than 10,000 solar
water pumps are purchased in Kenya annually. SWP’s upfront costs
are typically 2-3 times more expensive than a diesel pump.
However, as they operate on sunlight (i.e. environmentally friendly),
have reduced maintenance costs, and have a longer lifetime
duration, SWP’s costs to a farmer are less than half that of a diesel
pump over their lifetime – and many current suppliers offer monthly
payment terms to reduce the upfront cost. In addition, SWP can also penetrate the market faster thanks to their
decentralized model. The uptake is not conditional on a few major programmes run by institutions; but instead it is
a purchase decision made by farmers across Kenya.
To accelerate uptake of solar water pumps by farmers, government and other supportive actors need to invest in
ambitious policy interventions. In this paper, we propose a set of investments for policymakers to consider, which
have positive financial returns that could accelerate the uptake of SWPs and contribute to Kenya’s food security
agenda.

                                                                                                        With multiple policy interventions combined, irrigation through
                                                                                                        solar water pumps will increase farmer income, food production,
                                                                                                        resilience, and reduce food imports – thus supporting the
                                                                                                        national Big 4 Agenda goals. In our ‘multiple intervention’
                                                                                                        scenario, we expect farmer income to increase: 1.7 Million
                                                                                                        farmers will increase their daily income by an average of 177%
                                                                                                        by 2030, through better yields, planting of higher value crops;
                                                                                                        and selling produce off-season for higher prices. We expect
                                                                                                        national food production to increase significantly (from 23.2
                                                                                                        Million MT in 2020 to 65.5 Million MT in 2030). We also
                                                                                                        expect imports of key staples to fall: currently 529 Thousand MT
                                                                                                                                         2
                                                                                                        of maize is imported annually, and this gap would be largely
                                                                                                            3
                                                                                                        met. Resilience would also improve – in any given year in Kenya
there is a 40% chance of drought - and with a reliable pump, production can continue even when rains fail. All of
these factors contribute to greater food production, resilience, and income for farmers.

1. The increase in production varies by crop; from 100% for maize and beans, 200% for cabbage and kales up to 386% for tomatoes
2. ITC Trade Map
3. Production of maize calculated based on the ‘multiple intervention’ scenario. The projected maize production in 2030 is estimated to reach 527 Thou

                                                                                                                          5
The graphs below illustrate the impact of the uptake of solar water pumps compared to the National
Irrigation Program and the Big 4 Agenda.

                       INCREASE IRRIGATION

 Under the National Water Master Plan 2030, the Government of Kenya
                                                                4                                                   LAND IRRIGATED
 aims to irrigate an additional 803,000 hectares by 2030. Under the
                                                                                                                    (THOUSANDS OF HECTARES)
 combined policy interventions, the land irrigated is projected to exceed                                           1,500
 the targets, by reaching 1.3 Million hectares. Currently 3% of arable land                                                       1265

 in Kenya is irrigated; well below the Sub-Saharan average of 7%. Under                                                            1100         CURRENT
                                                                                                                            967                 LAND
 the interventions proposed in this brief, this could rise to between 7.5%                                          1,000                       IRRIGATED
                                                                                                                            803
 and 22% of arable land (depending on the combination of interventions                                                                          PROJECTED
 selected); whilst ambitious, this would still be well below Southern Asia                                                                      LAND IRRIGATED
                                                                                                                     500                        (WITH SWPS)
 (50%) or Eastern Asia (61%) regions.5
                                                                                                                                                PROJECTED
                                                                                                                                                LAND IRRIGATED
THE LAND IRRIGATED WILL EXCEED THE                                                                                     0
                                                                                                                            165 165             (NWMP)

PROJECTED IRRIGATED LAND IN THE                                                                                     FIGURE 1: INCREASE OF LAND IRRIGATED
                                                                                                                    UNDER COMBINED POLICY INTERVENTIONS

NATIONAL WATER MASTER PLAN                                                                                          (THOUSANDS OF HECTARES)

                       REDUCE FOOD INSECURITY

 The Big 4 Agenda has set a goal to reduce the number of                                                                                                    23
                                                                                               75         75
 food insecure Kenyans by 50%. Around 3.1 Million                                                                           PROJECTED ANNUAL
                                      6
 Kenyans are currently food insecure. Under the combined                                                                    FOOD PRODUCTION
                                                                                                               42
                                                                                                                            (MILLION MT)
 policy interventions, 6.8 Million Kenyans are likely to                                       50         50
 benefit from an increase of food production.                                                                                     CURRENT FOOD
                                                                                                                                  PRODUCTION (MILLION
FOOD PRODUCTION WILL INCREASE                                                                  25
                                                                                                    23
                                                                                                           5
                                                                                                          25                      MT)
                                                                                                                                  PROJECTED FOOD
44% SUPPORTING THE AIM OF A 50%                                                                                                   PRODUCTION FOR 2030
                                                                                                                                  (MILLION MT)
REDUCTION IN THE NUMBER OF                                                                      0         0

                                                                                               FIGURE 2: PROJECTED ANNUAL FOOD PRODUCTION DUE TO
FOOD INSECURE KENYANS                                                                          COMBINED POLICY INTERVENTIONS (MILLION MT)

                      INCREASE AGRICULTURAL GDP

The Big 4 Agenda aims to increase the
                                                                                                       AGRICULTURAL
proportion of GDP attributed to agriculture,                                     2020               PROPORTION OF GDP                              2030
by 48%. If all four interventions were                                                   26%
                                                                                                                                                                 35%
chosen, the increase of food production                                                                  +35% INCREASE
                                                                                 26%                                                               35%
due to solar irrigation will result in a 35%                                                             OVER 10 YEARS
                                                                                                                                          65%
increase in the proportion of agriculture in                               74%
                        7
Kenya’s GDP in 2030 (from 26% of GDP                                         FIGURE 3: INCREASE OF THE AGRICULTURAL PROPORTION OF GDP UNDER
                                                                             COMBINED POLICY INTERVENTIONS
to 35% of GDP).
4. FAO, Irrigation market brief
5. World Bank figures
6. USAID, Food Assistance Fact sheet, 2019
7. Kenya’s GDP is assumed to grow at 6% average rate per year until 2030

                                                                                    6
INCREASE SMALL HOLDER FARM INCOME

The Big 4 Agenda has set a goal to
increase the average daily income of                                                                    INCREASE IN SMALL-HOLDER FARMERS INCOME DUE TO THE
farmers by 34%. The expansion of                                                                                   UPTAKE OF A SOLAR WATER PUMP
                                                                                                                                                  23

irrigation will lead to higher yield
and incentivize farmers to grow                                                                             AVERAGE INCOME FOR                                                 750
                                                                                                            SHF
higher value crops. This will enable                                                                                                                                                                               384                   7 7
                                                                                                                                                                                                                                         707
                                                                                                             IRRIGATION YIELD                                                      INCOME
farmers to increase their income well                                                                        INCREASE                                                          500 INCREASE
above this target.                                                                                          INCOME INCREASE FROM
                                                                                                            SWITCH TO HIGHER VALUE                                                                                  68
THE INCOME INCREASE                                                                                         CROP                                                               250
                                                                                                                                                                                            255
WILL EXCEED THE                                                                                             TOTAL INCOME PER SHF
                                                                                                            AFTER PURCHASE OF SWP                                                  0
OBJECTIVE OF 34%
INCREASE OF SHF                                                                                      FIGURE 4: INCREASE IN SMALL-HOLDER FARMERS INCOME DUE TO THE UPTAKE OF A SOLAR
                                                                                                     WATER PUMP (KES, THOUSANDS)

INCOME

                        PROPOSED INVESTMENT STRATEGY

To achieve these goals, there are four investments proposed to increase production and smallholder income,
which could dramatically scale up the solar water pump market. Once the market is at scale, it will continue to
grow through increased income by smallholder farmers, and improved economies of scale for distributors and
financiers. These investments are described as follows:

   1. Subsidy to incentivize uptake: In areas with reliable   able water access, the single greatest constraint to SWP uptake
      is affordability. A 50% subsidy on solar water pumps would dramati         dramatically increase uptake by bringing SWPs
      within the reach of more SHFs. After five years, the subsidy could be rremoved, and the government would
      generate revenue from a much largerr market.
   2. Incentivize financial institutions to extend
                                                 tend credit: To make SWPsSWPPs wide
                                                                                   widely
                                                                                        ely afford
                                                                                            affordable, they must be offered on
      Pay-As-You-Go credit;   it; yet today ccredit                    SWP
                                                dit is offered byy the SW WP d  distributors
                                                                                dis           (who have limited finance) rather than
                                                                                  stribuutors (wh
                            8
      financial institutions. Today, each     individual
                                          chh individua   S P ccompany
                                                dividual SWP      omp        operates
                                                                      panny op peeratess as its oown financier, which creates
      operational complexity and raises    ses the costt of fina
                                                            finance.    rrisk-sharing
                                                               ancce. A risk-
                                                                            k shha
                                                                            k-           mechanism
                                                                                 aring mecha  hanism would incentivize financial
      institutions to consider offering cre
                                          credit directly, thus
                                                             hus increasing the am  amount
                                                                                      mo of credit,
                                                                                      m
                                                                                      mount         edit and extending the payment
      period for farmers.
   3. Support a wide scale awareness          programme:: B
                                       en sss prog
                                              p              Because SWPs are a relati   relatively new technology in the Kenyan
      context, farmers often are unaware  war off their ben
                                                          benefits; thus, eachh indiv
                                                                                  individual company has to educate farmers
      themselves. Leveraging       government infrastructure
                               ng governme                            extension workers could dramatically improve
                                                            ure and extensio
      awareness and accelerate SWP uptake, helping the market achieve scale more quickly.
   4. Provide financial support for water access: Many parts of the country struggle with water supply; but without to
      access to water, irrigation is not possible. Incentives for appropriate local water access would increase the
      pool of farmers who could irrigate with a Solar Water Pump.

8. There are several advantages to decouple the distributors of SWP with financing. It allows debt investors to isolate the risk of customers non-payment from the risk of the company. It also allows companies to outsource financing to financial institutions
that have greater experience in managing risks and larger balance sheet (Daniel Waldron et al, (2018), Taming the Strange Beasts: Servicing and the Future of PAYGo.

                                                                                                                               7
A county-level pilot using combined set of all four interventions, would be the most effective way to refine the roll-
out and implementation approach. The projected impact of each intervention, against a ‘base case’, is provided
below:

                                      TOTAL UNITS OF                   TOTAL FOOD                    INCREASE OF SMALL-
                                    SWPS SOLD IN NEXT                PRODUCTION IN 5                   HOLDER FARMER
       INTERVENTION
                                    5 YEARS (ABSOLUTE                   YEARS (MT,                 INCOMES OVER 5 YEARS
                                         VALUE)                        CUMULATIVE)                    (KES, CUMULATIVE)

 DESIGN A TARGETED SUBSIDY
 SCHEME FOR SMALL-HOLDER
 FARMERS AIMED AT PURCHASE             274 K UNITS SOLD                  7.1 MILLION MT                   622 BILLION KES
 OF SWPS
 (COST: 9.6 BILLION KES)

 EXTEND RISK SHARING
 AGREEMENT TO FINANCIAL
 INSTITUTIONS TO ENABLE                171 K UNITS SOLD                  4.4 MILLION MT                   388 BILLION KES
 BETTER FINANCING OF SWPS
 (COST: 480 MILLION KES)

 RAISE AWARENESS OF THE
 BENEFITS OF SOLAR
 IRRIGATION                            119 K UNITS SOLD                  3.1 MILLION MT                   271 BILLION KES
 (COST: 318 MILLION KES)

 PROVIDE FINANCIAL SUPPORT
 TO INCREASE ACCESS TO
                                       154 K UNITS SOLD                  4.0 MILLION MT                   347 BILLION KES
 WATER SOURCES
 (COST: 2.8 BILLION KES)

 BASE CASE – GROWTH
 WITHOUT POLICY                        103 K UNITS SOLD                  2.7 MILLION MT                   261 BILLION KES
 INTERVENTIONS

FIGURE 5: IMPACT OF EACH POLICY INTERVENTIONS IN TERMS OF SWPS SOLD, TOTAL FOOD PRODUCTION IN 5 YEARS AND INCREASE OF SMALL-HOLDER FARMER
INCOMES

                                                                    8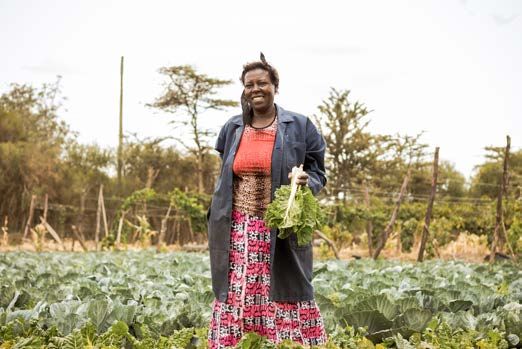
INTRODUCTION

     OBJECTIVE

This policy brief aims to show the positive business case for stimulating the growth of the Solar Water Pump (SWP)
Market in Kenya. The policy brief has four main sections:
    Current Market and Constraints: A projection of the market size for SWPs for the period 2020 – 2030,
    including an assessment of the constraints to the market being able to scale.
    Policy Recommendations: The business case for a set of high priority policy interventions to increase uptake of
    SWPs, and thereby drive increased irrigation and food security.
    Aggregate Impact: An assessment of the impact of SWPs and these policy interventions on smallholder farmers
    (SHFs) yield and income over the period 2020 – 2030.
    County Roll-out: The projected uptake per county under a ‘combined interventions’ scenario, along with a
    deep dive on a selected county.

This policy brief highlights the impact, potential scale of opportunity, and policy recommendations for solar
irrigation technologies in Kenya. This brief was commissioned by Mercy Corps AgriFin Accelerate (AFA) and was
developed by Dalberg.

     CONTEXT

Kenya has less than 5.5M hectares of arable land of which only 17% is suitable for rain-fed agriculture. This land
                                                 9
currently supports 80% of the rural population. Furthermore, productive crop areas are shrinking. To achieve
                                                                        10
national food security goals, SHFs, who produce 78% of Kenya’s food, need to embrace ways to increase yields
and to increase the area under cultivation. Agriculture is also a backbone of the economy - accounting for 26% of
                                                   11
Kenya’s GDP directly and another 27% indirectly.

However, today just under 3% of Kenya's arable land (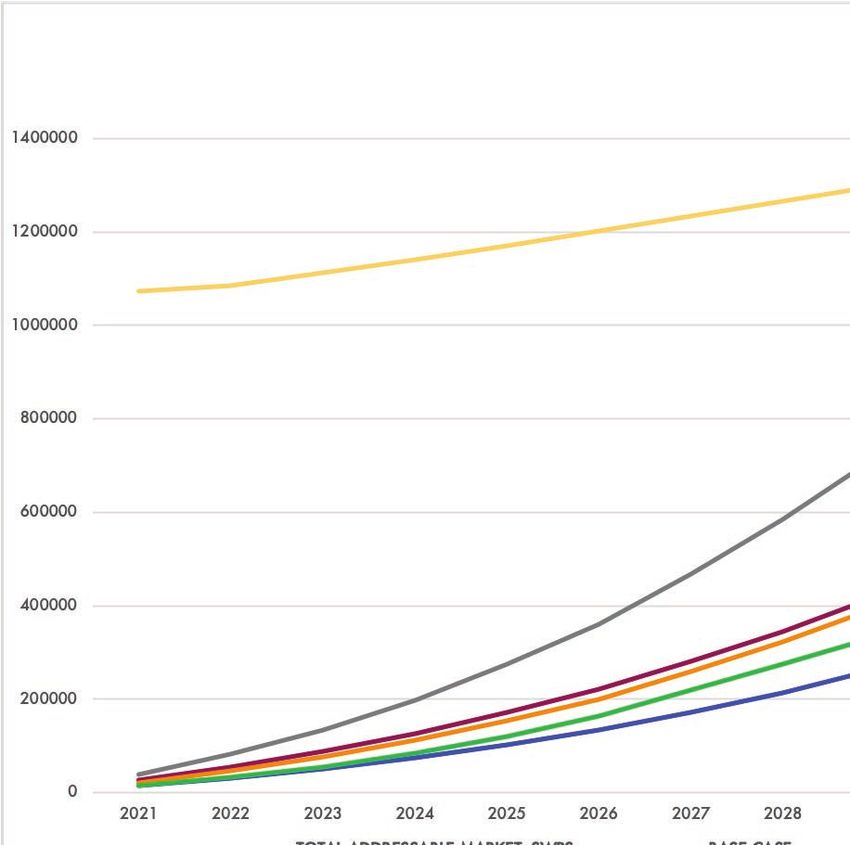
The solar water pump can play a critical role in improving the incomes
and resilience of rural households while unlocking environmental benefits. % OF CULTIVATED LAND
UNDER IRRIGATION PER
Solar water pumps have the potential to increase yields two to four-fold COUNTY
16
depending on crop and climate. Solar water pumps also expand
17
seasonal growing cycles and mitigate periods of low or irregular rainfall.
Off-cycle planting with SWP generates additional income, hence creates
greater general resilience for farmers by creating more wealth. This
provides households with increased and more predictable disposable
income to pay for other outgoings and save for emergencies, thereby
18
reducing vulnerability to risks. With more stable income flows, farmers can
0-1%
progress up the “agricultural productivity ladder”, making further 1-5%
investments in machinery, inputs and technology. However, affordability, 5-10%
limited awareness, and unreliable water access remain critical barriers to 10-20%
>20%
the uptake of solar irrigation technologies in Kenya. Accelerating the
FIGURE 6: IRRIGATED LAND PER COUNTY
uptake of SWPs could create a large impact on yield, income, and IN KENYA
contribute to addressing the food security challenge in Kenya. To do so,
the aforementioned barriers need to be addressed, and government as well as donors have a significant role to
play.
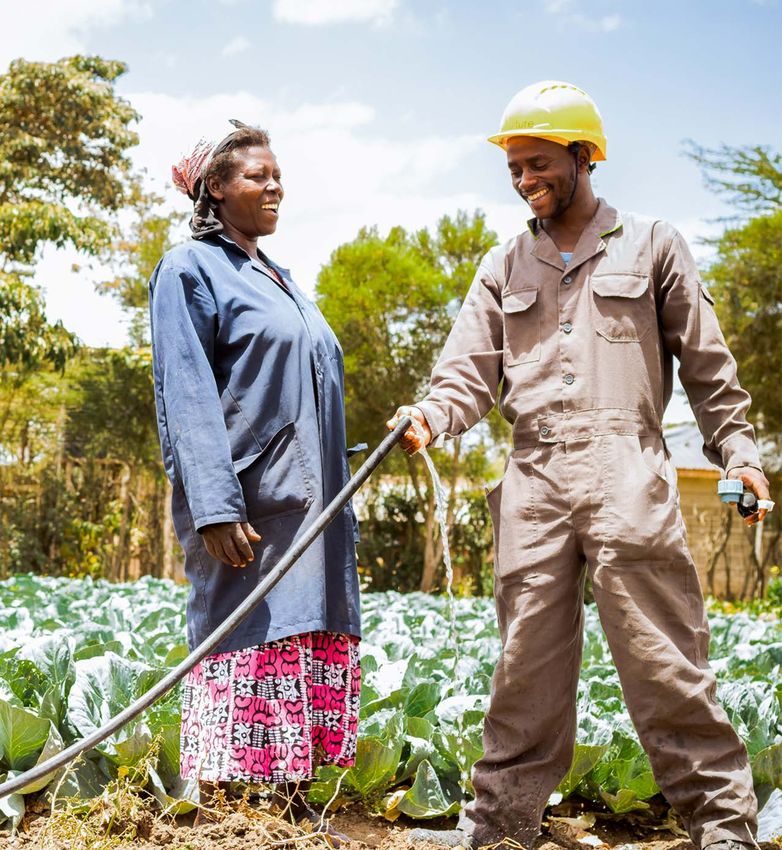
CASE STUDY: DAVID MUTUGA
David Kirubi Mutuga is a full time farmer who owns 3 acres, 1 cow
and 17 rabbits. He is cropping cabbages and potatoes. Before
purchasing a solar water pump, David was using a petrol generator
and was fetching water manually for his agricultural and domestic
activities. Thanks to his solar water pump, he significantly increased
the irrigation of his farm with 2500L of water per day.
David improved the yield of his farm (from 80 bags of potatoes to
120). He is now able to use water during dry season. David also
increased his income by ten times. During dry season one cabbage
is worth KES 50, while in rainy season it is worth KES 5. David is
also reporting an increase of KES 40,000 for potato cropping.
Because he is not using a petrol generator anymore, he is saving
roughly KES 500 per week in petrol costs.
METHODOLOGY
This paper aims to demonstrate the value of various policy interventions to accelerate the uptake of SWPs. To do
so, we have estimated the difference between baseline uptake and the estimated uptake with various policy
interventions, then calculated the estimated impact in terms of food production, yields, resilience, and farmer
income. The assessment utilizes data on income distribution at a sub-location level (for 6000+ unique regions
across Kenya), off-grid data based on nighttime lighting (NTL) from satellite imagery, water access availability per
source (e.g. borehole, well, tank, etc.), and crop data from the Ministry of Agriculture and the Food and
Agriculture Organization. A number of industry players were also interviewed to understand the most significant
bottlenecks faced, and to understand what could drive uptake and thus impact for smallholder farmers.
16. Efficiency for Access Coalition. Solar Water Pump Outlook 2019: Global Trends and Market Opportunities, 2019
17. Ibid
18. Ibid
10CURRENT SOLAR IRRIGATION MARKET & CONSTRAINTS
There is high potential for small holder farmer-led irrigation to be a route to increasing food resilience in Kenya.
19
97% of Kenya’s agriculture is rain-fed with just 3% of arable land irrigated. This makes Kenyan farmers highly
susceptible to climate change and climate variability including seasonal rainfall and increased frequency and
intensity of extreme weather and climate events such as droughts.
Additionally, a rapidly growing population exacerbates Kenya’s food security situation. For instance, due to
Kenya’s slowing production growth, the country will need to increase maize supply by 27% over 2016-2022 to
20
satisfy its 2022 domestic needs. Kenya, currently imports 29% of its maize, 82% of its wheat, and similarly 82%
21
of its rice – the three most popular staples. As a result, the country faces an increasingly challenging task to feed
its rapidly growing population. High competition over limited water resources and a need to consider the
environmental sustainability of agricultural investment mean water-efficient, advanced irrigation systems are
22
increasingly in demand.
KENYAN IRRIGATION LANDSCAPE
The current market for solar irrigation products is nascent and structured around both public and private players,
with significant potential to scale. Currently, irrigation development is led by the private sector and by smallholder
irrigation schemes with particular emphasis on sustainable development. The private sector has spearheaded
irrigation development in areas close to urban centers for local vegetables and high-value horticultural produce
23
for the export market.
Several international development agencies run limited technical cooperation programs on distributed solar
systems; however, the existing incentives from these programmes are targeted more broadly at solar home
systems rather than solar water pump irrigation. A non-exhaustive table of major players in the irrigation space is
highlighted below.
OVERVIEW OF KEY ACTORS (NON EXHAUSTIVE)
Key activities in the private sector focus mainly on distribution, delivery of irrigation
SWP solutions and technology, equipment maintenance, as well as extending credit to
SUPPLIES farmers to purchase a SWP.
Financial institutions provide loan products to farmers, including asset financing.
FINANCIAL However, these institutions rarely extend financing to small-holder farmers due to
INSTITUTIONS the default risks. Juhudi Kilimo recently launched one of the first credit facilities for
solar irrigation in Kenya
Government-led, multi-stakeholder platforms to facilitate private sector collaboration
REGULATORY aimed at increased sustainable water access focused on ground water
BODIES management, industrial water use efficiency & surface water quality management
IFIS/ Development agencies and non-profits tackle a wide range of issues including
funding for irrigation projects and water management solutions
DONORS
FIGURE 7: MAP OF KEY ACTORS IN THE KENYAN IRRIGATION LANDSCAPE
19. 2030 Water Resources Group. Agricultural and Irrigation opportunity in Kenya, 2016
20. Agricultural Sector Transformation and Growth Strategy. Towards Sustainable Agricultural Transformation and Food Security in Kenya 2019-2029, 2019
21. US Dept of Trade. Kenya Country Commercial Guide, accessed 2019. Export.gov
22. FAO. Kenya: Irrigation Market Brief, 2015
23. Ibid
11There are a wide range of solar water pumps available in the market: electric-only, diesel, solar water pumps,
human-powered manual pumps and wind-powered water pumps. This policy brief will focus on solar water pumps
(SWPs) that have a lower cost of operation that the other options available in the market, as well as their ability to
operate off-grid across Kenya. In addition, SWPs can unlock environmental benefits due to no ongoing emissions,
and a longer product lifetime.
CONSTRAINTS TO SOLAR WATER PUMP UPTAKE
Three major constraints slow the uptake of solar irrigation: (i) Affordability, (ii) Awareness and (iii) Water
Access:
AFFORDABILITY
Affordability remains one of the greatest challenges to growing the market for solar water pumps. Of the 2 Million
off-grid rural households with access to water in Kenya, 800,000 cannot afford a pump – even if payments are
24
made over multiple years and a large proportion of income is allocated to this. A study of the Kenyan solar water
25
pump market found the lack of smallholder financing for irrigation was a key obstacle to solar water pump sales.
26
SHFs cite price as the most important driver of whether or not to purchase, when selecting a pump.
AWARENESS
Despite solar water pumps being available in the market for a number of years, awareness of solar technology,
and specifically its use to power water pumps, remains limited in many markets. In East Africa, although 64% of
solar water pump customers had owned a solar lighting product before purchasing a solar water pump, 57% of
this ‘well informed’ segment did not know solar technology could be used for irrigation. Furthermore, awareness
of the spectrum of modern irrigation solutions, and the full extent of the potential benefits of irrigation, also remains
27
limited. The consequence of this is that each company individually has to educate consumers on the existence,
benefits and use of these technologies. This adds to the complexity and costs of operations as most of these
consumers are typically located in rural areas and are hard to access. One local water pump distributor currently
spends 10% of the sales price on marketing and consumer education (much higher than other durable goods).
Given the low level of awareness in the market, there is a high level of marketing and education expense required
for first movers in the market to influence consumers to pay; and much of the return on this investment could be
captured by their competitors. A government-led awareness campaign for all market players will therefore
generate a positive externality, expanding the market for everyone.
WATER ACCESS
Solar water pump reliance on nearby access to water (e.g. borehole, river, dam, well) presents a significant
constraint to its uptake. In Kenya, the majority of irrigation is currently by surface water (87% of current hectares
28
under irrigation), but there could be a significant increase in sustainable groundwater usage for irrigation.
Aktchenko (2014) estimated that between 173,000 and 447,000ha could be irrigated, sustainably, using
29
ground water in Kenya (up from 20,000ha). The expansion of access to groundwater is a critical factor if the
area under irrigation is to be increased and the uptake of solar water pumps is to be accelerated. The average
30
cost of digging a borehole of 150 meters is USD 16,800 – far beyond the affordability of a SHF household.
Expanding groundwater access requires significant coordination between national and county governments to
31
ensure sustainability.
24. See annex for full assumptions. Payments made over 18-30 months and 30% of income dedicated to repayments. 28. FAO, Aquastat database, most recent figure (2010)
25. Solar World Congress. Accelerating Solar Water Pump Sales in Kenya: Return on Investment Case Studies, 2017. 29. Ibid
26. Efficiency for Access Coalition. Solar Water Pump Outlook 2019: Global Trends and Market Opportunities, 2019 30. FAO. Kenya: Irrigation Market Brief, 2015
27. Ibid 31. This constraint is incorporated in the assumptions when calculating the addressable market of SWPs
12RECOMMENDATIONS FOR POLICY INTERVENTIONS
The adoption of policy incentives will, in the short to medium term, promote the uptake of solar irrigation products
in Kenya. The massive scaling of solar irrigation technologies could make a significant contribution to Kenya’s
food security goals. Irrigation also features strongly in the government’s Agriculture Sector Transformation and
Growth Strategy (ASTGS).
An ‘average’ SHF household’s disposable income is expected to rise by 177% with the purchase and appropriate
use of solar water pumps, although there is wide variation based on the usage, crops grown, and additional
choices made (e.g., switching to higher value crops). This increased income can go towards further investments in
the farm, as well as towards improvements in the household’s financial stability and quality of life (e.g., school
fees, medical expenses) and savings that would enhance the household’s resilience to shock.
There is a strong case for policy / development partner interventions to accelerate the uptake of SWP. Given the
challenges identified, we explore several policy interventions. The interventions fall in three major categories:
Increasing the affordability of solar irrigation technologies
Raising awareness of solar irrigation products among SHFs
Increasing reliable water access for SHFs
For policy intervention options under these categories, we have assessed the potential impact on food production,
SHF income, estimated the cost of implementation, and assessed the impact and return on each intervention.
13INTERVENTION 1: DESIGN A TARGETED INCENTIVES & SUBSIDY SCHEME
DESIGN A TARGETED INCENTIVES / SUBSIDY SCHEME FOR SMALL HOLDER FARMERS FOR PURCHASE
OF SWPS
Affordability remains one of the greatest challenges to growing the market for solar water pumps, with a small
32
pump costing the equivalent of about 6–12 months of income for a typical small holder-farming household.
33
Government support for a targeted subsidy program could incentivize distribution.
A targeted subsidy scheme of 50% of the cost of an approved SWP system, would enable SHFs to increase yields
whilst unlocking benefits (increased SHF income) of KES 622 Billion over 5 years. This incentive scheme has been
projected as KES 1,950 per household per month and is expected to increase the uptake of SWP 2.7 times over
base case. The financial incentive would be a temporary measure applied per solar water pumping system, aimed
at expanding the market to a self-sustaining level; at which point economies of scale could continue to reduce the
cost for consumers. It is anticipated that the government would re-apply taxes from Year 6 onwards. Due to
increased market share for SWPs, the government would be able to recover funds initially dedicated to the
subsidy scheme through taxation after year 5.
To note, the global uptake of solar products has been largely driven by subsidies that have effectively stimulated
development and attracted private investors. Subsidies were able to effectively stimulate development of solar and
attract private investors, enabling a price reduction from $3 per watt in 2000, to $0.4 per watt less than 20 years
34
later.
EXPECTED IMPACT
A targeted subsidy scheme is expected to increase uptake of SWPs by 274,000 units while unlocking benefits of
7.1 Million MT of food production over 5 years. A cumulative increase in SHF income of 622 Billion KES is also
estimated.
% of HOUSEHOLDS THAT WILL PROJECTED INCREASES IN AVERAGE
PURCHASE A SWP AFTER SUBSIDY SHF YIELD AND INCOME OVER 10
SCHEME 50 YEARS 46
40
30
30 23
20
10
0
2020 2021 2022 2023 2024 2025 2026 2027 2028 2029 2
2030
0
20.8-29.9%
29.9-31% FIGURE 9: PROJECTED AVERAGE ANNUAL YIELD INCREASE IN FOOD PRODUCTION OVER
31-33.2% 10 YEARS UNDER THE SUBSIDY SCHEME (MILLION MT)
33.2-35.7% 2738
3,000
35.7-38.1%
1916
38.1-39.3% 2,000 1523
39.3-41.3%
1,000
41.3-42.3%
0
2020 2021 2022 2023 2024 2025 2026 2027 2028 2029 2030
FIGURE 8: PERCENTAGE OF OFF GRID, RURAL
HOUSEHOLDS WITH WATER, PER COUNTY THAT ARE
LIKELY TO PURCHASE THE SWPS AFTER A SUBSIDY FIGURE 10: PROJECTED AVERAGE ANNUAL INCREASE IN AGGREGATED SHF INCOME
SCHEME UNDER THE SUBSIDY SCHEME (BILLION KES)
32 .The Human Account, 2019; Dalberg analysis
33. Efficiency for Access Coalition. Solar Water Pump Outlook 2019: Global Trends and Market Opportunities, 2019
34. Power for All. Investor Position Paper: Unlocking Private Capital for Mini-Grids in Africa, accessed 2019
14ESTIMATED COST
The expected cost of implementing the targeted subsidy scheme is KES 9.6 Billion over five years compared to
KES 622 Billion increase in small-holder farmer's income.
IMPLEMENTATION CONSIDERATIONS
The targeted subsidy scheme should adhere to smart subsidy design principles outlined below:
Target specific areas: Testing the subsidy in one county, and then expanding once the approach is refined,
would reduce the risk of the subsidy not being provided in a timely fashion, or its implementation being tied up
in red tape. There will be natural variation in the specific target market in different regions of the county.
Design a market-based solution: The scheme should utilize and support the further development of existing
private input supply networks, rather than supplant them with state-controlled distribution systems or mass
government purchasing. This enhances the efficiency of input delivery as well as increases the likelihood that
the scheme has a sustained impact after its termination.
Link to payment by the customer: Payment subsidy is paid on a monthly basis and is only paid if the customer
also pays their share of the cost. This incentivizes good credit management and follow-up practices from the
solar water pump distributor. Over time the farmer will see the increase in yield and be continually educated
about the benefits of irrigation. If the farmer stopped paying, the equipment would be returned to the
distributor.
Define a clear exit strategy: The scheme should ensure it has a credible time limit on the support offered (e.g.
five years, which could be rolled out county by country in partnership with distributors.) SHFs have the
opportunity to be subsidized for one solar water pumping system; after which we expect the increase in yields
to cover the cost of a replacement or additional pumps.
This subsidy could be financed by government or donors; organisations like the World Bank have already shown
interest in supporting the roll out of similar products, such as those for solar home systems.
CASE STUDY: INDIA
To enhance farmers’ financial and water security, the Indian government launched a subsidy scheme to promote the
installation of three different components – commissioning of grid-connected solar power plants, installation of stand-
alone solar water pumps and solarization of grid-connected pumps The subsidies covered between 50%-70% of total
cost and are aimed at the installation of standalone water pumps to replace diesel powered agricultural plants, and
solarization of grid connected pumps. Farmers are required to pay only 40% of the cost of the standalone solar pump,
with only 10% paid upfront. New installations of solar water pumps rose by 108% CAGR, from 1,055 units in 2012 to
35
41,479 units by November 2018.
CASE STUDY: TOGO
In March 2019, Togo became the first government in Africa to introduce a subsidy programme for solar energy
payments. The government awarded BBOXX (Joint Venture with EDF Group) a tender to provide solar home systems for
300K households. The government awarded a similar contract to Soleva in August 2019. Government will issue
monthly vouchers to households with a BBOXX or Soleva system, which covers the cost of the system – household only
36
has to pay the cost of energy consumption.INTERVENTION 2: INCENTIVIZE FINANCIAL INSTITUTIONS
INCENTIVIZE FINANCIAL INSTITUTIONS TO EXTEND CREDIT TO SHFS FOR SWPS
The credit market for SMEs in Kenya is currently constrained by high interest rates and a risk-aversion to lending to
SHFs, thus limiting access to much needed financing. Increasing access to finance for farmers through a 50:50
loss sharing scheme would increase the supply of corporate finance in the space and accelerate the growth of the
38
solar water pump market.
A risk-sharing scheme on loans for SWP could incentivize banks and MFIs to provide credit for this purpose, or to
allocate funding from their existing agriculture credit guarantees towards SWP purchase. Current repayment rates
in the industry are around 85-90%. This intervention has been modelled as the government (and/or donors)
shares the cost of defaults 50:50 with the financier. Bringing in external finance allows greater capital into the
industry and the repayment term length to be extended from 30 to 36 months, thus bringing down the monthly
cost to the SHF by 20% and increasing uptake.
EXPECTED IMPACT
The risk-sharing scheme is expected to increase the number of SWPs over base case reaching 171,000 units over
5 years. This increase in uptake is expected to result in increased food production to 4.4 Million MT by 2025,
and a KES 388 Billion increase in SHF income.Whilst the figures are based on affordability constraints, to mass
scale SWPs in Kenya, far greater financing will be required than can be provided by the distributors themselves –
so linking with financiers will be essential.
PROJECTED INCREASES IN AVERAGE PROJECTED INCREASES IN AVERAGE
SHF YIELD OVER 10 YEARS SHF INCOME OVER 10 YEARS
40 36 2,500 2234
30 28 2,000 1753
23 1523
1,500
20
1,000
10 500
0 0
2020 2021 2022 2023 2024 2025 2026 2027 2028 2029
29 2030 2020 2021 2022 2023 2024 2025 2026 2027 2028 2029
29 2030
FIGURE 12: PROJECTED AVERAGE ANNUAL YIELD INCREASE OVER 10 FIGURE 13: PROJECTED AVERAGE ANNUAL INCREASE IN SHF INCOME
YEARS UNDER THE RISK-SHARING SCHEME (MILLION MT) UNDER THE RISK-SHARING SCHEME (BILLION KES)
ESTIMATED COST
The expected cost of running a risk-sharing scheme is KES 480 Million over five years compared to KES 388
Billion increase in small-holder farmers income.
38. Efficiency for Access Coalition. Solar Water pump Outlook 2019: Global Trends and Opportunities, 2019
16IMPLEMENTATION CONSIDERATIONS
Ensure product quality: To mitigate against potential loss arising from sub-standard pumps, and to help with de-
39
risking for financial institutions, it is vital that pumps bought by consumers are appropriate long-term investment.
This can be ensured by requiring pumps bought from loaned funds are high quality (e.g., those with GOGLA
certification as an industry standard for all imported and locally manufactured pumps).
Link first to a pilot: At present, distributors provide their own financing to customers, to support the pay-as-you-
go model. Banks are reluctant to lend to SHFs; and this is made more difficult by the need for a close
relationship between originator of the loan (i.e., the distributor) and the financier – for example, if the SWP is
not correctly serviced by the distributor, then default rates will rise. A supported upfront pilot will be needed to
confirm the operational challenges of financiers providing the funds for the SWP
Use a range of financial services platforms: Given the local expertise to understand county-level agricultural
risk, the financiers could be MFIs, banks with significant agricultural expertise, or innovative platforms (e.g.,
crowdfunding). Simply aiming for a single national bank may not be the most effective way to launch.
Provide the financing to the SHF, not the SWP company: To scale, SWP distributors will need to focus on their
own specific elements of the value chain – such as originating new business, and SWP maintenance. If
financing is provided to the SHF (for use for purchasing a SWP), then they can build credit history, and a
relationship with the financial institution themselves.
CASE STUDY: NIGERIA
Nigeria's Loan Guarantee Facility (LGF) is one of the oldest operating LGFs in developing economies started in 1977
with 60 per cent funding from the Nigerian Government and 40 per cent from the Central Bank of Nigeria (CBN). The
fund provides guarantees for loans to agricultural producers and processors. The model allows the farmer to jointly
apply for a guarantee together with the lending bank. The CBN also manages the system. This fund has very favorable
terms and conditions, with 75 per cent coverage of the principal in case of default plus reimbursement of interest up to a
40
level matching the interest income from non-due loans. The daily operations are under the CBN. Findings reveal a
positive and significant relationship between this model, and the agricultural sector development evaluated by the
41
sustained rise in its contribution to GDP.
FIGURE 14: CASE STUDY ON RISK-SHARING
39. Certifications or pre-qualification of products are critical to manage one part of risks for banks (i.e., product failing, hence SHF not benefiting from it and not getting extra income to replay
40. IFAD. Results-based Financing for Energy Access, How to Design and Implement Projects: Lessons from the Field, 2018
41. Billy, Akaninyene Orok. The Impact of Agricultural Credit Guarantee Scheme Fund for Agricultural Sector Development in Nigeria, 2016
17INTERVENTION 3: CONDUCT A TARGETED AWARENESS AND
EDUCATION CAMPAIGN
CONDUCT A TARGETED AWARENESS AND EDUCATION CAMPAIGN OVER THE NEXT FIVE YEARS TO
RAISE AWARENESS OF BOTH THE SHORT-TERM AND LONG-TERM BENEFITS OF SOLAR IRRIGATION
PRODUCTS AMONG SHF
Despite solar water pumps being on the market for a number of years, awareness of solar technology, and
specifically its use to power water pumps, remains limited. Convincing farmers of the value of the technology
requires time, with more education needed on how the product works and in particular how it can benefit their
farms.
A variety of interventions, e.g., integrating SWPs technical operation and benefits in curriculum for government
extension workers, funding radio campaigns – particularly directed at those stations with a large small holder
farmer audience (e.g., Radio Citizen or Radio Jambo, and regional radio stations e.g., Kameme FM, Kass FM),
including demonstrations and education materials on SWPs operations and benefits in regional and national
agricultural shows, and working with county level agricultural officers to sensitize local SHFs on the benefits of
SWPs could drive up awareness and accelerate uptake of SWPs.
EXPECTED IMPACT
We expect a much swifter uptake towards the total addressable market; realizing the levels projected in seven
years rather than ten. This would include those within reach of water and those who can afford a pump.
PROJECTED INCREASES IN AVERAGE PROJECTED INCREASES IN AVERAGE
SHF YIELD OVER 10 YEARS SHF INCOME OVER 10 YEARS
40 36 2,500 2162
30 26 2,000 1723
23 1523
1,500
20
1,000
10 500
0 0
2020 2021 2022 2023 2024 2025 2026 2027 2028 2029
9 2030 2020 2021 2022 2023 2024 2025 2026 2027 2028 2029
29 2030
FIGURE 15: PROJECTED AVERAGE ANNUAL YIELD INCREASE OVER FIGURE 16: PROJECTED AVERAGE INCREASE IN INCOME OVER CURRENT
CURRENT FOOD PRODUCTION UNDER A TARGETED AWARENESS AND INCOME LEVEL, UNDER A TARGETED AWARENESS AND EDUCATION
EDUCATION CAMPAIGN (MILLION MT) CAMPAIGN (BILLION KES)
ESTIMATED COST
The expected cost of implementing the government-led awareness-building campaign is KES 318 Million over five
years (inclusive of payment for large-scale awareness campaigns) compared to KES 271 Billion increase in
income for small-holder farmers.
18IMPLEMENTATION CONSIDERATIONS
Consider partnerships with private sector players: There are far fewer government extension workers than is
optimal (currently a ratio of 1000 farmers to one extension worker). Many private companies also hire
extension workers for particular areas and value chains (e.g., other inputs providers, or major off-takers). There
could also be an opportunity to add content to existing digital training platforms (e.g., iShamba, iCow, or
Arifu).
Ensure product quality: To mitigate against negative consumer experience and to build trust, it’s vital that
consumers are educated on which pumps will be an appropriate long-term investment (e.g., by adopting
GOGLA certification as an industry standard for all imported and locally manufactured pumps).
INTERVENTION 4: PROVIDE FINANCIAL SUPPORT FOR INCREASING ACCESS
TO APPROPRIATE WATER SOURCES
PROVIDE FINANCIAL SUPPORT FOR INCREASING ACCESS TO APPROPRIATE WATER SOURCES
42
In Kenya, an estimated less than 29% of SHF households have reliable water access for irrigation. Increasing
water access has the potential to both increase SHF household resilience to variable weather and stimulate the
uptake of solar irrigation equipment.
The government has an important role in increasing access to water sources through funding critical water access
infrastructure, particularly digging of wells and boreholes, and construction of dams and water pans. Reliable
water access will drive uptake by increasing the total addressable market for solar irrigation technologies. Solar
water pumps can also help Kenya reach its water access objectives, provide more affordable and effective ways
for smallholder farmers to tap into water for domestic and productive use, in addition to increasing the resilience
of the national food system.
EXPECTED IMPACT
Increasing reliable water access by 25% is estimated to increase SWP uptake to 154,000 over five years.
Projected increase in SHF income and yield is outlined below.
PROJECTED INCREASES IN AVERAGE PROJECTED INCREASES IN AVERAGE
SHF YIELD OVER 10 YEARS SHF INCOME OVER 10 YEARS
40 36 2,500 2326
30 27 2,000 1781
23 1523
1,500
20
1,000
10 500
0 0
2020 2021 2022 2023 2024 2025 2026 2027 2028 2029
29 2
2030
30 2020 2021 2022 2023 2024 2025 2026 2027 2028 2029
9 2030
FIGURE 17: PROJECTED AVERAGE ANNUAL YIELD INCREASE OVER FIGURE 18: PROJECTED AVERAGE ANNUAL INCREASE IN SHF INCOME OVER
CURRENT FOOD PRODUCTION WITH RELIABLE ACCESS TO WATER CURRENT LEVEL WITH RELIABLE WATER ACCESS (BILLION KES)
(MILLION MT)
ESTIMATED COST
The estimated cost of providing direct financial support for water access (e.g., the digging of boreholes and construction of water
storage infrastructure) is estimated to be KES 2.8 Billion over five years compared to KES 347 Billion increase in small-holder
farmers income.
42. Figures based on data collected from the 2009 Census. A more in-depth analysis could be performed based on ground water and surface water data
19IMPLEMENTATION CONSIDERATIONS
A major consideration is ensuring that the design of the financial incentive scheme adheres to the design principles
of a smart subsidy.
Targeting specific farmers to promote pro-poor growth: Testing the subsidy in one county for a specific group
of farmers and then expanding once the approach is refined, would reduce the risk of the subsidy not being
provided, or its implementation being tied up in red tape
Market-based solutions: The scheme should utilize and support the further development of existing private input
supply networks. This enhances the efficiency of input delivery as well as increase the likelihood that the
scheme has a sustained impact after its termination; as well as supporting the up-scale of effective market-
based water access schemes
Developing an exit strategy: The scheme should ensure it has a credible time limit on the support offered (the
current approach assumes that the water access incentives are provided in the first year, to maximize benefits
over time)
Another consideration is the need to institute a national water management strategy to ensure sustainability and to
prevent depletion. Given the various steps that need to be met to complete this particular intervention, it is
important to acknowledge that implementation could be challenging and would need to be rooted in the local
context for increased water access. Several challenges could limit the implementation such as managing the stock
43
of irrigation equipment and ensuring access to remote population. However, its impact on national food security
and on both SHFs income are potentially extremely high.
CASE STUDY: SRI LANKA
The government of Sri-Lanka launched a national agro-well programme in the late 1990s in conjunction with donors,
supporting construction of ~50K wells in the country’s Dry Zone by 2000. Starting in 2000, government provided
subsidies for micro-irrigation systems (pump, filter, drip irrigation). One surprising finding was that based on a
representative survey of pump users conducted after the subsidy scheme was conducted, 72% of pump users had
invested their own resources in the pump, and just 25% benefited from the subsidy. The authors concluded that the
44
subsidy programme had helped upscale the technology, by encouraging a larger, broader community to self-finance.
FIGURE 19: CASE STUDY ON FINANCIAL INCENTIVES FOR WATER ACCESS
43. 2030 Water Resource Group, Agricultural & Irrigation Opportunity, 2030 WRG Roundtable #3, Moving towards Solutions
44. Mechanizing Water Lifting through Pumps (2019); A Case Study in Sri Lanka; IWMI & CGIAR Working Paper 188 p30
20ADDITIONAL ENABLING INTERVENTIONS
ADDITIONAL ENABLING INTERVENTIONS
The major interventions proposed above could significantly stimulate the market in a relatively short period of
time. There are other interventions that would create a better enabling environment overall, but not be sufficient in
themselves to drive uptake. These include the following:
KEY
INTERVENTION
CONSTRAINT
Streamline exemptions processing: A single point of contact at each government agency
(Ministry of Energy, Ministry of Agriculture, Kenya Revenue Authority) would speed up
processing time, reduce paperwork within government, and reduce the management overhead
required to process these exemptions
AFFORDABILITY Removal of remaining taxes: VAT, Import Duty, & Railway Development Levy comprise ~8.5%
of the total cost of a pump, which could be removed
Subsidy for local manufacture of components: Some parts of the kit are suitable for local
manufacture (e.g., piping). However, for the majority, the sub-scale nature of the specialist
manufacturing required (e.g., solar panels), means this would only be feasible once the market
was at scale
Publicized government endorsement: To educate farmers of the benefits of solar water pumps
Quality approval: Maintaining a quality mark for water pumps (e.g., based on GOGLA
AWARENESS
certification) could ensure that as the market increases in size, it is not poorly functioning
pumps which are purchased (which would reduce willingness of farmers to invest).
Enact a comprehensive water management policy: Coordinating amongst the various actors is
WATER key to ensure that the available water is used effectively
Digitize and make water table data and borehole location public: Allowing farmers an
ACCESS understanding of the depth that a borehole would be required; would allow them to make a
more informed decision on how to source water for irrigation
FIGURE 20: ENABLING INTERVENTIONS, TO SUPPORT BROADER UPTAKE
FUNDING OF THE INTERVENTIONS
These interventions aim to be achieve positive financial returns for government investment over time. The initial
investment could be paid for in the following ways:
45
Reallocation of subsidies: Kenya spends 9.0bn KES ($89m) annually on input subsidies A percentage of the
funds allocated to the subsidy scheme could be reallocated to fund a subsidy scheme for the purchase of
SWPs targeting SHF
Paid for out of the national budget: Significant funds have already been allocated to advance the Big Four
pillar of food security. In FY19-20 the annual Kenyan budget for the Big 4 Agenda was 450.2bn KES, and
46
within this agriculture/food security was allocated 55.97bn KES. Irrigation was given a specific budget within
this of 7.9bn KES, for support to ongoing projects. The government could capitalize on these funds to drive
irrigation as a high ROI investment.
External funding: Expanding food security and small holder output aligns with donor interests; furthermore,
similar programmes have benefited from donor funding (e.g., the KOSAP programme to expand solar home
systems in Kenya)
45. Birch 2018
46. Kenyan Budget 2019-2020
21AGGREGATE IMPACT
The combined policy interventions will result in significant impact in terms of market growth, yield, income and
food security and resilience.
IMPACT OF MARKET GROWTH
Each policy intervention will boost the uptake of SWPs. A 50% subsidy scheme will have the largest impact on the
uptake of SWPs driven both by new customers that could afford SWPs and customers that are now willing to
spend on a SWP. Implementing credit financing will contribute to a 20% decrease of the cost of a SWP, therefore
increasing the uptake of SWPs. By supporting 40% of the costs of irrigation equipment (and thus boosting water
access), the government can play a significant role in driving uptake for SWPs over the next ten years. Finally, the
awareness campaign will speed up the increase of uptake over time.
CUMULATIVE UPTAKE OF SWPS IN KENYA FOR EACH POLICY INTERVENTION (NO OF HHS)
FIGURE 21: CUMULATIVE UPTAKE OF SWPS IN KENYA FOR EACH POLICY INTERVENTION (NO OF HHS)
22Figure 22 illustrates the cumulative impact of several policy interventions. Due to projected cannibalization, the
uptake of SWPs under cumulative policy interventions will not equal to the sum of individual policy interventions.
For instance, implementing a subsidy scheme and facilitating credit financing do not translate to an entirely
additive number of customers that purchase SWPs due to diminishing returns.
CUMULATIVE UPTAKE OF SWPS UNDER COMBINED POLICY INTERVENTIONS (NO. OF HHS)
FIGURE 22: CUMULATIVE UPTAKE OF SWPS UNDER COMBINED POLICY INTERVENTIONS (NO. OF HHS)
23IMPACT IN TERMS OF YIELD AND INCOME
AGGREGATED YIELD IMPACT AFTER A AGGREGATED YIELD IMPACT AFTER A
SUBSIDY SCHEME (THOUSAND MT) CREDIT SUBSIDY SCHEME (THOUSAND MT)
0-25 0-25
25-50 25-50
50-100 50-100
100-250 100-250
250-500 250-500
500-750 500-750
750-1000 750-1000
>1000 >1000
AGGREGATED YIELD IMPACT AFTER A AGGREGATED YIELD IMPACT AFTER
AWARENESS CAMPAIGN (THOUSAND MT) FINANCIAL ACCESS TO WATER
(THOUSAND MT)
0-25 0-25
25-50 25-50
50-100 50-100
100-250 100-250
250-500 250-500
500-750 500-750
750-1000 750-1000
>1000 >1000
FIGURE 23: AGGREGATED IMPACT IN TERMS OF YIELD PER COUNTY UNDER COMBINED POLICY INTERVENTIONS 1,2,3 AND 4 (THOUSAND METRIC
TONS)
INCREASE IN SHF YIELD (MT/HECTARE) INCREASE IN SHF INCOME (THOUSAND KES)
23 23
PROJECTED YIELD FOR 100 AVERAGE INCOME PER 750
SHF 61 97 SHF 384 707
INCREASE OF YIELD DUE
75
IRRIGATION YIELD 500 +384
TO IRRIGATION INCREASE
50
68
INCREASE OF YIELD INCOME INCREASE 250
FROM SWITCHING TO 25 16 FROM SWITCH TO 255
HIGHER VALUE CROP 20 HIGHER VALUE CROP
0 0
TOTAL YIELD FOR AN SHF TOTAL INCOME PER SHF
AFTER PURCHASE OF A AFTER PURCHASE OF
SWP SWP +68
FIGURE 24: BREAKDOWN OF THE MAIN DRIVERS OF YIELD (MT/HECTARE) AND INCOME INCREASE (THOUSAND KES) FOR SMALL-HOLDER FARMERS IN KENYA
24IMPACT IN TERMS OF FOOD SECURITY AND RESILIENCE
Between 1998 and 2011, five major droughts affected from 2.2 Million to 3.8 Million Kenyans. The costs for the
Government of Kenya and international humanitarian aid have been significant, reaching up to 43.7 Billion KES
47
in 2009 (USD 432.5 Million).
Under the combined policy interventions, the uptake of SWP will contribute to increased resilience. With a better
mitigation of drought shocks, farmers can build their reserves, therefore contributing to a greater income increase
over time.
The increase of resilience due to SWP was calculated based on the expected probability of a drought in Kenya
48
per year estimated at 40% and the expected impact on agricultural land usage projected at 30%.
In a given year, the average farmer is expected to lose 12% of
of their crop due to drought. Under a severe drought a farmer
can lose their entire crop. SWP will therefore play a key role in
reducing shocks for farmers.
EXPECTED PROBABILITY 30%
30% OF A DROUGHT IN
KENYA
AVERAGE IMPACT OF
DROUGHT ON AGRICULTURAL
LAND USAGE
FIGURE 25: INCREASE OF FOOD PRODUCTION DUE TO RESILIENCE (%)
In addition to increased resilience, the national food production will increase significantly (from 23.2 Million MT
in 2020 to 65.5 Million MT in 2030). Imports of key staples are likely to drop, based on local production.
49 50
Currently 529 Thousand MT of maize is imported annually, and this gap could be largely met. This will contribute
to savings in import bills on food.
The increase of food production will enhance the basis for other sectors including food exports and processing. A
consistent supply of raw materials will be the basis for developing sustainable processing and stronger exports.
47. Bartel and Muller., Economics of resilience to drought, Kenya analysis, 2018
48. Ibid
49. ITC Trade Map
50. Production of maize calculated based on the ‘multiple intervention’ scenario. The projected maize production in 2030 is estimated to reach 527 Thousand MT
25COUNTY ROLL OUT
On the right are listed the counties with the largest projected UPTAKE FIGURES UNDER
uptake of solar water pumps over 10 years under the combined COUNTY COMBINED POLICY
policy interventions. INTERVENTIONS OVER 10
YEARS (UNITS)
NANDI 96K
Several criteria need to be taken into consideration for the
prioritization of county-roll out, such as local political priorities, MERU 75K
and on the ground relationships. Nyandarua is one county SIAYA 70K
where this could make a significant impact, and the potential KAKAMEGA 64K
impact is shown below at a sub-location level. There is a strong
BUNGOMA 64K
argument to pick a single county first and pilot the especially
given the strength of Kenya’s devolved system of government. FIGURE 26: PROJECTED UPTAKE PER COUNTY IN KENYA
A combined set of policy interventions is most likely to lead to successful implementation (e.g., a locally managed
subsidy, along with additional capital inflow from a financial services partnership, and an awareness campaign
about the programme).
FIGURE 27: MAP OF NYANDARUA SWP USAGE, AT SUB-LOCATION LEVEL, BASED ON COMBINED INTERVENTIONS BEING ENACTED (POLICY INTERVENTION 1, 2, 3,
4 COMBINED)
NO. OF HOUSEHOLDS THAT PURCHASE A NO. OF HOUSEHOLDS THAT PURCHASE A
SWP IN NYANDARUA AFTER A SUBSIDY SWP IN NYANDARUA AFTER A CREDIT
SCHEME SUBSIDY SCHEME
0 0
0-20 0-20
20-40 20-40
40-60 40-60
60-80 60-80
80-100 80-100
100-120 100-120
120-140 120-140
140-160 140-160
160-180 160-180
NO. OF HOUSEHOLDS THAT PURCHASE A NO. OF HOUSEHOLDS THAT PURCHASE A
SWP IN NYANDARUA AFTER A SWP IN NYANDARUA AFTER FINANCIAL
AWARENESS CAMPAIGN ACCESS TO WATER
0
0-20
0 20-40
0-20 40-60
20-40 60-80
40-60 80-100
26You can also read