RUBKONA WATER UTILITY BOARD BUSINESS PLAN 2021-2025
←
→
Page content transcription
If your browser does not render page correctly, please read the page content below
RUBKONA WATER UTILITY
BOARD BUSINESS PLAN
2021-2025

                  1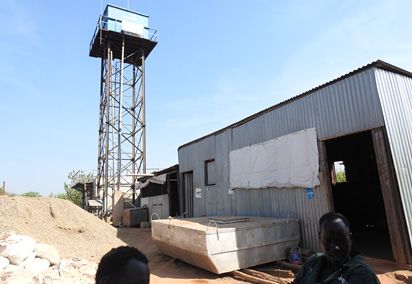
Table of Contents
LIST OF TABLES............................................................................................................................................... 2
INTRODUCTION.............................................................................................................................................. 2
PURPOSE....................................................................................................................................................... 3
SOUTH SUDAN WATER POLICY....................................................................................................................... 4
WATER SOURCE.............................................................................................................................................. 4
DESCRIPTION OF PRESENT ASSETS................................................................................................................. 5
PRESENT REACH AND FIVE YEARS PROJECTIONS............................................................................................. 6
    WATER CONSUMPTION PER HH................................................................................................................ 6
    RUBKONA TOWN SCHEME EXTENSIONS................................................................................................... 6
RUBKONA WATER UTILITY BOARD COMPOSITION.......................................................................................... 7
BURGEONING POPULATION DUE TO IMPROVED SECURITY AND THE PROPOSED DISSOLUTION OF THE POC... 7
    Customer Base......................................................................................................................................... 7
    Bulk Suppliers......................................................................................................................................... 8
   Access to Water........................................................................................................................................ 8
   Competitors:............................................................................................................................................ 8
   Unsatisfied demand:................................................................................................................................ 8
   Tariff:....................................................................................................................................................... 8
    Risk:......................................................................................................................................................... 9
CONTINGENCY PLANNING.............................................................................................................................. 9
FIVE YEAR CAPITAL IMPROVEMENT PLANS AND DEVELOPMENT PROJECTS.................................................. 12
FINANCIAL PROJECTIONS............................................................................................................................. 15
   KEY ASSUMPTIONS.................................................................................................................................. 15
   CASH PROJECTIONS................................................................................................................................. 16
   WATER SALES PROJECTIONS..................................................................................................................... 16
MONITORING AND EVALUATION.................................................................................................................. 17
ACCOUNTABILITY......................................................................................................................................... 18
   FINANCIAL SUSTAINABILITY..................................................................................................................... 20

                                                             Mission Statement
     To preserve and enhance our water system so that we may provide safe drinking
     water at an affordable cost that will further improve the quality of life of our
                       customers and promote economic growth

                                                                                                                                                                  1
List of tables
Table 1: Core dimensions of Rubkona Utility’s business implementation plan................................................... 3
Table 2: Rubkona Network pipe information...................................................................................................... 5
Table 3: Customer Projections............................................................................................................................ 6
Table 4: Rehabilitation and Extension Plan......................................................................................................... 6
Table 5: Respondent Sources of Water............................................................................................................... 8
Table 6: Proposed Sources of Revenue............................................................................................................... 9
Table 7: Foreseen capital expenditures to realize Payment for water services................................................. 10
Table 8: Capital Improvement Plans and Software (Capacity Building) for 5 Years........................................... 12
Table 9: Five Years Cash Projections for Rubkona Utility................................................................................... 16
Table 10: Water Sales Projections..................................................................................................................... 16
Table 11: Performance Indicators...................................................................................................................... 17
Table 12: Recommended indicators for physical losses and NRW (Source: Alegre et al., 2000)....................... 17
Table 13: Provider-side accountability tools...................................................................................................... 18
Table 14: User-side accountability tools............................................................................................................ 19
2Introduction
A public utility is often criticised for poor service. The
Protracted conflict and associated economic decline
immediate plan is to have the Rubkona Water Utility is
in South Sudan continue to take toll on consistent access
run us a public water utility under an independent Water
to basic services by the people. Services like water
Services Board that is composed of experienced civil
supply and hygiene services have been severely affected
servants from various ministries and the town council,
across states within the country. Access to improved
supervisor of the utility. With the plan to commercialize
water sources remain a challenging across Unity State.
water services, a cost reflective tariff was designed, and
Resource constraints – both financial and human – mean
the utility, despite being a public facility, is expected to
it continues to struggle to maintain services across the city
borrow a lot of business ideals from the private sector. For
and has no capacity to extend services to underserved
instance, recruitment of strong qualified staff, and retaining
areas without external support. Fresh fighting in Unity in
them by keeping them motivated, customer focus, asset
July 2016, combined with the conflict-driven economic
management and having business acumen that will
crisis, hyperinflation, shortages of fuel and consumables,
guarantee a sound financial base. Presently water is free of
and delays in paying salaries of civil servants has further
charge. There are many illegal connections by Government
strained private and public service provision systems.
Officers and institutions. These illegal connections are
WASH sector in South Sudan remains embryonic, and
presently being organized and coordinated by the Utility
while some guiding policies exist, legal gaps remain, and
staff. It is against this backdrop that this business plan is
operationalization has been slow.
being prepared.
This Business Plan is a product of the wider consultancy
assigned to CIVITRA Research and Consulting Inc. Kenya, Purpose
whose aims are: To develop a policy framework to guide
the management of the Rubkona emergency water I. Five year capital investment and development
supply system, support Concern staff in the identification, plan projects that totals US$ 1,140,000.
formulation and training utility management teams for the
II. This Business Plan provides information
running of each. Secondly, is to provide recommendations
generation of revenue should the State
on how to set appropriate tariffs setting as well as
Legislative assembly debate and pass a bill
simple guidelines for drafting by–laws to support the
cancelling universal free water, recognizing the
operations and provide training for stakeholders on the
Water Board as a statutory body and stopping
implementation of the guidance. There are two main ways
all the illegal connections.
that urban water systems can be run:
III. The Plan has details concerning in-process
expansion in coverage plans and corresponding
• As a public utility financial obligations as well as increased
revenue generation
• As a profit making private company
IV. A raft of accountability mechanisms that views
There is also a range of other options such as cooperatives the customers as right-holders and puts them
and social businesses, i.e. businesses that reinvest their first, is also explained in the Plan, checks and
profits in the business in order to achieve social goals than balances within the Utility, as well as citizenry.
benefit the shareholders.
This is a 5 year Horizon Business Plan that charts the way to growth for Rubkona Water Utility. In light
of the fragile state, the push-and-pull movement of civilians between the PoC and the communities of
origin, the Business Plan shows – a US$ 1,140,000 investment spread over 5 years and shared between
strategic capital investment priorities, growth to realize more coverage and capacity development. Mutual
accountability mechanisms - internal and external forms the pinnacle of the plan. All these can only be
realized with the promulgation of a new legislation that allows for paying for water and recognition of
Rubkona Water Utility as a Statutory organ.
1Table 1: Core dimensions of Rubkona Utility’s business implementation plan
Core dimension Key information
WASH sector Provides an in-depth understanding of South Sudan’s Urban WASH legal and institu-
tional framework, to ensure that operational, management, accountability and con-
Enabling environment tingency plans are in line with national policies and programmes; while responding to
and operating within key institutions.
Technical feasibility Suggests technical improvements needed in the medium- to long-term, to ensure the
long-term sustainability of the infrastructure, as well as staff wellbeing and retention.
Commercial viability Depicts the profile of private buyers likely to purchase water: their patterns of con-
sumption, their purchase power, their service expectations and willingness to pay;
as well as a life-cycle cost analysis. It also provides suggestions on arrangements for
collection of service charges/tariffs.
Marketing Provides key information on the main customer base and recommends how to market
water sales to each customer segment.
Local accountability Provides recommendations on mechanisms that the community-led operator would
mechanisms need to have in place in accordance with the institutional and legal framework of the
sector.
Contingency planning Provides guidance on how to implement strategies that enable the continued provi-
sion of services in the wake of an event that poses an unacceptable business risk and/
or operational disruption to Rubkona Water Utility.
Research Studies Highlights key assessments needed in order to raise the level of service and to bring
the whole water facility to standard engineering design and practice. This will in turn
lower operational costs, increase revenue as well as deliver quality services.
South Sudan Water Policy
The main focus of the policy is to avail water of sufficient quantity and quality to sustain healthy standards of living and a
robust economy, while at the same time ensuring the protection of the ecosystem, e.g. the Sudd as Ramsar site (wetland
of international importance). Approved in 2007, the Water Sector Policy outlines how the water sector will evolve in South
Sudan, including establishing basic principles with an aim to provide distinction to the broad sub-sectors of the sector, namely:
Water Resources Management (WRM), Rural Water Supply and Sanitation (RWSS), and Urban Water Supply and Sanitation
(UWSS). In addition to setting up of the Sector Institutions such as a Water Council and preparation of an Investment Plan,
the WASH Cluster partners are urged to coordinate their efforts more closely with MWRI and State level actors to ensure that
longer term operational sustainability issues are addressed. The policy support States, Counties and communities to develop
their own sustainable solutions for service provision, e.g. through private service providers. It is on these basis that Concern
Worldwide is supporting the Town Council and the Ministry for State Infrastructure, Housing and Roads to chart a business
road map for the next 5 years.
Lastly, According to the Presidential Decree 2008, MWRI also has a regulatory mandate to oversee the performance of
UWS services, to inspect rural water facilities and to set water tariffs for urban and rural water. It is also overseeing water
resources development, conservation and management1.
1 MWRI (2011) Water, Sanitation & Hygiene (WASH) Sector Strategic Framework – “Water for Life and Development, Sanitation and Hygiene
for Healthy and Productive Citizens”. Ministry of Water Resources & Irrigation: Juba
2Description of Present Assets
The Water supply network in the town consists of a pump Table 2: Rubkona Network pipe information
intake, a treatment plant, clear water tank, and an elevated
tank and transmission and distribution network. The intake is Pipe Name Length (m) Material Pipe Diame-
located at coordinates (Latitude: 9.283755°N and Longitude: ter (Inch)
29.810382°E). Raising 2,666 HDPE 4
Main
• A simple pipe intake and suction pipe in the Bahr-el-
Ghazal River. The suction pipe is 2 inches HDPE pipe of
length 15m which terminates at the raw water pumping Transmission 541 HDPE 4
station on the bank. Main
• Raw water pumping station consisting of 2 No. diesel
pumps Model PTD 306. Each has a discharge capacity of Branch 1 496 HDPE 4
902 L/Min and head of 28m. The pumps deliver water
to flexible water holding canvass containers Branch 1 – 1 577 HDPE 2
• These 4 No. canvass containers act as coagulation
and sedimentation basins. There are 3 No. each with Branch 2 374 HDPE 4
capacity of 30m3 and the other 2 No. each with capacity Branch 2 – 1 375 HDPE 2
of 20m3. The total capacity is 110m3. The detention
Branch 2 – 2 688 HDPE 2
time in these basins is approximately 2 hours. The water
is then pumped to clear water tank for chlorination.
• The ground steel panel clear water tanks have a total Distribution 2,555 HDPE 2
volume 260 m3 (2 No. each capacity 95 m3 and 1 No.
70m3). • There are 21 No. water points No. are communal
taps/yard taps/Institutional taps, 2 No. water
• The steel elevated tank at the Rubkona intake is used to
kiosks and 1 No. bulk dispenser. The institutional
serve mainly bulk water consumers (donkey carts and
water points and yard taps are still shared with the
water tankers). It is also used to serve the town during
community. Pumping is done for 8.5 hours in a day.
emergencies. It has a capacity of 15 m3 and a height of
12.8m • The operation and maintenance of the scheme is
• This steel elevated tank is the main reservoir serving wholly funded by the Concern Worldwide NGO with
Rubkona town. It is approximately 2.67km from the nil water user fees levied.
intake. Treated water from the intake is pumped
directly into it. It has a capacity of approximately 22m3
• The Asset Base is presently valued at US$ 231,700,
at a height of 11m majorly composed of pipework
• 1 No. Online Chlorine dozer. Branch 1 Branch 2
• 1 No. Aluminium Sulphate dozing machine Mankuai A Mankuai C
• 3 No. diesel IC engines as Prime Movers of the Pumps: Mankuai B Mankuai D
1 No. raw water pump at the intake, 1 No. for pumping Chlobor Dinka A
water into the overhead tanks, 1 No. for Alum pumping
Mathoyo Dinka B
and finally.
Keah Thor bar Chilak A
• A typical public/communal water-point within the
Guol mathoyo Bor Nyal
Rubkona supply network. They consists of 4 taps.
• Bulk water tankers and donkey carts supplied via a
dedicated dispenser at the treatment plant.
• The Rubkona supply system covers an approximate
supply area of 1.77km2. The network is divided into
three branches. The network has a total pipeline length
of approximately 8.27km. This is summarized in Table 2
below:
3Rubkona Town Institutional Population Table 4: Rehabilitation and Extension Plan2
Institution Population Construction of Rubkona SWAT System
Sn/no Item Cost (USD)
SPLM 4th Infantry Division Barracks
Preliminary and Gener-
IOM Primary Health Care Unit A1.1 11,200.00
al items
Rubkona Primary School 975 Intake & Treatment
CARE Medical Clinic A1.2 Plant works including 25,700.00
Nyuel Jurr Primary School 1,917 storage units
Transmission Pipeline
MSF Dispensary A1.3 to Rubkona town + 170,000.00
water points
Generator, Pumps and
A1.4 12,400.00
Pump House
A1.5 Sub- Total 219,300.00
Present Reach and Five Years Add 15% contingency 32,895.00
252,195.00
Projections Grand total
Table 3: Customer Projections
Utility Now in 2021 After 5 years
Rubkona 28, 390 33,2431
Water Consumption per HH
Rubkona Water Utility Board
Composition
20L/P/D. with the accrued public health benefits, increased
uptake of hygiene promotion messages, and with the It is proposed that oversight of Rubkona Water Unity is
increased number of people having disposal income and delegated by the Town Council (Government Government)
demanding increased level of service in the form of house and the State Ministry of Land, Housing and public Utilities
connections, this figure is expected to increase to 35L/P/D to a Water Board that consist of ten members as follows:
on average by year 5.
• 2 No. Respected members from the Community
Rubkona Town Scheme Extensions for each of the Utility ( male & female), example a
The proposed extensions would lead to additional 9 No. School teachers, Nurse, social worker
water points. The total pipeline length would then be • 4 No. Professional in the community – preferably
12,522m (12.522km), which would be an increase of : Lawyer, Engineer, Accountant/Finance
4,435m (4.435km). The new service area would be 2.57 backgrounds (not a must)
km2, an increase of 0.8km21. The additional villages that
• 4 WTO
would be served by these lines are as follows;
All tariff changes and loans must be approved by the
• Suan Rubkona Water Utility Board and Town Council.
• Nonguk
• Mankuai A, C, and D
• Mathoyoh
• Airport
For the above rehabilitation to happen, the below listed
activities with corresponding financial commitment will
have to be done as shown in Table 4 below.
1 Concern worldwide, (2020), Final Hydraulic Modelling &
Technical Assessment Report Juba: South Sudan 2 Source: CWW-SSD Engineer in Rubkona
4Burgeoning Population due to Table 5: Respondent Sources of Water4
improved security and the proposed Water Source No. of Respon- Respondent
dissolution of the PoC dents (N) %
Water Point/Borehole 131 32.8
With the possibility that the PoCs and IDP Camps at the
Hub might be dissolved, and with people returning to Yard Tap in 48 12.0
their homes and communities to resume normal life, the Compound
elevated tanks in both utilities might need to be raised Water kiosk/Tap 186 46.6
need to 1.5 or two-fold to provide more pressure in Stand
order for meet the demand of the increased coverage. Water tanker 3 0.8
Problems portend of excessive pressure in the vicinity of Donkey cart vendor 5 1.3
the respective utilities. McKenzie et al., (2002) pointed out
River/stream 25 6.3
that through considerable research, it has been shown
that burst frequency is very sensitive to maximum system Other 1 0.3
pressure. An effective leakage management strategy Total 398 100
should take into account the pressure dynamics of a water
distribution network. Break Pressure Tanks (BPTs) will also Most of the respondents (90%; N= 399) reported that their
need to be constructed along the supply lines for water primary water source is accessible throughout the year.
points in the vicinity of the Water Utility.
Competitors:
Customer Base As shown in Table 5 above, boreholes comes second after
There are currently approximately 28, 390 people (2020) piped water in terms of water access. The Water Utility
in Rubkona. On a per capita basis connected customers will therefore have to compete with borehole owners
use 20 lpd. This is projected to rise to 33,243 people in the in water services delivery. Rain water also represents a
next four years. huge financial risk to the operational and tactical goals of
Rubkona Water Utility
Bulk Suppliers
There are donkey carts that make trips each day to the Unsatisfied demand:
Utility to get safe water to supply business in the market Due to the transient nature of the urban population and
and food kiosks/restaurants. A donkey cart carries a people doing business at Rubkona market, it is possible to
capacity of 400L. Each trip is charged at 100 SSP. determine unsatisfied demand.
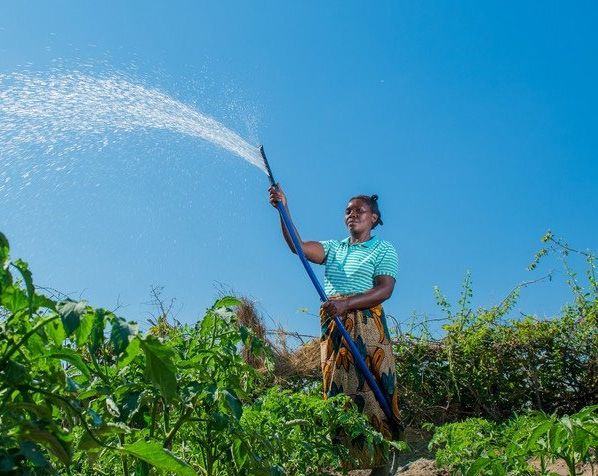
Access to Water3 Tariff:
Most of the respondents (93.5%; N=399) mainly accessed Currently there is no tariff payment. Communities in
drinking water from known safe sources in the locality. Unity are thus eager for solutions to chronic issues such
Only 6.3% stated that they accessed their drinking water as dilapidated infrastructure, lack of investment and
from the river. This is as shown in the table below. unfair pricing. Ongoing safe access to potable water amid
South Sudan’s protracted crisis is fundamental to people’s
survival, and represents a step towards developing a
situation of normality and ultimately one in which the
people can thrive. A cost reflective tariff of 15 SSP per
20 L Jerrycan has been established (CIVITRA Research
and Consulting Company, 2021). A program of education
of the community, institutional set up as well as a raft
of legislations by the State Assembly and Government is
expected before mid-2021 in or order to operationalize
payment for water services. to professionalize, and to
consolidate management arrangements capable of
responding to the community’s water needs before, during
and after shocks (including spikes in conflict, significant
deteriorations in the health situation, including but not
limited to cholera, and economic disruption).
3 Concern and Unicef (2019), Assessment Report Willingness
to pay water services report Rubkona and Rubkona, Unity: South
Sudan 4 Ditto
5Risk: Contingency planning
Short- to mid-term prospects for public investment in
infrastructure (including WASH infrastructure) are bleak, Rubkona Water Utility provides a vital service to the
with peace building efforts curtailed by the ongoing conflict, community. Safeguarding its continued operation before,
to which the vast majority of the state budget is being during and after a crisis is thus crucial to enable the
channelled. Furthermore, South Sudan’s WASH sector communities to be minimally prepared and to endure and
remains at an embryonic stage, and while some guiding bounce back faster from shocks. Rubkona faces a high
policies exist, legal gaps remain, and operationalization security threat, due to the warring clans. Although the
has been slow. This has contributed to the dilapidation town has remained stable for a while, insecurity generated
of existing service delivery systems, as well as a lack of by the crisis is a reminder of how socially and politically
clarity of sectoral roles and responsibilities, leading to volatile the city remains. Rubkona Water Utility and
fragmentation and duplication of such roles, exacerbated Concern Worldwide acknowledge that Rubkona is also
by weak accountability and oversight systems. likely to be affected by flooding due to its proximity to the
river. Given how vital the water supply is to communities in
withstanding crises and bouncing back more quickly from
them, it is essential that plans are developed to safeguard
its operation during shocks.
Table 6: Proposed Sources of Revenue
Present Future
Description 2
Approx. Annual Approx. Annual Amount
Amount ((US$) (US$)
1 Tariff (@US$ 0.123/M3) 107,328.34 128,794
2 Grants 40,000 40,000
Universal Connection (as per water points) 14 No. Water points @US$ 350 300
25 service fee
4 Kiosks (1 No.) @US$ 100 service fee 0 1200
5 INGOs Connection (1 No.) MSF Hospital @US$ 250 service fee 100 250
6 Gvmnt Connection (1 No.) Hospital @US$ 250 service fee 250 250
Gvmnt Connection (9No.) Ministries & allied offices @US$ 100 service 900 1400
fee
5 Gvmnt Connection (6 No.) Schools@US$ 100 service fee 600 1100
6 Connection (as per HH with good disposal income expecting higher 500 800
level of service) (5No.) @US$ 100 service fee
7 Meter Renting @US$ 50 service fee (47 No.) 2,350 1,500
8 Reconnection fees for defaulters 3,000 9,000
9 Penalties for offenders (contravention of the By laws) 1,000 1,000
156,378 185,5943
6Table 7: Foreseen capital expenditures to realize Payment for water services
Present Future
Description Approx. Annual Approx. Annual
Amount ((US$) Amount (US$)4
1 Purchase of Bulk Water Meters (5No. - @for raw water/intake, 1,250
for production and 3 No. District Meters for the three mainlines
for leakage reduction program) @ US$ 250
2 Purchase of Water Meters (21 No.) @ US$ 70 1,470
3 Construct 7 Water Kiosks @US$ 1,200 8,400
4 Purchase PRV – Pressure Reducing Valves for the three main- 1250 1500
lines for leakage reduction program) @ US$ 250
Total Operational Costs including paying for Capital Asset de- 107,328.34 128,7945
preciation costs
6 Meter Testing Costs by third party 2,000
7 Leakage detection program costs 6,000
8 3 No. Motorbikes 3,500
9 2 No. Computer 2,500
4 Additional critical staff 2,000
Office Operational Expenses 2,000
Expenditure on phones and communications 1,000
Seminar & Workshops on sensitization of customers (education 3,500
of land lords as stakeholders should be prioritized)
Systems Strengthening (a) Making digitized as built drawings, 60,000
Mapping the Network (b) 3No. GPS Hand-held gadgets purchase
(c) transformation from a single entry manual accounting sys-
tem to an automated double entry accrual based accounting sys-
tem (d) a restructured organization that is closer to customers
and more accountability for operational and customer service
results, (e) a revised tariff structure that has produced signifi-
cantly more revenues and provides appropriate subsidies for
poor customers, (f) a complete inventory and valuation of Rub-
kona’s fixed assets and (g) Marketing and Advertisements
111,293 151,194
Note the items above aren’t included in Table 4 of the Business Plan
Five Year Capital Improvement Plans and Development Projects
In addition to completing proposed extension project by UNICEF and Concern and following the proposals by the March
2020 Hydraulic Modelling study, and the Report on the Training of Board members’, recommendations, the projects
listed in Table 13 of this plan shall be carried out over the FY 2021 to F2025 time period.
Table 8: Capital Improvement Plans and Software (Capacity Building) for 5 Years
5 Year Estimate FY Projected FY Projected FY Projected Projected
Plan 2021 2022 2023 FY 2024 FY2024
Investments
7i. Rehabilitation/Upgrading 252,195 120,000 132,195
Rubkona Water Utility
ii. Purchase of Bulk Water 1,250 1,250
Meters (5No. - @for raw
water/intake, for produc-
tion and 3 No. District
Meters for the three
mainlines for leakage
reduction program) @
US$ 250
iii. Purchase of Water Me- 3,290 3,290
ters (47 No.) @ US$ 70
iv. Construct 7 Water Kiosks 8,400 8,400
@US$ 1,200
v. Purchase PRV – Pressure 1250 1250
Reducing Valves for the
three mainlines for leak-
age reduction program)
@ US$ 250
vi. Meter Testing Costs by 2,000 2000
third party
vii. Leakage detection pro- 6,000 6000
gram costs
viii. Fire Hydrants 8,000 8,000
ix. Air Compressor and relat- 12,000 12,000
ed horse pipes of appro-
priate size and pressure
gauges – for Pipes,
Pumps and IC Engine
Cleaning
x. Pressure gauges/Meters 2,000 2,000
at the Pump House,
Storage Supply tank, and
one per main lines (3No.
Mainlines)
Studies
i. NRW: Leakage Studies 15,000 15,000
and detection
ii. Mapping and Digitization 15,000 15,000
of the as-built designs
and drawings (includes
calibration of the net-
work for Hydraulic Mod-
els to function)
iii. Operational , Human 10,000 10,000
Resources and Financial
Systems Study
iv. Complete inventory and 7,500 7,500
valuation of Rubkona’s
fixed assets
8v. Solarization of the Sys- 10,000 10,000
tem to save at least 30%
of the energy costs(Hy-
brid Model Study)
Operational Projects
i. Transformation from a 8,500 8,500
single entry manual ac-
counting system to an
automated double entry
accrual based accounting
system
ii. 4 Additional critical staff 2,000 2,000
iii. Customer Complaint 500 500
Center
iv. Customer Meter Replace- 4,000 1,000
ment
v. 1 No. Motorbikes (125 cc 1,850 1,850
capacity engines) and 5
Bicycles
vi. 1 No. Computer 1,250 1,250
vii. Washouts 6
1,500 1,500
viii. Regular Pipe Cleaning 7
4,000 1,000 1,000 1,000 1,000
ix. Pipe Marker Posts in the 900 900
fields that are frequently
set on fire
x. Pipe repairs, replace- 16,000 3,200 3,200 3,200 3,200 3,200
ments, and rehabilita-
tions and extensions
xi. Valve Chambers and 7,500 3,500 3,500
Section Valves
401,885 149,600 183,435 40,900 59,400 15,200
Commercial loans terms are onerous and include interest rates of approximately 10% and repayment terms of no
more than eight years. For these easons, the water expansion, main replacements and operational projects will need
to be funded from utility earnings. However, it is expected that with improved systems, active board and payment for
water services, the credit rating/viability increases and the Utility will be able to fund some its capital improvement
costs through loans. The Consultants recommends that due to the necessity of some of these items as they are meant
to bring the Water Utility to Standard practice, grants should be sought to complete these items.
9Financial Projections
Key Assumptions
Rubkona Utility’s investment plan and cash flow projections that are included on the following pages have been pre-
pared based on information provided by the Utility’s management. The key assumptions that were used as the basis for
the investment plan and cash flow projections are as follows:
1. The number of private (domestic) connections will increasing. Of course this is dependent on the volatile secu-
rity situation in the country and the State in particular.
2. The number of non-domestic connections will increase following the passing of the bill into law on cancellation
of Universal Free Water and the recognition of the Board.
3. Billed water use per customer per month will increase fowling assertiveness of the new Board.
4. Water tariffs will increase 20% in FY 2022 in order to provide necessary funds for projects.
5. The estimated collection rate will increase gradually from 0% in FY 2021 to 98% in FY 2023.
6. Salary and wage rates will increase 10% annually.
7. NRW will decrease 3% per year from 2022 to 2015 as the NRW project initiated by Rubkona Water Utility is
implemented.
8. Electricity expense will increase based on the percent increase in annual water production plus 50%. The all-in
unit cost of energy will increase 7% annually.
9. Chemical expense will increase based on the percent increase in annual water production plus an assumed an-
nual increase in the unit cost of chemicals of 10%.
10. Fuel and lubricate expense will increase at annual rate of 15%
11. Maintenance and repair expense will increase at an annual rate of 10% plus estimated increments for new bore-
holes and additional vehicles (5%)
12. Loans from the Financial Markets will bear interest at 12 % and will be payable over a 25 year repayment period.
Additional explanatory notes are included with the Investment Plan and Cash Flow Projections on the following pages.
Details of revenues, expenses and debt service are also included in this section of the business plan.
10Cash Projections
Table 9: Five Years Cash Projections for Rubkona Utility
Maint. & Repr incr. is 5% 105%
tariff
sal. Incr. is 10% 110% incr. 120% Fuel incr. is15%
is 20% 115%
Esti- Project- Project- Pro-
5 Year Projected
mate FY ed FY ed FY jected
Plan FY2024
2021 2022 2023 FY2024
Operating Revenues
Water Sales 798,695 107,328 128,794 154,553 185,463 222,556
Other operating revenues 365008 49,050 58,860 70,632 84,758 101,709
Total operating revenues 156,378 187,654 225,184 270,221 324,265
Operating Expenses
Salaries & Wages 40,263 6,595 7,254 7,980 8,778 9,656
Chemicals 94,546 15,486 17,035 18,739 20,612 22,674
Fuel & Lubricants 119,774 19,619 21,581 23,739 26,113 28,724
Maintenance & repairs 191,723 31,404 34,544 37,999 41,798 45,978
Other operating expenses 12,210 2,000 2,200 2,420 2,662 2,928
Total operating revenues 448,862 75,104 82,614 90,876 99,963 100,304
Cash flow from Operations 714,841 81,274 105,039 134,309 170,258 223,961
11Water Sales Projections
Table 10: Water Sales Projections
Esti-
Projected Projected Projected
mate FY Projected FY 2022
FY 2023 FY2024 FY2025
2021
1. Number of Customers 1.01 1.05 1.04 1.05
Private - Domestic 28,390 28,674 30,108 31,312 32,877
Non-Domestic 2,892 2,921 3,067 3,190 3,349
31,282 31,595 33,175 34,502 36,227
2. Billed Annual in Use (Cubic
meter) 87,600 105,120 126,144 151,373 181,647
3. Composite Water tariff (US$/
M3) 1.23 1.48 1.77 2.13 2.55
4. Total Water Billed ( R2 X R3) 107,748 155,157 223,426 321,734 463,297
5. Estimated Collections 100% 65% 75% 83% 90%
6. Total Water Sale (R4 X R5) 107,748 100,852 167,570 267,039 416,967
Monitoring and Evaluation
Table 11: Performance Indicators
2021
Unit 2022 2023 2024 2025
Baseline
EQUITABLE SERVICE
1. Population served with access to water supply % - 76 80 83 87
2. Population with household connection % - 27 29 31 33
3. Operating cost coverage ratio (op. rev/op. exp.) % - 150+ 150+ 150+ 150+
4. Water consumption L/p/d - 36 37 37 38
EFFICIENT SERVICE -
5. Ratio of staff per thousand water connections % - 9.2 8.6 8.2 7.8
6. Revenue/ Bill collection efficiency % - 90 92 94 96
7. Staff with vocational qualification or above % - 26 32 38 44
8. Unaccounted for Water (w. delivered- w. billed)/w. delivered) % - 29 28 27 26
9. Energy efficiency (kWh / water delivered) Ratio - TBD TBD TBD TBD
SUSTAINABLE SERVICE -
10. Pipe extension executed Km - 21 21 22 23
11. No. of pipe breaks (per year/per km) Ratio - TBD TBD TBD TBD
12. No of water samples testing with negative coli forms against % -
87 89 91 93
total
13. Training Program (training hours/employee) Ratio - 5 7 7 10
12Table 12: Recommended indicators for physical losses and NRW (Source: Alegre et al., 2000)
Function Level Performance Indicator
Financial: NRW by volume 1 (Basic)8 Volume of NRW [% of system Input Volume]
Operational: Physical losses 1 (Basic) [Litres/service connection/day] or [litres/km of mains/day](only
if service connection densityTable 13: Provider-side accountability tools
Aim Mechanism Description Leading Agency How often
Information and con- User outreach/ad Display public Rubkona Water Util- Beginning of opera-
sultation ity Board General As- tions and update as
hoc user meetings information on: sembly needed
and forums - Water tariffs
- Opening hours
- Complaint
phoneline
- Emergency
numbers
Publication of • Display public Rubkona Water Util- Information on
ity
performance data information on: monthly basis;
Management
- Amount of water report every
Users’
produced quarter to be
Committee
- Amount of water shared with
sold local government
- # of complaints, authorities,
type of complaints Concern Worldwide
and Rubkona Water
and how long it Utility Board
took to resolve
- Water quality
• Produce quarterly
financial and
technical reports
14Standard Contract with Performance con- Rubkona Water
tract between Rub- Utility
setting and service provider Beginning of
kona Water Utility
and Water Facility Management
regulation operations
O&M Team, which
Users’ Committee
specifies expecta-
tion of service pro-
vided (water quality
standards, opening
hours, etc.)
Regulation Development and Draft by Concern
Worldwide
ratification of cus-
tomer and agreement by
charter and integrity Rubkona Water Util-
pacts ity
Management
Users’ Committee
Performance Retrospective Conduct customer Rubkona Water Util- Quarterly basis
ity
monitoring performance/ satisfaction surveys
to follow up on ser- Management
and feedback perception surveys vice commitments
and identify ineffi- Users’ Committee
ciencies and prob-
lem areas
Redress and Internal Define how people Rubkona Water Util- Beginning of
ity
recourse complaint/grievance complain, to which operations
point of contact, Management
mechanisms how long it takes
Users’ Committee
for complaints to be
resolved and what
kind of responses
are given
15Table 14: User-side accountability tools
Aim Mechanism Description Leading Agency How often
Information Citizen’s Rubkona Water Users’ Group Beginning of
Utility Users’ Char-
and charter ter: Rubkona users representatives operations
spell out
consultation (HH, bicycle and meetings
Provider responsibil-
vendors, water on regular
ities and
tankers) basis
service standards
for ratification by
provider, with
regular monitoring
meetings to evalu-
ate progress
Performance Citizens’ user Rubkona Water Util- Users’ Group Meet when
ity users’ platforms:
monitoring and platforms users meet to reach representatives needed,
feedback coherence and con- (HH, bicycle initially
sensus as to service
vendors, water supported by
challenges
tankers) Concern Worldwide
Redress and Use of Rubkona Water Rubkona commu- When needed
Utility Users’ make nity
recourse complaint use of complaint
mechanisms to
mechanisms
individually or
collectively voice
grievances that help
improve services
and receive
compensation
Financial sustainability
To demonstrate Rubkona’ commercial viability, the plan has also projected cash flow following the principles of the
life-cycle cost analysis and cost recovery. Using these approaches, it is possible to account for expenses to enable the
Rubkona Water Utility’s short-term and long-term operationality, including provisions to replace, extend and enhance
the water supply system (Tables 7, 8 and 9). By calculating the level of expenditure, it is in turn possible to demonstrate
just how much the community-based operating agency would have to charge to operate on a cost-recovery. Calculations
revealed that even charging the very minimum, in an optimal scenario, the Rubkona Water Utility’s financial sustainabil-
ity was assured. This demonstrated that, if transparent and effective cash handling procedures were followed, money
generated through the sale of water would be enough to cover monthly expenditures (operations and minor mainte-
nance), while setting aside enough for major replacements and even a surplus that could be used as a community revolv-
ing fund to finance activities for the wider benefit of people living in the Rubkona area. Most sources of expenditure are
considered, but moving forward it is likely that new costs will be incurred. For example, taxes are not included in initial
calculations because the concept of social enterprise in South Sudan is new, and it remains unclear how the government
will tax this busines
16(Footnotes)
1 At a population growth rate of 3.2% per annum
2 As per MWRI (2011) Water, Sanitation & Hygiene (WASH) Sector Strategic Framework – “Water for Life and
Development, Sanitation and Hygiene for Healthy and Productive Citizens”. Ministry of Water Resources & Irrigation: Juba,
for example in Juba in 2011, UWC had a total of 2504 customers, each paying between US$ 2.5 and US$ 40per month i.e.
an average of US$ 8.4 per month. In addition, UWC charges a connection fee of 255 SDG (USD 102).
3 Note that a major part of this is loan (@US$120,000). It is expected that with Governance and Board oversight, including
capacity building on financial management, the credit rating for Rubkona Water Utility should raise and so is the capacity
to source money from domestic financial market
4 From Table 3, this will be a 20% increase in population
5 The same value in Table 6 future water production costs. As this is a Non-Profit public body production costs is approxi-
mately the same as sales costs with zero profit margin. Note that Annuity for Capital recovery costs has been factored in
already
6 Required for minimum 10m drop in elevation. This can be found on the worksheets of the Hydraulic Modelling Report
(March, 2020). Fortunately, Sud swamp is relatively plain/flat and so not so many wash-outs will be required.
7 Is based on Hydraulic Modelling studies and the installation of fire hydrants and valves
8 Level 1 (basic): Is a first layer of indicators that provides a general management overview of the efficiency and
effectiveness of the water supply undertaking.
9 Level 2 (intermediate): Additional indicators that provide a better insight than the Level 1 indicators; for users
who need to go further in depth.
10 Level 3 (detailed): Indicators that provide the greatest amount of specific detail, but are still relevant at the top
management level.
17www.concer n.net
Republic of Ireland
52-55 Lower Camden Street Dublin 2
+ 353 1 417 77 00
info@concern.net
Northern Ireland
47 Frederick
Street Belfast
BT1 2LW
+ 44 28 9033 1100
belfastinfo@concern.net
England and Wales
13/14 Calico
House Clove Hitch
Quay London
SW11 3TN
+ 44 207 801 1850
londoninfo@concern.net
USA
355 Lexington Avenue
19th Floor
New York
NY 10017
+ 1 212 5578 000
info.usa@concern.net
Republic of Korea
Chunji Building, 2F, 374
1 Seogyo-dong, Mapo-
Gu Seoul, 121 894
+82 324 3900
info.korea@concern.net
18You can also read