How should we investigate variation in the relation between social
←
→
Page content transcription
If your browser does not render page correctly, please read the page content below
Preprint under review                                                                                                       1

           How should we investigate variation in the relation between social
                             media and well-being?
                  Niklas Johannes1, Philipp K. Masur2, Matti Vuorre1, & Andrew K. Przybylski1
                           1
                            Oxford Internet Institute, University of Oxford, 2Communication Science, Vrije
                                                       Universiteit Amsterdam

           The study of the relation between social media use and well-being is at a critical junction. Many
           researchers find small to no associations, yet policymakers and public stakeholders keep asking for more
           evidence. One way the field is reacting is by inspecting the variation around average relations – with
           the goal of describing individual social media users. Here, we argue that such an approach risks losing
           sight of the most important outcomes of a quantitative social science: estimates of the average relation
           in a large group. Our analysis begins by describing how the field got to this point. Then, we explain the
           problems of the current approach of studying variation. Next, we propose a principled approach to
           quantify, interpret, and explain variation in average relations: (1) conducting model comparisons, (2)
           defining a region of practical equivalence and testing the theoretical distribution of relations against that
           region, (3) defining a smallest effect size of interest and comparing it against the theoretical distribution.
           We close with recommendations to either study moderators as systematic factors that explain variation
           or to conduct N = 1 studies and qualitative research.
           Keywords: Social media; well-being; effect heterogeneity

                               This preprint is under review and has not been peer reviewed yet.

    In choosing what to study, social scientists interested in             and comes to a consensus, concluding that there is little
digital technologies are often reactive (Orben, 2020b). They               cause for concern: Relationships between technology use
react to calls for evidence from policymakers, which come                  and outcomes of concern are close to zero. At this point, why
with opportunities for funding to deliver that evidence.                   doesn’t the field move on? Is the question about
Likewise, policymakers regularly react to concerns of the                  technology’s potential harm not answered? Wouldn’t it be
public. This reciprocal relation between concerns and calls                prudent to stop investing resources into researching effects
for evidence follows a cyclical nature (Grimes et al., 2008;               that evidence suggests are not there?
Orben, 2020b): Whenever a new technology hits the market,                      We believe the study of social media use and well-being
it sparks concerns about the effects of the technology on the              faces exactly these questions today. For the past fifteen
well-being of its users. All stakeholders are looking for                  years, the public discourse has been ripe with concerns about
guidance: Should we limit our and especially our children’s                the relation between social media use and well-being.
time with the technology? How can we prevent its alleged                   Policymakers reacted, calling for scientific evidence on
negative effects? Governments regularly respond to these                   social media use effects and spending millions in funds for
concerns and call on science for evidence – in the process                 social scientists to deliver that evidence (Council on
committing large amounts of funding. After years, the                      Communications and Media, 2016; Dickson et al., 2019).
scientific community evaluates the best available evidence                 And social scientists delivered. Almost all reviews and
                                                                           meta-analyses come to a similar conclusion: The
                                                                           relationship between social media use and the user’s well-
                                                                           being is close to zero and below any threshold for severe
     Grants from the Huo Family Foundation and Economic and
Social Research Council (ES/T008709/1) supported NJ, MV, and               harm that would require intervention (Appel et al., 2020;
AKP. Code to reproduce the figures and numbers reported in this            Bayer et al., 2020; Dickson et al., 2019; Dienlin & Johannes,
article is available at https://osf.io/b7rpx/. A public preprint of this   2020; Kross et al., 2021; Odgers & Jensen, 2020; Orben,
work is available at https://psyarxiv.com/xahbg. The authors
                                                                           2020a; vanden Abeele, 2020).
declare no conflicts of interest The funders had no role in the
conception of this paper, decision to publish, or preparation of the
manuscript.
     Niklas      Johannes       is    the   corresponding      author:
niklas.johannes@oii.ox.ac.uk.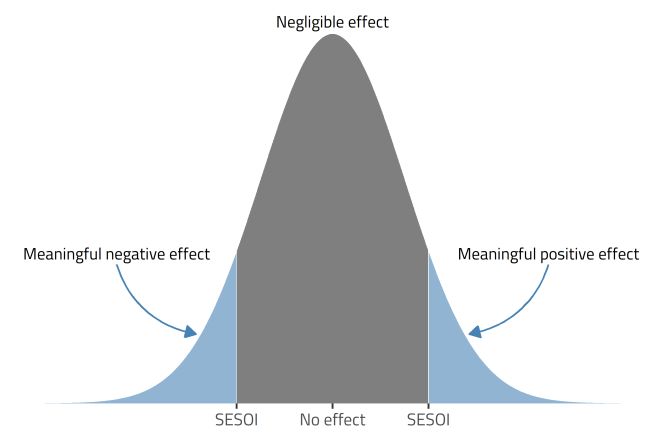
Preprint under review                                                                                                   2

    Taken together, it’s becoming increasingly clear that the      assumption might have been overly simplistic (Kaye et al.,
field is at a critical junction. The evidence on the               2020; Orben et al., 2020; Przybylski & Weinstein, 2017), but
relationships between social media use and well-being is           it shaped how social scientists studied social media.
clear, yet that consensus has not reached the public, which        However, there is no convincing evidence that social media
continues to express fears over the pervasive use of social        are indeed the dose that causes a response. Most studies in
media, which again prompts governments to keep asking for          the field cannot make causal claims, because there is a lack
more evidence. The disconnect between having delivered             of theory that would allow to test causal models with cross-
that evidence and requests for more of it puts social scientists   sectional data (Eronen & Bringmann, 2021; Rohrer, 2018)
in an unenviable position. That position has led researchers       or inform us about time-varying confounders in longitudinal
to investigate variation around the average association            data (Hernán, 2018; VanderWeele et al., 2016). Moreover,
between social media use and well-being (Aalbers et al.,           the few experiments with high external validity show the
2021; Beyens et al., 2020; Whitlock & Masur, 2019).                lack of a causal effect (Mitev et al., 2021; Przybylski et al.,
Studying between-person and -group variation might be              2021). Therefore, it is questionnable whether social media
informative, but the field has not yet developed a principled      use is indeed the dose that causes a response (i.e., changes
approach to researching or understanding that variation.           in well-being). Moreover, it is unclear whether a dose-
Before we develop such an approach, we believe it is               response relation would be linear, such that with each extra
important that we pause and ask ourselves: How did we get          minute of social media use, well-being varies to the same
here? What’s the problem? And where do we go from here?            extent as with the next minute (Johannes et al., 2021). For
    Studying variation before a solid understanding of how         example, there is some preliminary evidence that the relation
to answer these questions may be hasty and risk investing          between social media use and well-being is curvilinear
resources that could be more valuable elsewhere. Here, we          (Bruggeman et al., 2019; Przybylski & Weinstein, 2017).
tackle those questions in the hope that we can outline a               We believe such a linear dose-response assumption
principled approach for the study of social media and well-        aligned with the way in which the field is understood by
being.                                                             many researchers. Emulating STEM and medicine
                                                                   (Muthukrishna & Henrich, 2019), the field takes a certain
                     How did we get here?                          lawfulness in media effects for granted. Although people are
                                                                   different and media effects will differ from person to person
   Prescribing the impossible                                      to a degree, we tend to assume that we can identify average
     Ever since social media became popular at the turn of the     media effects that we can generalize to a population. At the
millenium, there have been concerns about their negative           same time, calls for advice from the public and policymakers
effects (e.g., Beard, 2005). While the social sciences were        have pressured social scientists into producing prescriptive
still figuring out how to properly research social media, the      recommendations (Council on Communications and Media,
first popular science books about their harmful effects on our     2016; Dickson et al., 2019). How should we use social
thinking (e.g., Carr, 2011) and social fabric (e.g., Turkle,       media? What amount of screen time is safe for a child?
2012) came out and caused a stir in public discourse.              Under the assumption of lawfulness on the level of
Policymakers reacted quickly. For example, in 2018 the UK          individual people, prescriptions are possible. Some
Chief Medical Officers commissioned researchers to                 biochemical processes will affect almost everyone in a
provide an evidence map of published research on the effect        similar way, but to different degrees (Muthukrishna &
of screen time and social media on children’s and young            Henrich, 2019). For example, Figure 1 shows different
people’s mental health (Dickson et al., 2019). In 2016, the        distributions of effects. The effect of administering a drug
American Academy of Pediatrics released a policy statement         on a chemical response in the body will have lower variance
on Media and Young Minds, recommending that children               than investigating relationships between comparably
younger than 18 to 24 months avoid digital media (except           abstract psychological concepts. Thus, psychological
video-chatting) altogether (Council on Communications and          processes are rarely universal to a degree that we can make
Media, 2016).                                                      prescriptions for individual social media users (Bolger et al.,
     What is striking in the calls for evidence is the             2019; Fisher et al., 2018; Molenaar, 2004; Valkenburg &
assumption of how social media effects are supposed to             Peter, 2013). For all those reasons, it’s close to impossible
work. Those calls often assume a linear dose-response              to make (personalized) prescriptions on social media use:
relationship: More time on social media will lead to lower         the evidence is merely correlational, we can’t be certain we
well-being (Johannes et al., 2021). From the get-go, such an
Preprint under review 3
indeed investigate a dose with a linear effect, and relations
uncovered by the field are not universal.
Figure 1. Examples of the distributions of a null effect (upper panel) and a large effect (lower panel) under different
levels of variation (little variation in blue and a lot of variation in black).
(between-person) and using social media more than a person
A mismatch
usually does is not systematically related to changes in that
When it comes to social media use and well-being, person’s well-being (within-person). On the level of the
scholars have reached a point of general consensus. population, concerns don’t seem warranted. However:
Consensus here should not be understood as every These studies didn’t look at the content that people engage
researcher holding a similar opinion; there are still social with on social media or mental health indicators, but
scientists who are concerned about social media (e.g., frequency or amount of self-reported social media use and
Twenge et al., 2020). But most scholars reject this framing various indicators of well-being (e.g., life satisfaction or
(Livingstone, 2018) and large-scale studies investigating self-esteem).
average associations between social media use and well- Even with these limitations in mind, if we accept that the
being support the lack of a sizable relation (Dickson et al., literature provides convincing evidence of null or negligible
2019; Dienlin & Johannes, 2020; Kross et al., 2021; Kushlev associations, we are presented with a mismatch: The lack of
& Leitao, 2020; Masur, 2021; Meier et al., in press; Meier positive evidence linking social media and well-being is
& Reinecke, 2020; Orben, 2020a; Valkenburg, Meier, et al., fundamentally out of step with on-going public concerns
2021; Whitlock & Masur, 2019). Most of these studies show about negative effects, addiction, and distractions (Ellis,
small or negligible associations on both the between-person 2019; Kardefelt-Winther et al., 2017; Loh & Kanai, 2015;
and the within-person level (Coyne et al., 2019; Dienlin et Satchell et al., 2021; van der Schuur et al., 2019). As a result,
al., 2017; Houghton et al., 2018; Orben et al., 2019; Orben there are no grounds for making prescriptions on social
& Przybylski, 2019; Schemer et al., 2020; Thorisdottir et al., media use. That mismatch between evidence and concerns
2019). In other words, those who use more social media are might make many researchers feel uneasy. When lay beliefs
not worse off compared to those who use them less about social media effects are this strong but social scientistsPreprint under review 4
are not able to produce evidence in support, maybe they
can’t be trusted with producing evidence for questions that
have a (seemingly) less obvious answer? The result of this
line of reasoning is dissatisfaction for researchers, the
public, and policymakers alike. A perception of social
scientists as being unable to deliver useful insights,
especially on a topic for which the public has strong
preconceptions, can have serious consequences for the
research funding and the credibility of social science overall
(IJzerman et al., 2020). Consequently, the average negligible
relation between social media use and well-being may well
lead us to feel threatened as a discipline.
The field has reacted to that threat. Several evidence
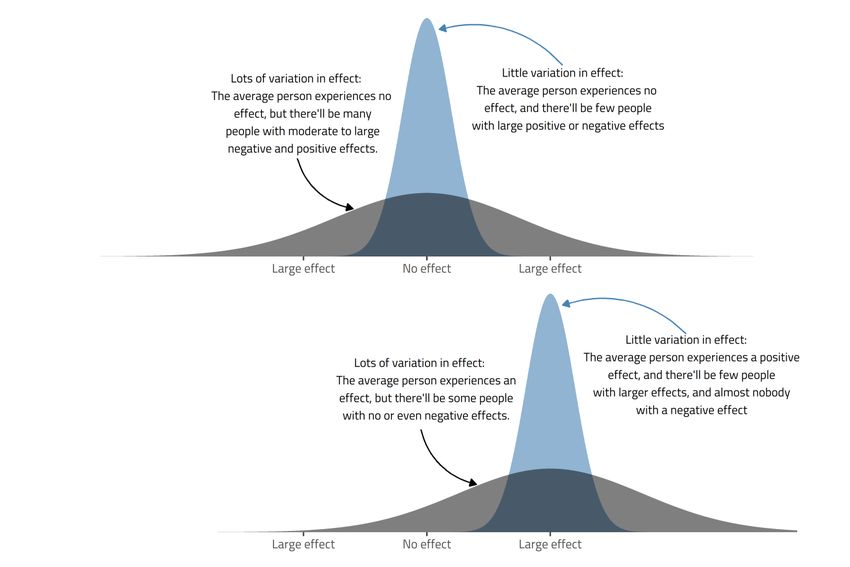
reviews on the effects of technology have called into Figure 2. An example of the argument to focus on
question the validity of the evidence so far (Bayer et al., individual social media users. The average size of the
2020; Dienlin & Johannes, 2020; Kross et al., 2021; Kushlev relation between social media use and well-being is zero, but
& Leitao, 2020; Meier et al., in press; Orben, 2020a; vanden for some people the relation will be above a smallest effect
Abeele, 2020). For example, researchers have criticized both size of interest.
the validity and reliability of self-reported social media use
well-being (Anvari et al., 2021; Anvari & Lakens, 2021). As
(Ellis, 2019; Ellis et al., 2019; Kaye et al., 2020; Parry et al.,
a result, we should focus, so the argument goes, on
2021; Shaw et al., 2020; vanden Abeele et al., 2013) and the
individual social media users and less on the average relation
lack of nuance when inspecting general use rather than the
between social media use and well-being among a large
content people engage with (Dienlin & Johannes, 2020;
group of people.
Kaye et al., 2020; Kross et al., 2021; Masur, 2021; Orben,
In the past year, several analyses of experience sampling
2020a).
data explored this idea of person-specific media effects
The strongest reaction to the status quo that threatens the
(Aalbers et al., 2021; Beyens et al., 2020; Siebers et al.,
field (one-size-fits-all approach with negligible effects) has
2021; Valkenburg, Beyens, et al., 2021). Based on the
been a call for more work that identifies those who show
assumption that everyone is different, they highlight
non-negligible relations between social media use and well-
relations per person and place less focus on the average
being (Orben, 2020b; Valkenburg & Peter, 2013). This call
effect. These analyses are best understood as a variant of the
responds to the question why the public continues to be
heterogeneity argument, an approach used in other parts of
worried about the effects of social media: Several salient
the social sciences (Bolger et al., 2019). In brief, the effect
cases (e.g., radicalization) suggest that there may be distinct
heterogeneity argument states that effects won’t be uniform
subgroups or contexts under which social media use has
across people and understanding the variation around
meaningful effects after all.
average effects can be informative. Such investigations of
One prominent version of that argument goes as follows:
variation around average relations (i.e., effect heterogeneity)
Estimating average relationships between social media use
may be of high value for the field. However, prioritizing
and well-being isn’t informative. Instead, all people are
variation over interpreting and understanding average
different, so we must examine individual social media users
associations risks atomizing associations.
and the relation between social media use and well-being
We believe that shifting focus from average to individual
that is specific to them. Some users will show large relations
relations may not be as promising a solution as it might
and others won’t, leading to overall negligible average
appear at first blush. This is in part because most social
relations (Aalbers et al., 2021; Beyens et al., 2020; Siebers
scientists researching social media rely on inferential
et al., 2021; Valkenburg, Beyens, et al., 2021). Figure 2
statistics to draw inferences about populations of interest. As
illustrates that reasoning: The average relation between
long as we are committed to making such inferences, we
social media use and well-being is zero, but there is variation
have to make a choice: Either we dismiss most, if not all,
around the average relation, such that large negative and
average associations in the literature because we believe we
large positive relations effectively ‘cancel’ each other out. If
need to inspect effects per person. In this case, we are
these relations are beyond a smallest effect size of interest,
obliged to shift the definition of our population (from large
they can be considered large enough to be meaningful forPreprint under review 5
groups to a single person) and conduct N = 1 or qualitative we should know what sources of variability to account for to
studies. Alternatively, we acknowledge average associations identify the signal. Because we want to generalize from the
as our best bets of the true association in the population, people in our sample to the population, we need to account
whose variation deserves more scrutiny. Then we’re obliged for variation of people being different from each other. Only
to develop a principled approach towards identifying, if we account for these differences are we allowed to
interpreting, and explaining variation around average generalize to other people. Social scientists often account for
relations. We strongly believe the second option is the such variation in various forms of mixed-effects models by
answer to the question “Where do we go from here?”. Before specifying grouping variables (Bates et al., 2015; Bolker et
we present our attempt to provide that answer, we’ll outline al., 2009; DeBruine & Barr, 2021) – ideally all sources of
the problem we see with the current approach to studying variability that we want to generalize over (Yarkoni, 2019).
variation around average relations. Therefore, when we predict well-being, we’ll obtain a fixed
effect (i.e., average relation) and random slopes (i.e., per-
What’s the problem? person deviations from the average relation) for social media
use. Random slopes mean that the model doesn’t assume that
Inferential goals and problems the relation will be the same for every participant; the model
Quantitative social scientists draw samples from a takes these differences between people into account and
population to make an inference about that population, often provides us with the best estimate of the average relation,
with the aim of making recommendations to policymakers that is, the fixed effect.
and the public. In our case, if we want test the general The fixed effect, therefore, is our best estimate of the
relation between social media use and well-being, we true, average association in the population; it’s the effect we
measure social media use and well-being in a sample of, say, hope to generalize to other observations. If we rely on
1,000 people. Next, we build a statistical model that allows inferential statistics in that way, we implicitly state that we
us to estimate the direction and magnitude of a relation in are interested in an inference about the population. The same
the data generated by these 1,000 people. If we find that logic applies to identifying factors that might make some
there is a negative relation, we don’t want to conclude that social media users more susceptible than others. If we want
the relation only applies to our sample; rarely are we to generalize those factors to the population, we are yet again
interested in a relation in those particular 1,000 people we interested in fixed, average relations – only this time we are
happened to measure. If we were, we wouldn’t need after moderators, not main effects. Moderators can explain
inferential statistics. We could just calculate the size of the systematic variation in an effect, informing us about the
relation and have our answer. We could report back to factors that, on average, influence the average effect of
policymakers and inform them about the harmful effect social media in the population we want to generalize to.
social media might have on these particular people. If we Because moderators are important in explaining variation,
have established causality, we could even consider making we will come back to their role in a later section.
a prescription, so that policymakers can regulate the time For those reasons, we caution against treating fixed
those 1,000 people spend on social media. But we’re not effects as secondary. For example, Beyens and colleagues
only interested in those 1,000 people. We sampled those (2020) reported the distribution of observed random slopes
1,000 people to draw an inference to the population they of the relation between social media use and well-being,
come from. Statistical inference is thus necessarily categorizing individual relations according to sign and size.
inductive: To arrive at an inference about the population, we They state: “Because only small subsets of adolescents
generalize from a sample of that population. experience small to moderate changes in well-being, the true
Sampling introduces sampling error. Statistical inference effects of social media reported in previous studies have
helps us to disentangle that error from a true effect. In other probably been diluted across heterogeneous samples of
words, it separates signal (i.e., the true effect or association) individuals that differ in their susceptibility to media
from noise (i.e., the error), which means there will be effects” (p. 2). Such an approach emphasizes description
variation in our measures – be it caused by measurement over inference by focusing solely on variation. Describing
error, sampling error, or true variation in the effect. That observed random slopes instead of interpreting the fixed
variation can occur on two levels: Between people (i.e., effects therefore neglects the most important outcome of our
differences from one person to another) and, if we have models: the estimate of the average association in the
multiple measurements per person, within people (i.e., population which is intended to generalize beyond the
variation around the person’s mean). In our statistical model, current sample. It also assumes that the general demographicPreprint under review 6
factors underlying the specific sample make it representative that we believe is a good approximation of the average effect
of the population as a whole. As we have argued, variation in the population. Because there are so many differences
is something that a mixed-effects model adjusts for to between and within people, it is likely that there will be
provide us their best estimate of the average relation in the variation even in the Stroop effect, which we consider one
population. Thus, highlighting the variation around fixed of the most stable phenomena in Psychology (Bolger et al.,
effects or focusing on individual random slopes does not 2019; Fisher et al., 2018; Haaf & Rouder, 2019; Molenaar,
satisfy the goals of understanding the population. This issue 2004).
is exacerbated by non-representative samples typically In short: Random variation around effects—including
recruited in the field. null effects—is exceptionally likely in nearly any
That’s not to say that the variation around the fixed effect psychological phenomenon. As far as we know, we have yet
is meaningless. That variation complements, but does not in to identify an invariant phenomenon. Because human
any way supplant, information the fixed effects carry – it can cognition, emotion, and behavior is complex (Eronen &
inform us about the expected variation from person to person Bringmann, 2021), it is practically impossible to causally
around the fixed effect. That variation, in turn, can inform explain them in their totality (Muthukrishna & Henrich,
us whether we should identify causes for this variation, such 2019). There are a myriad of different genetic and
as moderators or other predictors of variance. Yet again, we environmental influences on human behavior – not to speak
are studying moderators by making inferences based on of the differences in affordances, content, and user
fixed effects (independent of whether we assume variability motivation for using social media. These influences can and
between persons). will interact; therefore, each occasion a person uses social
Therefore, we are wary of the field assigning wrong media is so multiply determined as to be nearly unique. As
priorities to the properties of its models by interpreting a result, people differ to such a substantial degree that no
random slopes without communicating the essential context single treatment is likely to have identical effects across
provided by fixed effects. We must continue treating fixed everyone in the population (Fisher et al., 2018; Molenaar,
effects as the primary insight from analysis; otherwise, we 2004). Applying this reasoning to our case: Whenever we
shift the focus from inferences about the population to investigate the relation between social media use and well-
making predictions for individual participants in our study. being, we assume that the true relation has a distribution
In other words, a focus on individual random slopes in across people. Most people will experience an association
particular neglects our inferential goals and casts doubt on close the average of the distribution, but there will also be
previous research that interprets average effects, thereby people who display larger or smaller associations.
atomizing our knowledge base. If we want to inspect If we accept that not all people are the same and social
variation, we need a principled approach which integrates media effects naturally contain variation, the conclusion that
both sources of information. Before we outline that media effects won’t be the same for everyone takes the form
approach, we first discuss where variation comes from and of a circular argument. When we look at person-specific
what it means. media effects, the question then is not whether there will be
variation around the fixed effect. The questions are rather:
There will (likely) always be variation
How do we estimate variance around the fixed effect? How
To highlight the role of variation, let’s consider an much variation is there? And how much variance is relevant
illustrative example from Psychology: the Stroop effect. to warrant further attention?
People are generally slower to name the color of incongruent The goal to find factors that make people more
words (i.e., the word RED in the color blue) compared to susceptible to social media effects rests on the assumption
congruent words (i.e., the word RED in the color red). In that variation in media effects is meaningful and not just
Psychology, we assume the effect follows some lawfulness noise. If the effect of social media use has little variation
of cognitive processing that is universal across humans. But around the general null effect, only few people will
it is unlikely that even effects we consider lawful are experience negative effects. By contrast, if there’s a lot of
invariant across people, even if their direction is universal variation around the effect, the large negative influence of
(Haaf & Rouder, 2019). There is likely variation in the effect social media will apply to more people and identifying
due to differences between people (i.e., you are different systematic differences becomes relevant. The question of
from me) and within people (i.e., you might behave what meaningful variation is goes hand in hand with the
differently later compared to you earlier). That’s why we are question how we should invest finite resources: How should
trying to estimate an average Stroop effect from our sample further public funding on researching social media effects bePreprint under review 7
allocated? Finding factors that make people more integrate previous insights and current practices in the field
susceptible implies that finding those factors is worth the to a principled approach. To illustrate that approach, we
investment of time and money. work along an example taken from Beyens and colleagues
The field must provide benchmarks against which we (2020) who presented a study on the relation between social
measure the answers to these questions of effect media use and well-being in an experience sampling study.
heterogeneity; it must specify how much variation is They found a fixed effect for the relation between social
meaningful and warrants further investigation. Otherwise, media use (in steps of five minutes) and well-being of .06 on
we simply restate circular reasoning: people being different a 7-point Likert scale. That association was on the within-
because they’re different – unless they’re not different level: For the average person, spending five more minutes
enough. Next, we therefore outline a principled approach to on social media in the past hour than they typically do was
dealing with variation in average relations. associated with a 0.06 increase in well-being. That fixed
effect was not significant (p = .091).
Where do we go from here? How do we know how much variability there is in that
average effect? The standard deviation of the random slopes
Quantifying variation provides us with that answer. In the case of our example, the
How to assess whether there is meaningful variability standard deviation was 0.71 (σ2 = 0.50 from Table 2), more
around the average effect is neither a new challenge nor is it than ten times as large as the average effect. From the
one special to the study of social media. For example, in the standard deviation, we can calculate an interval around the
field of personalized medicine, there is a heavy debate on fixed effect, sometimes referred to as heterogeneity interval
how to deal with variation in effects and how to demark (Bolger et al., 2019), by multiplying the mean effect (0.06)
effects on the individual level from those on the group-level with the lower and upper bound of the standard deviation of
(Senn, 2016, 2018). A similar debate has been going on in the mean social media effect (0.06 ± 1.96 x 0.71). Therefore,
the social sciences for several years (Fisher et al., 2018; our heterogeneity interval is [-1.33, 1.45]. It tells us that 95%
Molenaar, 2004). Similarly, Bolger and colleagues (2019) of person-specific associations between social media use
have addressed the question of meaningful variation in and well-being in the population would fall within this
experimental effects extensively and provide an overview of interval. According to the model, some people will
how to deal with effect heterogeneity. The study of variation experience negative associations (-1.33) that are 22 times
in the relation between social media use and well-being can more intense and negative than the average positive
benefit from the work in these fields. Rather than reinventing association (0.06); others will display positive associations
the wheel, we aim to integrate this work and translate it to a (1.45) that are 24 times larger.
principled approach to study variation in social media In the above example, we used point estimates of the
research. fixed effect and its standard deviation to obtain a
How has the field studied variation so far? Researchers heterogeneity interval. In practice, these parameters are
most often start with model comparisons, where they estimated from data and therefore introduce uncertainty
compare a model with only a fixed slope (i.e., the effect will which ought to be included in further calculations (e.g., of
be the same for every person) to a model with additional heterogeneity intervals). Without representations of these
random slopes (i.e., each person will differ to a degree from uncertainties, for example in the form of posterior
the overall effect). The model that accounts for variability distributions, researchers run the risk of making overly
around the effect routinely fits the data better. Another confident or underconfident statements. However, we only
common practice is plotting the distribution of the observed had access to point estimates for these examples and
random slopes to demonstrate the variation in the relation therefore continue working with them, while recognizing
between social media use and well-being. A subsequent step that in practice such uncertainties should be described.
is often defining cutoffs for effect sizes following the Note that effect heterogeneity and the uncertainty around
conventional benchmarks of Cohen (1988) and describing the fixed effects are not the same. The fixed effect is the
what proportion of random slopes in the sample exceeds average association between social media use and well-
these benchmarks (e.g., 12% of the observed random slopes being; its surrounding 95% confidence intervals inform us
are considered large). about variability in that average relation from sample to
Drawing inspiration from previous work on effect sample. If we ran infinite studies, 95% of the confidence
heterogeneity (Fisher et al., 2018; Molenaar, 2004; Senn, intervals around the fixed effect would contain the true
2018), especially from Bolger and colleagues (2019), we population average relation. In contrast, the heterogeneityPreprint under review 8
interval informs us about variability in the association from meaningful from random variation, we suggest a principled
person to person. If we ran infinite studies, 95% of the workflow that follows three steps (see Table 1). First, we can
heterogeneity intervals would contain an individual person’s compare models as a baseline test. Second, we must define
true relation of social media use and well-being. a Region of Practical Equivalence (hereafter ROPE;
However, the accuracy of these parameters only holds Kruschke, 2014) around the fixed effect and test our
assuming adequate sampling on both the between- and the heterogeneity distribution against this ROPE to identify
within-person level. On the between-level, if we sample noteworthy variation. Third, we must define a Smallest
social media users that are not representative of the Effect Size of Interest (hereafter SESOI; Anvari et al., 2021;
population we want to generalize to, our estimate of the Lakens et al., 2018) and compare the heterogeneity
variability of the effect also isn’t representative. The same distribution against it.
limitation applies if we don’t obtain a representative sample First, Bolger and colleagues (2019) recommend model
from people’s everyday social media use and well-being comparisons as a first step. During that step, we compare a
(e.g., via a random experience sampling procedure). If we model without random slopes to a model with random
don’t study a representative sample of a person’s life, slopes. Goodness of fit is the standard by which model
inferences about the distribution of all participants in our comparisons are judged. If the slopes significantly improve
study will be flawed. Therefore, the accuracy of any model fit, we have initial evidence that there might be
descriptive analysis of a distribution of individual relations meaningful variation around the average effect. As already
depends on sampling on both levels: the individual and the outlined earlier, this step is far from conclusive.
group. Theoretically, we know that people are different and a model
Assuming adequate sampling, the heterogeneity interval with random slopes will almost always yield a better fit (Barr
therefore answers exactly the question we are interested in: et al., 2013). Therefore, model comparison provides a
What social media relations can we expect in the necessary, but not a sufficient, first step.
population? Unfortunately, the field has not employed these Second, we must define a ROPE which “indicates a
intervals, which prevents social scientists from being able to small range of parameter values that are considered to be
quantify variation in media effects from person to person. practically equivalent to [the fixed effect] for the purposes
Merely inspecting random slopes as evidence of meaningful of the particular application.” (Kruschke, 2014). Let's apply
variation in the relation confounds sample-to-sample this definition to our working example. Before we collect
variation of the average relation and person-to-person data, we decide that our fixed effect of social media use on
variation around the average relation. We strongly well-being has noteworthy variation if the effect
recommend the field adopts the practice of estimating heterogeneity distribution exceeds a range of ± 0.3 Likert-
heterogeneity intervals. As a quantitative discipline that is points around the fixed effect. Note that this number is
interested in variability of a parameter, we need to define entirely arbitrary; “ROPE limits, by definition, cannot be
how to estimate that parameter before we can even begin to uniquely ‘correct,’ but instead are established by practical
interpret variability. aims” (Kruschke, 2014, p. 338). We need expert knowledge
to determine our ROPE and provide context for analyses
Interpreting variation
which use it as standard in our models. For some, 0.3 will
After correctly quantifying variation, deciding whether represent a meaningful and sensible cutoff for this effect; for
the estimated variability is meaningful is both possible and others, it won’t. Like Bayesian procedures that clearly
necessary. In other words: Now that it’s measurable, can we communicate prior beliefs about an effect, being transparent
safely ignore effect heterogeneity or is it worthy of further and putting ROPE up for discussion enables others to better
investigation? Many social scientists default to treating scrutinize how we deal with effect heterogeneity (Dienes,
variation around effects as a result of hidden moderators 2019). With this procedure, we communicate to readers that
(Kunert, 2016), thereby seeing all variation as meaningful we only find the variation around a fixed effect worthy of
and worthy of further examination. However, we caution further study if that variation doesn’t fall within the ROPE.
against such a view. As we have explained, few, if any, After having defined our ROPE, we need to test the
psychological phenomena will be invariant and much variation against the ROPE. Here, we don’t rely on the
variation we can consider noise (e.g., from the sampling observed random slopes, but the theoretical distribution
strategy, sample size, the size of the fixed effect, around the fixed effect, that is, the heterogeneity distribution
measurement error, to name just a few). Explaining all from which we draw the heterogeneity interval (Bolger et
variation may practically be impossible. To distinguish al., 2019). Plotting the observed random effects in thePreprint under review 9
Table 1. An explanation of the three steps of interpreting variation.
Step Explanation
1 Model comparison Statistically compare a model with a fixed effect and random slope to a
model with only a fixed effect.
2 Region of Practical Equivalence (ROPE) Define a region of practical equivalence and estimate and compare
theoretical distribution of average effect against it
3 Smallest Effect Size of Interest (SESOI) Define a smallest effect size of interest and compare theoretical
distribution of average effect against it
sample distracts from the actual purpose of the model, which size of interest (SESOI) for the relationship of interest (e.g.,
is to make an inference to the population. As we explained social media use and well-being). The SESOI tells us how
in the section on quantifying variation, we can estimate this large an association has to be for us to consider it practically
theoretical distribution with the fixed effect and its standard relevant (Anvari et al., 2021; Anvari & Lakens, 2021;
deviation. Lakens et al., 2018).
We then can calculate the area under that theoretical Both the ROPE (i.e., width of distribution, relative
distribution to infer what proportion of media users fall limits) and the SESOI (i.e., location and width of
below or above certain thresholds. In our recurring example, distribution, absolute limits) matter, see Figure 3: Our effect
we have an average relation of 0.06 and a standard deviation heterogeneity might well lie outside the ROPE, but that
of 0.71. Our ROPE of ± 0.3 Likert-point hence ranges from doesn’t mean it’s practically relevant. The distribution of
–0.24 to 0.36 (.06 ±0.3). Now, we can calculate what associations we can infer from our sample might well have
proportion of our distribution falls outside the ROPE. For noteworthy variation, but fall completely within the bounds
this example, the area outside this range is 67%. As it is of our SESOI (see blue distribution in Figure 3). Then we
more than 5%, we can conclude that there is noteworthy conclude that there is noteworthy variation, but that
variation around the fixed effect. variation operates within a range we don’t consider relevant.
Note several points here: Because we use the theoretical On the flipside, our distribution might not exceed the ROPE,
distribution, and not observed slopes, we can make an but lie completely outside our SESOI (grey distribution in
inference to the population. However, as we explained Figure 3). Now we don’t find noteworthy variation (so we
before, we have used a theoretical distribution derived from assume the fixed effect is a good enough approximation for
point estimates of fixed effect and its standard deviation. For everyone), but everyone in the population shows a relevant,
an inference that takes uncertainty into account, ideally we large enough association. Finally, and probably most
need to estimate the proportion of the theoretical distribution common, there may be less clear-cut cases (red distribution
outside ROPE for each parameter combination in the in Figure 3): For example, we might have noteworthy
posterior. This approach is therefore more informative than variation, but some parts of the distribution are equivalent to
merely describing what proportion of observed random a practically insiginicant effect (i.e., inside the SESOI
slopes are outside a cutoff, because observed random slopes range). Here, we have noteworthy variation and large parts
describe the sample, not the population. Second, effect of the population show a large effect.
heterogeneity is independent of the location of the fixed For our running example, we probably want to choose a
effect: we specify the ROPE around wherever the fixed large SESOI. In standardized terms, an effect that has
effect will fall. Therefore, ROPE limits are relative to the medium size by Cohen’s (1988) benchmarks might be
location of the fixed effect; ROPE is about the width of the practically meaningless, depending on the outcome (Anvari
distribution, not its location. et al., 2021; Baguley, 2009; Lakens et al., 2018). In the case
Third, now that we have tested whether there is of well-being it has been convincingly argued that people
considerable variation around the fixed effect, we can move need to experience a somewhat large difference of around
on to investigate the location of the distribution and its width half a standard deviation before they can subjectively
in relation to an absolute limit. This combination answers experience that change (Anvari & Lakens, 2021; Norman et
whether there are meaningful person-specific associations. al., 2003). Therefore, just like with the ROPE, we need to
To investigate whether the variation we consider noteworthy apply our domain knowledge to define what we consider a
also matters practically, we need to define a smallest effect meaningful, absolute effect. In our example, say we onlyPreprint under review 10
regard large associations of at least one Likert-point or larger noteworthy and probably worth studying (i.e., ROPE), were
as relevant. We found noteworthy variation in the previous it not for the generally small associations (i.e., SESOI):
step because the distribution exceeded our ROPE, but only explaining even noteworthy variation might be
15.9% of the distribution fall outside the SESOI. inconsequential. Others will conclude that the variation in
Theoretically, we can expect 15.9% of the population to associations is noteworthy and large enough in enough cases
exhibit an association between social media use and well- to be relevant and worthy of further study. Whatever
being that we consider plausibly meaningful. Note again that researchers decide, we urge them to be explicit and
we’re using point estimates; ideally, we inspect what transparent in their choices of both ROPE and SESOI. As a
proportion of the heterogeneity interval’s lower and upper minimal standard, we suggest preregistration as a tool for
bounds lie outside the SESOI. subjecting our hypothesis of effect heterogeneity to a more
Is 15.9% enough people to conclude that we need to severe test (Lakens, 2019) – or display a range of ROPEs
explain that variation? Again, there is no absolute rule here and SESOIs so readers can interpret the results better
and the answer depends on the researcher. Some will (Dienes, 2019).
conclude that the variation in associations in itself is
Figure 3. Examples of how ROPE (Region of Practical Equivalence) and SESOI (Smallest Effect Size of Interest)
interact. Distributions have different ROPEs (bars on top), but the same SESOI (dashed vertical lines). The red case shows
a distribution that is outside ROPE and outside SESOI. The blue case shows a distribution that is outside ROPE, but inside
SESOI. The grey case shows a distribution that is inside the ROPE, but outside the SESOI.
Explaining variation effects. We agree with previous research that it’s an
important step for social media research to identify those
Once we know how to quantify variation in media effects
people who are more susceptible to media effects (Beyens et
and have determined the magnitude of variation necessary
al., 2020; Orben, 2020a; Orben et al., 2019; Valkenburg &
to be relevant for social science research, the final logical
Peter, 2013). However, that step should not be taken for
step is to ask what factors explain that variation. For whom
individual social media users; instead, we must study
does the effect differ and for what reasons? A large amount
systematic individual differences or differences in the
of variation around the average effect can mean that there
content of social media that can account for variation in
are unobserved factors that explain why some people show
social media effects.
a large and others a small effect. It might be well worth to
Identifying susceptible people means identifying factors
study these factors. But if we rely on inferential statistics for
that can explain systematic variation in the effect.
studying those factors, we are yet again interested in fixed
Statistically, those factors are modelled as moderators.Preprint under review 11
Moderators provide a useful conceptual tool for explaining If, instead, social media research is truly interested in
variations in the effect across the population, because they studying effects for each individual person, we argue that
are average effects that we estimate to apply to groups of such a focus requires a different approach: N = 1 studies.
people. Once more, consider the Stroop effect that we used They represent an intruiging alternative research direction.
as an example earlier on. The fixed effect will show that N = 1 studies allow inferences to the person under study only
people, on average, are slower on incongruent trials – assuming no lawfulness in the effect. Medicine has called
compared to congruent trials. However, that effect likely for N = 1 studies, but medicine relies on higher lawfulness
varies, such that some people show little slowing and others (Senn, 2018). With the noisiness of social behavior,
extreme slowing. For example, differences in visual acuity sampling correctly on the within-person level means
might induce systematic differences between participants. If ensuring a representative sampling of that person’s usage
some participants have forgotten their contact lenses, they episodes as well as ensuring enough power to detect
might be slower to read and therefore show a different effect. seemingly small effects (Götz et al., 2021) – which may
In the case of social media and well-being, if we find that require measuring variables as often as 500-1,000 times.
the relation between social media use and well-being has Alternatively, researchers truly try to describe and
high variability, it’s possible that modelling knowledge understand an individual person through a qualitative
about group membership—whether someone identifies with approach. A qualitative approach won’t lead to quantifiable
a particular gender— can explain parts of that variability social media effect estimates, but to a nuanced
because the relation is present for teenage girls, but absent understanding of effects in that specific person. It’s
for boys (Orben et al., 2019). But note that we infer that this extremely valuable to explain social media effects in
moderation reported by Orben and colleagues generalizes individuals through qualitative research, but qualitative
only to the population which was sampled: A large group of research won’t test conditions that explain systematic
British young people aged 10 to 15 years old. We’re not variation in quantifiable social media effect estimates. If the
saying the relation is negative for a specific girl, or null for goal is to quantify effects to generalize to a large group of
a specific boy. There’s little doubt many girls in the data people, however, we need to identify moderators. Focusing
show no relation whereas a number of boys show negative on individual participants in a sample will undermine that
associations. Put differently, identifying moderators will goal and fail to advance social media effects research.
reduce effect heterogeneity, but cannot entirely eliminate it
(Bolger et al., 2019). We argue that identifying moderators, Conclusion
not inspecting individual users, echoes calls of differential
susceptibility to media effects models because moderators What is the relation between social media use and well-
answer the question of what factors in groups of people can being? Social science has done valuable work over the past
explain media effects – not what factors play a role for fifteen years to address that question with increasing
individual media users (Valkenburg & Peter, 2013). fidelity. It has shown that the relation between general social
Identifying moderators that can systematically explain media use and general well-being is rarely large and mostly
effect heterogeneity in a diciplined and accurate way is close to zero. Using these average relations as a vantage
difficult and we expect social scientists will be tempted to point to identify factors that make some people more
adopt a ‘shot-gun approach’ and measure and test a large susceptible to potential effects of social media can be an
number of contructs as moderators. This strategy is doomed important next step. In other words, there’s promise in
to failure. It will lead to high false positive rates and fool further studying the variation in the average (mostly) null
social scientists into giving more weight to those moderators effects the literature has shown. However, we believe the
that ‘worked’ (Munafò et al., 2017; Nosek et al., 2018). field lacks a principled approach to study effect
Testing a wide slate of seemingly plausible moderators will heterogeneity. Here, we’ve made an attempt to explain how
inevitably yield statistically significant results; but ignoring social media effects research has gotten to its current state
researcher degrees of freedom means these results will not and shown a way forward. Either we follow a principled
be informative unless more advanced statistical methods are approach to the study of effect heterogeneity: continue
used (Gelman & Loken, 2013; Simmons et al., 2011). investigating fixed effects, develop principles to quantify
Instead, theory should identify moderators that researchers and interpret effect heterogeneity, and identify moderators
test in truly confirmatory tests (Fried, 2020). Only such an of the relation between social media use and well-being.
approach can systematically explain effect heterogeneity Such moderators may well turn out to be user motivation and
that can be generalized to the population. the content people engage with. Or we focus on individualPreprint under review 12
social media users and conduct more qualitative and N = 1 Beyens, I., Pouwels, J. L., van Driel, I. I., Keijsers, L., &
studies. Either of these paths will be insightful, but we Valkenburg, P. M. (2020). The effect of social
mustn’t confuse them. media on well-being differs from adolescent to
adolescent. Scientific Reports, 10(1), 10763.
References https://doi.org/10.1038/s41598-020-67727-7
Bolger, N., Zee, K. S., Rossignac-Milon, M., & Hassin, R.
Aalbers, G., Vanden Abeele, M. M. P., Hendrickson, A. T., R. (2019). Causal processes in psychology are
de Marez, L., & Keijsers, L. (2021). Caught in the heterogeneous. Journal of Experimental
moment: Are there person-specific associations Psychology: General, 148(4), 601–618.
between momentary procrastination and passively https://doi.org/10.1037/xge0000558
measured smartphone use? Mobile Media & Bolker, B. M., Brooks, M. E., Clark, C. J., Geange, S. W.,
Communication, 2050157921993896. Poulsen, J. R., Stevens, M. H. H., & White, J. S. S.
https://doi.org/10.1177/2050157921993896 (2009). Generalized linear mixed models: A
Anvari, F., Kievit, R., Lakens, D., Przybylski, A. K., practical guide for ecology and evolution. Trends
Tiokhin, L., Wiernik, B. M., & Orben, A. (2021). in Ecology and Evolution, 24(3), 127–135.
Evaluating the practical relevance of observed https://doi.org/10.1016/j.tree.2008.10.008
effect sizes in psychological research. PsyArXiv. Bruggeman, H., Van Hiel, A., Van Hal, G., & Van Dongen,
https://doi.org/10.31234/osf.io/g3vtr S. (2019). Does the use of digital media affect
Anvari, F., & Lakens, D. (2021). Using anchor-based psychological well-being? An empirical test
methods to determine the smallest effect size of among children aged 9 to 12. Computers in Human
interest. Journal of Experimental Social Behavior, 101, 104–113.
Psychology, 96, 104159. https://doi.org/10.1016/j.chb.2019.07.015
https://doi.org/10.1016/j.jesp.2021.104159 Carr, N. (2011). The shallows—How the internet is
Appel, M., Marker, C., & Gnambs, T. (2020). Are social changing the way we think, read and remember.
media ruining our lives? A review of meta-analytic Atlantic Books.
evidence. Review of General Psychology, 24(1), Cohen, J. (1988). Statistical power analysis for the
60–74. behavioral sciences (2nd ed.). Lawrence Erlbaum.
https://doi.org/10.1177/1089268019880891 Council on Communications and Media. (2016). Media and
Baguley, T. (2009). Standardized or simple effect size: What Young Minds. Pediatrics, 138(5).
should be reported? British Journal of Psychology, https://doi.org/10.1542/peds.2016-2591
100(3), 603–617. Coyne, S. M., Rogers, A. A., Zurcher, J. D., Stockdale, L.,
https://doi.org/10.1348/000712608X377117 & Booth, M. (2019). Does time spent using social
Barr, D. J., Levy, R., Scheepers, C., & Tily, H. J. (2013). media impact mental health?: An eight year
Random effects structure for confirmatory longitudinal study. Computers in Human Behavior,
hypothesis testing: Keep it maximal. Journal of 106160.
Memory and Language, 68(3), 255–278. https://doi.org/10.1016/j.chb.2019.106160
https://doi.org/10.1016/j.jml.2012.11.001 DeBruine, L. M., & Barr, D. J. (2021). Understanding
Bates, D., Maechler, M., Bolker, B., & Walker, S. (2015). mixed-effects models through data simulation.
Fitting linear mixed-effects models using lme4. Advances in Methods and Practices in
Journal of Statistical Software, 67(1), 1–48. Psychological Science, 4(1), 1–15.
https://doi.org/10.18637/jss.v067.i01 https://doi.org/10.1177/2515245920965119
Bayer, J. B., Triệu, P., & Ellison, N. B. (2020). Social media Dickson, K., Richardson, M., Kwan, I., Macdowall, W.,
elements, ecologies, and effects. Annual Review of Burchett, H., Stansfield, C., & Thomas, J. (2019).
Psychology, 71(1), 471–497. Screen-based activities and children and young
https://doi.org/10.1146/annurev-psych-010419- people’s mental health and psychosocial
050944 wellbeing: A systematic map of reviews. London:
Beard, K. W. (2005). Internet addiction: A review of current EPPI-Centre, Social Science Research Unit, UCL
assessment techniques and potential assessment Institute of Education, University College London.
questions. CyberPsychology & Behavior, 8(1), 7– Dienes, Z. (2019). How do I know what my theory predicts?
14. https://doi.org/10.1089/cpb.2005.8.7 Advances in Methods and Practices inYou can also read