A Study of Automatic Metrics for the Evaluation of Natural Language Explanations
←
→
Page content transcription
If your browser does not render page correctly, please read the page content below
A Study of Automatic Metrics for the Evaluation of Natural Language
                               Explanations

     Miruna-Adriana Clinciu            Arash Eshghi                                      Helen Hastie
   Edinburgh Centre for Robotics   Heriot-Watt University                            Heriot-Watt University
      Heriot-Watt University     Edinburgh, United Kingdom                         Edinburgh, United Kingdom
      University of Edinburgh     a.eshghi@hw.ac.uk                                 h.hastie@hw.ac.uk
       mc191@hw.ac.uk

                        Abstract                                to evaluate the quality of the NL explanations
      As transparency becomes key for robotics
                                                                themselves, as well as the AI algorithms they
      and AI, it will be necessary to evaluate                  explain. Furthermore, the importance of evaluating
      the methods through which transparency is                 explanations has been emphasised by researchers
      provided, including automatically generated               within the social cognitive sciences (Leake, 2014;
      natural language (NL) explanations. Here, we              Zemla et al., 2017; Doshi-Velez and Kim, 2017).
      explore parallels between the generation of               To date, explanations have mostly been evaluated
      such explanations and the much-studied field              by collecting human judgements, which is both
      of evaluation of Natural Language Generation
                                                                time-consuming and costly. Here, we view
      (NLG). Specifically, we investigate which
      of the NLG evaluation measures map well                   generating explanations as a special case of Natural
      to explanations. We present the ExBAN                     Language Generation (NLG), and so we explore
      corpus: a crowd-sourced corpus of NL                      mapping existing automatic evaluation methods
      explanations for Bayesian Networks. We                    for NLG onto explanations. We study whether
      run correlations comparing human subjective               general, domain-independent evaluation metrics
      ratings with NLG automatic measures. We                   within NLG are sensitive enough to capture the
      find that embedding-based automatic NLG
                                                                peculiarities inherent in NL explanations (Kumar
      evaluation methods, such as BERTScore and
      BLEURT, have a higher correlation with
                                                                and Talukdar, 2020), such as causality; or whether
      human ratings, compared to word-overlap                   NL explanations constitute a sui-generis category,
      metrics, such as BLEU and ROUGE. This                     thus requiring their own automatic evaluation
      work has implications for Explainable AI and              methods and criteria.
      transparent robotic and autonomous systems.
                                                                In this paper, we firstly present the ExBAN
 1    Introduction                                              dataset: a corpus of NL explanations generated
                                                                by crowd-sourced participants presented with the
 The machine learning models and algorithms
                                                                task of explaining simple Bayesian Network (BN)
 underlying today’s AI and robotic systems are
                                                                graphical representations. These explanations were
 increasingly complex with their internal operations
                                                                subsequently rated for Clarity and Informativeness,
 and decision-making processes ever more opaque.
                                                                two subjective ratings previously used for NLG
 This opacity is not just an issue for the end-user, but
                                                                evaluations (Gatt and Krahmer, 2018; Howcroft
 also the creators and analysts of these systems. As
                                                                et al., 2020). The motivation behind using BN
 we move towards building safer and more ethical
                                                                is that they are reasonably easy to interpret, are
 systems, this lack of transparency needs to be
                                                                frequently used for the detection of anomalies in
 addressed. One key trait of a transparent system
                                                                the data (Tashman et al., 2020; Saqaeeyan et al.,
 is its ability to be able to explain its deductions
                                                                2020; Metelli and Heard, 2019; Mascaro et al.,
 and articulate the reasons for its actions in Natural
                                                                2014), and have been used to approximate deep
 Language (NL). As the area of Explainable AI
                                                                learning methods (Riquelme et al., 2018; Gal
 (XAI) grows and is mandated (cf. the EU General
                                                                and Ghahramani, 2016), which we could, in turn,
 Data Protection Regulation's “right to explanation”
                                                                explain in Natural Language.
 (Commission, 2018) and standardisation (cf. IEEE
 forthcoming standard on Transparency (P7001)),                 Secondly, we explore a wide range of automatic
 it has become ever more important to be able                   measures commonly used for evaluating NLG to

                                                           2376
Proceedings of the 16th Conference of the European Chapter of the Association for Computational Linguistics, pages 2376–2387
                            April 19 - 23, 2021. ©2021 Association for Computational Linguistics
understand if they capture the human-assessed explanations they provide are not necessarily aimed
quality of the corpus explanations. We then go on at the (non-expert) end-user and so are not always
to discuss their strengths and weaknesses through intuitive.
quantitative and qualitative analysis.
NLG has traditionally been broken down into
Our contributions are thus as follows: (1) a new “what” to say (content selection) and “how” to say
corpus of natural language explanations generated it (surface realisation) and can draw parallels with
by humans, who are asked to interpret Bayesian Natural Language explanations. In particular, it is
Network graphical representations, accompanied important to gauge how much content or how many
by subjective quality ratings of these explanations. reasons to present to the user, to inform them fully
This corpus can be used in various application without overloading them. For example, prior work
areas including Explainable AI, general Artificial has shown that people prefer shorter explanations
Intelligence, linguistics and NLP; (2) a study that offer only sufficient detail to be considered
of methods for evaluating explanations through useful (Harbers et al., 2009; Yuan et al., 2011).
automatic measures that reflect human judgements;
and (3) qualitative discussion into these metrics’ According to Miller et al. (2017), how explainers
sensitivity by examining specific explanations generate and select explanations depends on so-
varying on the Informativeness/Clarity scales. called pragmatic influences of causes, and they
found that people seem to prefer simpler and more
2 Related Work general explanations. Similarly, Lombrozo (2007)
notes that simplicity and generality might be the
Explanations are a core component of human key to evaluating explanations. This was partly
interaction (Scalise et al., 2017; Krening et al., the case described in (Chiyah Garcia et al., 2018),
2017; Madumal et al., 2019). In the context but here the users were experts and preferred to
of Machine Learning (ML), explanations should be given all possible reasons but as precise and
articulate the decision-making process of an ML brief as possible. It is clear from these prior
model explicitly, in a language familiar to people as works that explanations have to be evaluated in
communicators (De Graaf and Malle, 2017; Miller, the context of the scenario, prior knowledge and
2018). According to Plumb et al. (2018), three preferences of the explainee, and the intent and
of the most common types of explanation are: (1) goals of the explainer. These could be, for example,
global explanations, which describe the overall establishing trust (Miller et al., 2017), agreement,
behaviour of the entire model (Arya et al., 2019); satisfaction, or acceptance of the explanation and
(2) local explanations, commonly taking the form the system (Gregor and Benbasat, 1999).
of counterfactuals (Sokol and Flach, 2019) that
describe why particular events happened (known Somewhat analogous to auto-generated
also as “everyday explanations”); and (3) example- explanations are the fields of summarisation
based explanations that present examples from the of text (Tourigny and Capus, 1998; Deutch et al.,
training set to explain algorithmic behaviour (Cai 2016) and Question-Answering (Dali et al., 2009;
et al., 2019). Xu et al., 2017; Lamm et al., 2020). This is
because they provide users (expert and lay users)
Recently, various explanation systems provide with various forms of summaries (visual or textual)
different types of explanations for AI systems: and answers containing explanations to enable
the LIME method visually explains how sampling them to have a better understanding of content.
and local model training works by using local
interpretable model-agnostic explanations (Ribeiro Summarisation methods and sentence compression
et al., 2016); MAPLE can provide feedback for techniques can help to build comprehensive
all three types of explanations: example-based, explanations (Winatmoko and Khodra, 2013). With
local and global explanations (Plumb et al., 2018); regards to evaluating these summarisation methods,
CLEAR explains a single prediction by using Xu et al. (2020) proposed an evaluation metric that
local explanations that include statements of key weighted the facts present in the source document
counterfactual cases (White and d’Avila Garcez, according to the facts selected by a human-written
2019). Whilst these techniques and tools gain some (natural language) summary, by using contextual
ground in explaining deep machine learning, the embeddings. This evaluation of text accuracy
2377is indeed related to explanations because any in a two step process: (1) NL explanations were
explanation must contain enough statements to produced by human subjects; (2) in a separate
support decision-making and understanding. These study, these explanations were evaluated in terms
statements should be accurate and true. of Informativeness and Clarity.
The growing interest in the AI community to For Step 1, each subject was shown graphical
investigate the potential of NL explanations for representations of three Bayesian Networks (BN),
bridging the gap between AI and HCI has resulted in random order. They were then asked to produce
in an increasing number of NL explanations text to describe how they interpreted the BN.
datasets. The ELI5 dataset1 (Fan et al., 2019) is The three BN used in the data collection are
composed of explanations represented as multi- presented in Figure 1and represent well-known BN
sentence answers for diverse questions where users examples, extracted from Russell (2019). For Step
are encouraged to provide answers, which are 2 in a separate experiment, approximately 80 of
comprehensible for a five-year-old. WorldTree these generated explanations were presented to a
V22 (Jansen et al., 2019) is a corpus of Science- different set of subjects in random order, along
Domain that contains explanation graphs for with a scenario description and the graphical model
elementary science questions, where explanations image. Subjects were asked to rate them in terms of
represent interconnected sets of facts. CoS- Informativeness and Clarity. The worded scenario
E3 is a dataset of human explanations for descriptions were not given to subjects in the first
commonsense reasoning in the form of natural stage, so as not to prime them when generating
language sequences and highlighted annotations explanations.
(Rajani et al., 2019). Multimodal Explanations
Datasets (VQA-X and ACT-X) contain textual 3.1 Step 1: Natural Language Explanations
and visual explanations from human annotators Corpus
(Park et al., 2018). e-SNLI4 is a corpus of
Survey Instrument. A pilot was performed
explanations built on the question: “Why is a pair
to test options and ensure the completion time,
of sentences in a relation of entailment, neutrality,
leading to the final survey instrument. The
or contradiction?” (Camburu et al., 2018). Finally,
survey was divided into five sections: 1) consent
the SNLI corpus5 is a large annotated corpus for
form; 2) closed-ended questions related to English
learning natural language inference (Bowman et al.,
proficiency, computing and AI experience: “How
2015), considered one of the first corpora of NL
much computing experience do you have?”, “What
explanations.
is your English Proficiency Level?”, “How much
In this paper, we present a new corpus for NL experience do you have in the field of Artificial
explanations. The ExBAN corpus presented here Intelligence?”; 3) attention-check question, where
provides a valuable addition to this set of corpora participants received an image of a graphical model,
as it is aimed at explaining structured graphical and they had to select the correct answer(s) for the
models (in particular Bayesian Networks), that are given image; and 4) respondents were asked to
closely linked to ML methods. explain the three graphical models, in their own
words. All respondents received the graphical
3 ExBAN Corpus model survey questions in randomised order. The
appropriate ethical procedures were followed in
The ExBAN Corpus (Explanations for BAyesian
accordance with ethical standards, and ethical
Networks)6 consists of NL Explanations collected
approval was obtained.
1
https://facebookresearch.github.io/
ELI5/ Participants. 85 participants were recruited via
2
http://www.cognitiveai.org/ social media. English proficiency level, computing
explanationbank
3
https://github.com/salesforce/cos-e
experience and AI experience were rated on a
4
https://github.com/OanaMariaCamburu/ numerical scale, from 1 to 7 (1 = beginner,
e-SNLI 7 = advanced). The majority of participants
5
https://nlp.stanford.edu/projects/ (n = 83) rated their level of English proficiency
snli/
6
The data is openly released at https://github. with values higher than 5, with over half of the
com/MirunaClinciu/ExBAN participants rating their level as 7. Just 12% (n =
2378Figure 1. Annotated diagrams with assigned explanation references, where Diagram 1 represents a typical
Bayesian Network, Diagram 2 represents a multiply-connected network and Diagram 3 represents a simple
network with both discrete variables (Subsidy and Buys) and continuous variables (Harvest and Cost). Beneath
each diagram, the gold standard references are provided.
10) participants rated their computing experience of the context as well as instructions on how to
scores with a value lower than 5 and 82% (n = 70) approach these tasks. Here, we give the scenario
of participants had a high level of computing for Diagram 1 to illustrate this: “John and Mary
experience. Subjects had mixed experience with AI bought their dream home. To keep their home safe,
with over half (54%) having some experience (n = they installed a Burglary/Earthquake Alarm. Also,
46), but 46% of them had limited AI experience they received an instruction manual where they
(n = 39). found the following diagram: They are not sure
if they correctly understood the diagram. On the
Collected NL explanations. Quality control following pages are some worded explanations. We
of the collected data included a cleaning step need your help to evaluate them!”
where participants’ responses were hand-checked
and removed if the participants did not attempt For every BN image, the participants were
to complete the tasks. Explanations that asked to evaluate 5 explanations in terms
contained misspellings and missing punctuation of: Informativeness (Q: “How relevant the
were corrected manually (both the raw data information of an explanation is”; Likert scale,
and cleaned data are available). The number where 1 = Not Informative and 7 = Very
of explanations for each diagram, after the Informative); and Clarity (Q: “How clear the
data cleaning step are as follows: Diagram 1: meaning of an explanation is”; Likert scale, where
84 explanations, 1788 words; Diagram 2: 83 1 = Unclear and 7 = Very Clear).
explanations, 1987 words; and Diagram 3: 83
explanations, 1400 words. Participants. The final data collection survey was
advertised on social media as “a 10-minute survey,
3.2 Step 2: Human Evaluation for Quality where participants were asked to provide feedback
Survey Instrument. To investigate the quality of about how understandable the explanations of the
the explanations collected in Step 1, we performed three graphs are”. Demographic information was
a human evaluation of the generated explanations. collected (age range and gender). A total of 96
A pilot survey was performed to test and refine participants answered the survey. As screening
options, where respondents (n = 45) were criteria, participants had to complete all survey
recruited from Amazon Mechanical Turk and were questions. Post validation, we had a sample of
compensated monetarily. 56 participants consisting of 42 male participants
(75%), 11 female participants (19.6%) and 2
Each participant was given three tasks, each non-binary gender participants (3.6%). Gender
corresponding to the BN presented in Figure 1 imbalance might be due to “differences in female
with the order randomised. Along with the BN and male values operating in an online environment”
image, a simple description story was provided in (Smith, 2008). Half of the participants (n = 28)
order to give the subject a better understanding are aged between 23-29 years old, followed by
237930% of participants aged between 18-22 (n = 17), 4 NLG Evaluation Metrics
20% aged 40–49 (n = 11), 18% aged 30–39
Here, we describe the reasoning behind our choice
(n = 10). Previous studies have identified a high
of subjective measures that attempt to capture both
degree of inconsistency in human judgements of
the content and its correctness (Informativeness)
natural language (Novikova et al., 2018; Dethlefs
and quality of expression (Clarity). We also
et al., 2014); each participant can have a different
describe objective measures commonly used for
perception of the interpretation of these metrics,
automatic evaluation of NLG, and which we will
even if a definition of these metrics is provided.
extract from the ExBAN corpus.
Indeed, we found that in our data, explanation
ratings can vary significantly, with an explanation 4.1 Subjective NLG Evaluation Metrics
rated highly by one person for Clarity, but viewed
as very unclear by another annotator. This was the Human evaluation is considered a primary
case for both Clarity and Informativeness. evaluation criterion for NLG systems (Gatt and
Krahmer, 2018; Mellish and Dale, 1998; Gkatzia
We aim to create a reliable database of varying and Mahamood, 2015; Hastie and Belz, 2014).
quality of NL explanations, i.e. where the quality Through Explainable AI, we want to achieve
of explanations is generally uncontested by the Clarity and understanding in communicating the
majority. Therefore, subjective ratings were post- process of AI systems. Therefore, explanations
processed. For each explanation, we collected a should be clear and easily understood by users.
minimum of 3 judgments. Explanations received Traditional human evaluation metrics are clearly
ratings from 1 to 7; we classified bad explanations needed for increasing transparency, avoiding
as those with low ratings (ratingsand 2) embedding-based metrics, e.g. BERTScore words around them (McCormick and Ryan, 2019)).
and BLEURT (Sellam et al., 2020). Each of these
metrics is compared to one or more “Gold Standard” 5 Correlation Study of Automatic
text as inspired by the Machine Translation Metrics
community and adopted for evaluating document
As noted in the introduction, it remains an open
summarisation and NLG (Belz and Reiter, 2006).
question as to what degree the automatic metrics
The gold standard is normally a piece of natural
for NLG reviewed above can capture the quality
language text, annotated by humans as correct, i.e.
of NL explanations (Clinciu and Hastie, 2019).
a solution for a given task. Automatic evaluation is
Thus, we ran a correlation analysis to investigate
based on this gold standard, by verifying potential
the degree to which each of the automatic
similarity (Kovář et al., 2016). However, the
metrics correlates with human judgements using
selection of gold standards involves subjectivity
the ExBAN corpus, and which aspects of
and specificity (Kovář et al., 2016), and this is part
human evaluation (Clarity/Informativeness), such
of the reason that automatic metrics have received
automatic measures can capture. With regards
some criticism (Hardcastle and Scott, 2008).
to the choice of gold standard text, we picked
explanations that received the maximum score
BLEU (B) (Papineni et al., 2001) is widely used
in the human evaluation, in both Clarity and
in the field of NLG and compares n-grams of a
Informativeness. Gold standard explanations of
candidate text (e.g. that generated by an algorithm)
each diagram are presented in Figure 1.
with the n-grams of a reference text. The number of
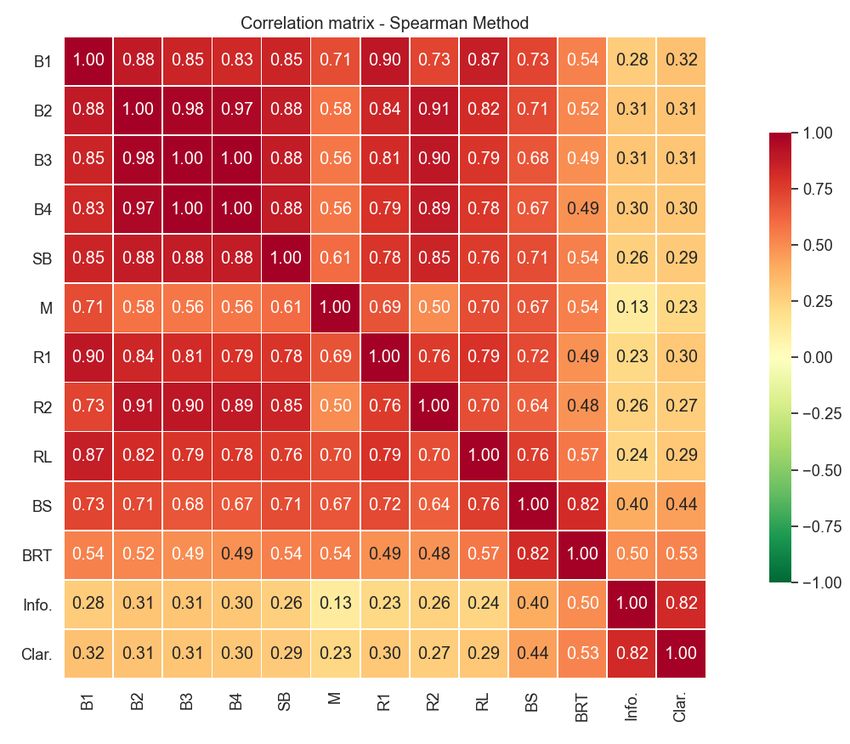
matches defines the goodness of the candidate text. 5.1 Results
SacreBLEU (SB) (Post, 2018) is a new version of
BLEU that calculates scores on the detokenized The correlations between automatic metrics and
text. METEOR (M) was created to try to address human ratings were computed using the Spearman
BLEU's weaknesses (Lavie and Agarwal, 2007). correlation coefficient. For each explanation, we
METEOR evaluates text by computing a score calculated the median of all the ratings given
based on explicit word-to-word matches between (median was calculated because the data is ordinal,
a candidate and a reference. When using multiple non-parametric rating data, as is also reported in
references, the candidate text is scored against Braun et al. (2018); Novikova et al. (2017)). These
each reference, and the best score is reported. medians were then correlated with the automatic
ROUGE (R) (Lin, 1971) evaluates n-gram overlap metric scores in Tables 2 and 3 and Figure 2. A
of the generated text (candidate) with a reference. summary of the results of the correlation analysis
ROUGE-L (RL) (Longest Common Subsequence) include the following:
computes the longest common subsequence (LCS) 1. Word-overlap metrics such as BLEU (n =
between a pair of sentences. 1,2,3,4), METEOR and ROUGE (n = 1,2)
presented low correlation with human ratings.
BERTScore (BS) (Zhang et al., 2020) is a token- 2. BERTScore and BLEURT outperformed other
level matching metric with pre-trained contextual metrics and produced higher correlation with
embeddings using BERT (Devlin et al., 2019) human ratings than other metrics on all
that matches words in candidate and reference diagrams. BERTScore values range between
sentences using cosine similarity. BLEURT [0.23, 0.43] and for BLEURT values range
(BRT) (Sellam et al., 2020) is a text generation between [0.26, 0.53].
metric also based on BERT, pre-trained on 3. Human ratings for Informativeness and
synthetic data; it uses random perturbations of Clarity are highly correlated with each other,
Wikipedia sentences augmented with a diverse set as observed in Figure 2 (r = 0.82).
of lexical and semantic-level supervision signals.
BLEURT uses a collection of metrics and models 5.2 Discussion
from prior work, including BLEU and ROUGE. BLEU-based metrics can be easily and quickly
Evaluation based on the meanings of words using computed; however, they do not correlate as well
embeddings (BERTScore, BLEURT) might capture with human ratings as other methods presented
some relevant features of explanations, as word here. This might be due to certain limitations,
representations are dynamically informed by the such as the fact that they rely on word overlap
2381and are not invariant to paraphrases. Furthermore,
they do not use recall, rather a Brevity Penalty,
which penalizes generated text for being “too short”
(Papineni et al., 2001). This way may not be
appropriate for explanations, as good explanations
may need to be lengthy by their very nature.
METEOR takes into consideration F1-measure by
computing scores for unigram precision and recall.
The fragmentation penalty is calculated using the
total number of matched words (m, averaged
over hypothesis and reference) and the number of
chunks. In this way, it could identify synonyms,
but perhaps not as well as the embedding-based
metrics, as evidenced by the correlation figures
in our results. With regards to ROUGE-based
Figure 2. Heatmap of Spearman rank correlation scores, due to the upper bound issues presented by
between automatic evaluation metrics and human
Schluter (2017), it is impossible to obtain perfect
evaluation metrics (Informativeness and Clarity)
ROUGE-n scores. Furthermore, ROUGE-L cannot
Metric Diagram 1 Diagram 2 Diagram 3 All Diagrams differentiate if the reference and the candidate have
BLEU-1 0.27 0.25 0.41* 0.31* the same longest common subsequence (LCS), but
BLEU-2 0.24 0.27 0.44* 0.33*
BLEU-3 0.15 0.23 0.39 0.26* different word ordering. Again, word ordering
BLEU-4 0.02 0.21 0.13 0.13 may be important for the explanation in terms of
SacreBleu 0.24 0.30 0.40* 0.30* explainee scaffolding (Palincsar, 1986).
METEOR 0.11 -0.04 0.16 0.09
Rouge-1 0.27 0.24 0.41* 0.29* It has been brought into question whether a single
Rouge-2 0.11 0.29 0.48* 0.29*
Rouge-L 0.29 0.28 0.34 0.29*
automatic measure is able to capture multiple
BERTScore 0.37 0.21 0.52* 0.37*
aspects of subjective human evaluation (Belz et al.,
BLEURT 0.25 0.38 0.58* 0.39* 2020). Thus, in order to understand to what
Significance of correlation: * denotes p-values < 0.05 degree the various metrics capture both Clarity
and Informativeness, we investigated individual
Table 2. Highest absolute Spearman correlation
explanations and their ratings. Table 4 gives
between automatic evaluation metrics and human
ratings for Informativeness, where the bold font some extracts from the dataset along with the
represents the highest correlation coefficient obtained automatic metrics and the human evaluation scores
by an automatic evaluation metric of Informativeness and Clarity. Based on these
human scores, the extracts are divided into:
Metric Diagram 1 Diagram 2 Diagram 3 All Diagrams
good explanations (high scores for both), bad
BLEU-1 0.25 0.09 0.34 0.24*
BLEU-2 0.24 0.15 0.41* 0.22 explanations (low scores for both) and mixed
BLEU-3 0.01 0.10 0.31 0.14 explanations (mixed scores). We can see here that
BLEU-4 -0.01 0.09 0.18 0.10
all metrics are reasonably good at capturing and
SacreBleu 0.16 0.15 0.38 0.23
METEOR 0.17 0.13 0.30 0.21
evaluating the ‘bad’ explanations with low scores
Rouge-1 0.20 0.11 0.29 0.20 across the board. However, only the BLEURT
Rouge-2 0 0.24 0.46* 0.22 metric is good at capturing both ‘good and bad’
Rouge-L 0.21 0.09 0.33 0.21
explanation ratings, as observed in the difference
BERTScore 0.33 0.23 0.43* 0.33*
BLEURT 0.26 0.22 0.53* 0.34*
in scores between these two categories. ROUGE-L
Significance of correlation: * denotes p-values < 0.05 and BERTScore do capture this difference in some
cases, but they are not as consistent as BLEURT.
Table 3. Spearman correlation between automatic The reason that BLEURT outperforms the other
evaluation metrics and human ratings for Clarity, metrics may be because it uses a combination of
where the bold font represents the highest correlation
word-overlap metrics as well as embeddings and
coefficient obtained by an automatic evaluation metric
thus may be capturing the best of these approaches.
2382Good Explanations B1 B2 B3 B4 SB M R1 R2 RL BS BRT Inf. Clar.
(1) The alarm is triggered by a burglary or an earthquake. 0.19 0.12 0.00 0.00 0.05 0.23 0.25 0.09 0.12 0.51 0.52 7 7
(2) Cloudy weather may produce rain and activation of the sprinkler.
0.28 0.11 0.00 0.00 0.05 0.15 0.36 0.10 0.28 0.49 0.65 7 7
Both rain and sprinkler activity makes the grass wet.
(3) Cost is dictated by the harvest (e.g. size) and
available subsidies (e.g. government tax break/subsidy). 0.18 0.09 0.00 0.00 0.02 0.07 0.25 0.09 0.12 0.20 0.51 7 7
Whether or not the product is bought depends on the cost.
Bad Explanations B1 B2 B3 B4 SB M R1 R2 RL BS BRT Inf. Clar.
(4) Sensors = Alarm = prevention or ALERT. 0.06 0.00 0.00 0.00 0.01 0.04 0.00 0.00 0.04 0.00 0.00 1 1
(5) A diagram detailing a system whose goal is to make grass wet. 0.08 0.00 0.00 0.00 0.02 0.00 0.11 0.00 0.12 0.13 0.00 1.5 2
(6) The harvest and subsidy contribute to the cost, cost then buys?? 0.28 0.00 0.00 0.00 0.03 0.15 0.36 0.00 0.24 0.20 0.30 2 1.5
Mixed Explanations B1 B2 B3 B4 SB M R1 R2 RL BS BRT Inf. Clar.
(7) The grass is getting wet. 0.08 0.00 0.00 0.00 0.00 0.20 0.13 0.00 0.15 0.24 0.16 1.5 7
(8) Subsidy and harvest independently affect cost. Cost affects buys. 0.06 0.00 0.00 0.00 0.01 0.14 0.16 0.00 0.10 0.25 0.56 6 2.5
(9) Cloud cover influences whether it rains and when the sprinkler is activated.
0.48 0.33 0.21 0.14 0.22 0.24 0.50 0.24 0.38 0.49 0.65 7 3
When either the sprinkler is turned on or when it rains, the grass gets wet.
Table 4. Examples of Good, Bad and Mixed Explanations according to human evaluation scores for
Informativeness and Clarity (medians of all ratings for that explanation), presented with their automatic measures
Although Clarity and Informativeness highly Embeddings are quite opaque in themselves.
correlate overall, there are occasions where Whilst some attempts have been made to visualise
explanations are rated by humans as higher them (Li et al., 2016), it remains that embedding-
on Clarity than Informativeness and visa-versa. based metrics do not provide much insight into
However, there are rarely any cases where Clarity is what makes a good/bad explanation. It would thus
high, and Informativeness is very low. Explanation be necessary to look more deeply into the linguistic
8 in Table 4 is the only example of this in phenomena that may indicate the quality of
our corpus. It is thus difficult to make any explanations. In ExBAN, initial findings show that
generalisations about this subset of the data. the number of nouns and coordinating conjunctions
However, it does seem to be the case that BLEURT correlate with human judgements, however further
is more sensitive to Informativeness than Clarity in-depth analysis is needed. Additional metrics
(e.g. explanation 7 vs 8-9 in the table), but a larger to add to the set explored here could include
study would be needed to show this empirically. grammar-based metrics, such as readability and
grammaticality, as in the study described in
6 Conclusions and Future work (Novikova et al., 2017).
Furthermore, an investigation is needed into the
Human evaluation is an expensive and time-
pragmatic and cognitive processes underlying
consuming process. On the other hand, automatic
explanations, such as argumentation, reasoning,
evaluation is a cheaper and more efficient method
causality, and common sense (Baaj et al., 2019).
for evaluating NLG systems. However, finding
Investigating whether these can be captured
accurate measures is challenging, particularly for
automatically will be highly challenging. We will
explanations. We have discussed word embedding
explore further the idea of adapting explanations to
techniques (Mikolov et al., 2013; Kim, 2014;
the explainee’s knowledge and expertise level, as
Reimers and Gurevych, 2020), which enable the
well as the explainer’s goals and intentions. One
use of pre-trained models and so reduces the need
such goal of the explainer could be to maximise the
to collect large amounts of data in our domain of
trustworthiness of the explanation (Ribeiro et al.,
explanations, which is a challenging task. The
2016). How this aspect is consistently subjectively
embedding-based metrics mentioned here perform
and objectively measured will be an interesting area
better than the word-overlap based ones. We
of investigation.
speculate that this is in part due to the fact that
the former capture semantics more effectively and Finally, the ExBAN corpus and this study will
are thus more invariant to paraphrases. These inform the development of NLG algorithms for
metrics have also been shown to be useful across NL explanations from graphical representations.
multiple tasks (Sellam et al., 2020) but with some We will explore NLG techniques for structured
variation across datasets (Novikova et al., 2017). data, such as graph neural networks and knowledge
Therefore, future work would involve examining graphs (Koncel-Kedziorski et al., 2019). Thus the
the effectiveness of automatic metrics across a corpus and metrics discussed here will contribute
wider variety of explanation tasks and datasets, as to a variety of fields linguistics, cognitive science
outlined in the Related Work section. as well as NLG and Explainable AI.
2383Acknowledgments Daniel Braun, Ehud Reiter, and Advaith Siddharthan.
2018. SaferDrive: An NLG-based behaviour change
This work was supported by the EPSRC Centre for support system for drivers. Natural Language
Doctoral Training in Robotics and Autonomous Engineering, 24(4).
Systems at Heriot-Watt University and the Carrie J. Cai, Jonas Jongejan, and Jess Holbrook.
University of Edinburgh. Clinciu’s PhD is 2019. The effects of example-based explanations
funded by Schlumberger Cambridge Research in a machine learning interface. In International
Limited (EP/L016834/1, 2018-2021). This Conference on Intelligent User Interfaces, Proceedings
IUI, volume Part F147615.
work was also supported by the EPSRC ORCA
Hub (EP/R026173/1, 2017-2021) and UKRI Oana-Maria Camburu, Tim Rocktäschel, Thomas
Lukasiewicz, and Phil Blunsom. 2018. e-snli: Natural
Trustworthy Autonomous Systems Node on Trust
language inference with natural language explanations.
(EP/V026682/1, 2020-2024). In Advances in Neural Information Processing Systems,
volume 31, pages 9539–9549. Curran Associates, Inc.
References Francisco Javier Chiyah Garcia, David A. Robb,
Xingkun Liu, Atanas Laskov, Pedro Patron, and Helen
Vijay Arya, Rachel K. E. Bellamy, Pin-Yu Chen, Hastie. 2018. Explainable autonomy: A study of
Amit Dhurandhar, Michael Hind, Samuel C. explanation styles for building clear mental models.
Hoffman, Stephanie Houde, Q. Vera Liao, Ronny In Proceedings of the 11th International Conference
Luss, Aleksandra Mojsilovic, Sami Mourad, Pablo on Natural Language Generation, pages 99–108,
Pedemonte, Ramya Raghavendra, John T. Richards, Tilburg University, The Netherlands. Association for
Prasanna Sattigeri, Karthikeyan Shanmugam, Computational Linguistics.
Moninder Singh, Kush R. Varshney, Dennis Wei,
and Yunfeng Zhang. 2019. One explanation does not Miruna-Adriana Clinciu and Helen Hastie. 2019. A
fit all: A toolkit and taxonomy of AI explainability Survey of Explainable AI Terminology. Proceedings
techniques. CoRR, abs/1909.03012. of the 1st Workshop on Interactive Natural Language
Technology for Explainable Artificial Intelligence
Ismaı̈l Baaj, Jean-Philippe Poli, and Wassila Ouerdane. (NL4XAI 2019), pages 8–13.
2019. Some insights towards a unified semantic
representation of explanation for eXplainable artificial European Commission. 2018. Article 22 EU GDPR
intelligence. In Proceedings of the 1st Workshop ”Automated individual decision-making, including
on Interactive Natural Language Technology profiling”. https://www.privacy-regulation.
for Explainable Artificial Intelligence (NL4XAI eu/en/22.htm. Accessed on 2021-01-25.
2019), pages 14–19. Association for Computational Lorand Dali, Delia Rusu, Blaž Fortuna, Dunja
Linguistics. Mladenić, and Marko Grobelnik. 2009. Question
Anja Belz and Eric Kow. 2009. System building answering based on semantic graphs. In CEUR
cost vs. output quality in data-to-text generation. Workshop Proceedings, volume 491.
In Proceedings of the 12th European Workshop on Maartje M.A. De Graaf and Bertram F. Malle. 2017.
Natural Language Generation, ENLG 2009. How people explain action (and autonomous intelligent
Anja Belz and Ehud Reiter. 2006. Comparing systems should too). In AAAI Fall Symposium -
automatic and human evaluation of NLG systems. Technical Report, volume FS-17-01 - FS-17-05.
In Proceedings of the 11th Conference of Nina Dethlefs, Heriberto Cuayáhuitl, Helen Hastie,
the European Chapter of the Association for Verena Rieser, and Oliver Lemon. 2014. Cluster-
Computational Linguistics, Trento, Italy. Association based prediction of user ratings for stylistic surface
for Computational Linguistics. realisation. In Proceedings of the 14th Conference
Anya Belz, Simon Mille, and David M. Howcroft. of the European Chapter of the Association for
2020. Disentangling the properties of human Computational Linguistics 2014, EACL 2014, pages
evaluation methods: A classification system to support 702–711. Association for Computational Linguistics
comparability, meta-evaluation and reproducibility (ACL).
testing. In Proceedings of the 13th International Daniel Deutch, Nave Frost, and Amir Gilad. 2016.
Conference on Natural Language Generation, Nlprov: Natural language provenance. In Proceedings
pages 183–194, Dublin, Ireland. Association for of the 42nd International Conference on Very Large
Computational Linguistics. Data Bases (VLDB) Endowment, volume 9, page
Samuel R. Bowman, Gabor Angeli, Christopher Potts, 1537–1540. VLDB Endowment.
and Christopher D. Manning. 2015. A large annotated Jacob Devlin, Ming-Wei Chang, Kenton Lee, and
corpus for learning natural language inference. In Kristina Toutanova. 2019. BERT: Pre-training
Proceedings of the 2015 Conference on Empirical of deep bidirectional transformers for language
Methods in Natural Language Processing, pages 632– understanding. In Proceedings of the 2019 Conference
642, Lisbon, Portugal. Association for Computational
of the North American Chapter of the Association
Linguistics.
2384for Computational Linguistics: Human Language of the Sixth International Conference on Language
Technologies, Volume 1 (Long and Short Papers), pages Resources and Evaluation (LREC’08), Marrakech,
4171–4186, Minneapolis, Minnesota. Association for Morocco. European Language Resources Association
Computational Linguistics. (ELRA).
Finale Doshi-Velez and B. Kim. 2017. Towards Helen Hastie and Anja Belz. 2014. A comparative
a rigorous science of interpretable machine learning. evaluation methodology for NLG in interactive
arXiv: Machine Learning. systems. In Proceedings of the 9th International
Conference on Language Resources and Evaluation,
Ondřej Dušek, Jekaterina Novikova, and Verena Rieser. LREC 2014.
2020. Evaluating the State-of-the-Art of End-to-
End Natural Language Generation: The E2E NLG David M. Howcroft, Anya Belz, Miruna-Adriana
Challenge. Computer Speech & Language, 59:123– Clinciu, Dimitra Gkatzia, Sadid A. Hasan, Saad
156. Mahamood, Simon Mille, Emiel van Miltenburg,
Sashank Santhanam, and Verena Rieser. 2020. Twenty
Angela Fan, Yacine Jernite, Ethan Perez, David years of confusion in human evaluation: NLG needs
Grangier, Jason Weston, and Michael Auli. 2019. evaluation sheets and standardised definitions. In
ELI5: Long form question answering. In Proceedings Proceedings of the 13th International Conference on
of the 57th Annual Meeting of the Association Natural Language Generation, pages 169–182, Dublin,
for Computational Linguistics, pages 3558–3567, Ireland. Association for Computational Linguistics.
Florence, Italy. Association for Computational
Linguistics. Peter A. Jansen, Elizabeth Wainwright, Steven
Marmorstein, and Clayton T. Morrison. 2019.
Yarin Gal and Zoubin Ghahramani. 2016. Dropout WorldTree: A corpus of explanation graphs for
as a bayesian approximation: Representing model elementary science questions supporting multi-hop
uncertainty in deep learning. In Proceedings of The inference. In Proceedings of the 11th International
33rd International Conference on Machine Learning, Conference on Language Resources and Evaluation
volume 48 of Proceedings of Machine Learning (LREC), pages 2732–2740. European Language
Research, pages 1050–1059, New York, New York, Resources Association (ELRA).
USA. PMLR.
Yoon Kim. 2014. Convolutional neural networks
Albert Gatt and Emiel Krahmer. 2018. Survey of the for sentence classification. In Proceedings of
state of the art in natural language generation: Core the 2014 Conference on Empirical Methods in
tasks, applications and evaluation. Journal of Artificial Natural Language Processing (EMNLP), pages 1746–
Intelligence Research, 61:1–64. 1751, Doha, Qatar. Association for Computational
Dimitra Gkatzia and Saad Mahamood. 2015. A Linguistics.
snapshot of NLG evaluation practices 2005 - 2014. Rik Koncel-Kedziorski, Dhanush Bekal, Yi Luan,
In Proceedings of the 15th European Workshop on Mirella Lapata, and Hannaneh Hajishirzi. 2019. Text
Natural Language Generation (ENLG), pages 57– Generation from Knowledge Graphs with Graph
60, Brighton, UK. Association for Computational Transformers. In Proceedings of the 2019 Conference
Linguistics. of the North American Chapter of the Association
Ben Goodrich, Vinay Rao, Peter J. Liu, and for Computational Linguistics: Human Language
Mohammad Saleh. 2019. Assessing the factual Technologies, Volume 1 (Long and Short Papers), pages
accuracy of generated text. In Proceedings of the ACM 2284–2293, Minneapolis, Minnesota. Association for
SIGKDD International Conference on Knowledge Computational Linguistics.
Discovery and Data Mining. Vojtěch Kovář, Miloš Jakubı́ček, and Aleš Horák.
Shirley Gregor and Izak Benbasat. 1999. Explanations 2016. On evaluation of natural language processing
from intelligent systems: Theoretical foundations and tasks: Is gold standard evaluation methodology a good
implications for practice. MIS Quarterly: Management solution? In ICAART 2016 - Proceedings of the
Information Systems, 23(4). 8th International Conference on Agents and Artificial
Intelligence, volume 2, pages 540–545. SciTePress.
Kevin A. Hallgren. 2012. Computing Inter-Rater
Reliability for Observational Data: An Overview Samantha Krening, Brent Harrison, Karen M. Feigh,
and Tutorial. Tutorials in Quantitative Methods for Charles Lee Isbell, Mark Riedl, and Andrea Thomaz.
Psychology, 8(1). 2017. Learning From Explanations Using Sentiment
and Advice in RL. IEEE Transactions on Cognitive
Maaike Harbers, Karel Van Den Bosch, and John and Developmental Systems, 9(1).
Jules Ch Meyer. 2009. A study into preferred
explanations of virtual agent behavior. In Lecture Klaus Krippendorff. 1980. Metodologı́a de análisis de
Notes in Computer Science (including subseries contenido. Teorı́a y práctica. SAGE, 2004.
Lecture Notes in Artificial Intelligence and Lecture Sawan Kumar and Partha Talukdar. 2020. NILE
Notes in Bioinformatics), volume 5773 LNAI. : Natural language inference with faithful natural
David Hardcastle and Donia Scott. 2008. Can we language explanations. In Proceedings of the 58th
evaluate the quality of generated text? In Proceedings Annual Meeting of the Association for Computational
2385Linguistics, pages 8730–8742, Online. Association for David Maxwell, Leif Azzopardi, and Yashar
Computational Linguistics. Moshfeghi. 2017. A study of snippet length and
informativeness behaviour, performance and user
Matthew Lamm, Jennimaria Palomaki, Chris Alberti, experience. In SIGIR 2017 - Proceedings of the 40th
Daniel Andor, Eunsol Choi, Livio Baldini Soares, and International ACM SIGIR Conference on Research
Michael Collins. 2020. Qed: A framework and dataset and Development in Information Retrieval.
for explanations in question answering.
Chris McCormick and Nick Ryan. 2019. Bert word
Gerasimos Lampouras and Ion Androutsopoulos. 2013. embeddings tutorial. Accessed on 2021-01-25.
Using integer linear programming for content selection,
lexicalization, and aggregation to produce compact C. Mellish and R. Dale. 1998. Evaluation in the context
texts from OWL ontologies. In Proceedings of of natural language generation. Computer Speech and
the 14th European Workshop on Natural Language Language, 12(4).
Generation, pages 51–60, Sofia, Bulgaria. Association
for Computational Linguistics. Silvia Metelli and Nicholas Heard. 2019. On
bayesian new edge prediction and anomaly detection
Alon Lavie and Abhaya Agarwal. 2007. METEOR: in computer networks. Annals of Applied Statistics,
An automatic metric for MT evaluation with high 13(4).
levels of correlation with human judgments. In
Proceedings of the Second Workshop on Statistical Tomas Mikolov, Kai Chen, Greg Corrado, and
Machine Translation, pages 228–231, Prague, Czech Jeffrey Dean. 2013. Efficient estimation of word
Republic. Association for Computational Linguistics. representations in vector space. In 1st International
Conference on Learning Representations, ICLR 2013
David B. Leake. 2014. Evaluating Explanations. - Workshop Track Proceedings.
Psychology Press.
Tim Miller. 2018. Explanation in Artificial
Chris van der Lee, Emiel Krahmer, and Sander Intelligence: Insights from the Social Sciences.
Wubben. 2017. PASS: A Dutch data-to-text system arXiv preprint arXiv:1706.07269.
for soccer, targeted towards specific audiences. In
Proceedings of the 10th International Conference on Tim Miller, Piers Hower, and Liz Sonenberg. 2017.
Natural Language Generation, pages 95–104, Santiago Explainable AI: beware of inmates running the asylum.
de Compostela, Spain. Association for Computational In Proceedings of the IJCAI 2017 workshop on
Linguistics. explainable artificial intelligence (XAI), October, page
363.
Jiwei Li, Xinlei Chen, Eduard Hovy, and Dan Jurafsky.
2016. Visualizing and understanding neural models Jekaterina Novikova, Ondřej Dušek, Amanda
in NLP. In Proceedings of the 2016 Conference Cercas Curry, and Verena Rieser. 2017. Why we
of the North American Chapter of the Association need new evaluation metrics for NLG. In Proceedings
for Computational Linguistics: Human Language of the 2017 Conference on Empirical Methods
Technologies, pages 681–691, San Diego, California. in Natural Language Processing, pages 2241–2252,
Association for Computational Linguistics. Copenhagen, Denmark. Association for Computational
Linguistics.
Chin-Yew Lin. 1971. ROUGE: A Package for
Automatic Evaluation of Summaries Chin-Yew. Jekaterina Novikova, Ondřej Dušek, and Verena”
Information Sciences Institute, 34(12). Rieser. 2018. RankME: Reliable human ratings for
natural language generation. In Proceedings of the
Tania Lombrozo. 2007. Simplicity and probability in 2018 Conference of the North American Chapter of
causal explanation. Cognitive Psychology, 55(3):232– the Association for Computational Linguistics: Human
257. Language Technologies, Volume 2 (Short Papers),
pages 72–78, New Orleans, Louisiana. Association for
Prashan Madumal, Liz Sonenberg, Tim Miller, and Computational Linguistics.
Frank Vetere. 2019. A grounded interaction protocol
for explainable artificial intelligence. In Proceedings Annemarie Sullivan Palincsar. 1986. The role
of the International Joint Conference on Autonomous of dialogue in providing scaffolded instruction.
Agents and Multiagent Systems, AAMAS, volume 2. Educational Psychologist, 21(1-2):73–98.
Joy Mahapatra, Sudip Kumar Naskar, and Sivaji Kishore Papineni, Salim Roukos, Todd Ward, Wei-jing
Bandyopadhyay. 2016. Statistical natural language Zhu, and Yorktown Heights. 2001. IBM Research
generation from tabular non-textual data. In INLG Report Bleu : a Method for Automatic Evaluation of
2016 - 9th International Natural Language Generation Machine Translation. Science, 22176:1–10.
Conference, Proceedings of the Conference.
Dong Huk Park, Lisa Anne Hendricks, Zeynep Akata,
Steven Mascaro, Ann Nicholson, and Kevin Korb. Anna Rohrbach, Bernt Schiele, Trevor Darrell, and
2014. Anomaly detection in vessel tracks using Marcus Rohrbach. 2018. Multimodal Explanations:
Bayesian networks. In International Journal of Justifying Decisions and Pointing to the Evidence. In
Approximate Reasoning, volume 55. Proceedings of the IEEE Computer Society Conference
on Computer Vision and Pattern Recognition, pages
8779–8788. IEEE Computer Society.
2386Gregory Plumb, Denali Molitor, and Ameet Talwalkar. generation. In Proceedings of the 58th Annual Meeting
2018. Model agnostic supervised local explanations. of the Association for Computational Linguistics, pages
In Advances in Neural Information Processing Systems, 7881–7892, Online. Association for Computational
volume 2018-December. Linguistics.
Matt Post. 2018. A call for clarity in reporting BLEU William Smith. 2008. Does Gender Influence Online
scores. In Proceedings of the Third Conference on Survey Participation? A Record-Linkage Analysis of
Machine Translation: Research Papers, pages 186– University Faculty Online Survey Response Behavior.
191, Belgium, Brussels. Association for Computational Accessed on 2021-01-25.
Linguistics.
Kacper Sokol and Peter A. Flach. 2019. Counterfactual
Nazneen Fatema Rajani, Bryan McCann, Caiming Explanations of Machine Learning Predictions:
Xiong, and Richard Socher. 2019. Explain yourself! Opportunities and Challenges for AI Safety. In
leveraging language models for commonsense Workshop on Artificial Intelligence Safety 2019
reasoning. In Proceedings of the 2019 Conference co-located with the Thirty-Third AAAI Conference
of the Association for Computational Linguistics on Artificial Intelligence 2019 (AAAI-19), Honolulu,
(ACL2019). Hawaii, January 27, 2019, volume 2301 of CEUR
Workshop Proceedings. CEUR-WS.org.
Nils Reimers and Iryna Gurevych. 2020. Sentence-
BERT: Sentence embeddings using siamese BERT- Zaid Tashman, Christoph Gorder, Sonali Parthasarathy,
networks. In Proceedings of the EMNLP-IJCNLP Mohamad M. Nasr-Azadani, and Rachel Webre. 2020.
2019 - 2019 Conference on Empirical Methods in Anomaly detection system for water networks
Natural Language Processing and 9th International in northern ethiopia using bayesian inference.
Joint Conference on Natural Language Processing, Sustainability (Switzerland), 12(7).
Proceedings of the Conference.
Nicole Tourigny and Laurence Capus. 1998. Learning
Marco Tulio Ribeiro, Sameer Singh, and Carlos summarization by using similarities. International
Guestrin. 2016. ”why should i trust you?” explaining Journal of Phytoremediation, 21.
the predictions of any classifier. In Proceedings
of the ACM SIGKDD International Conference on Adam White and Artur S. d’Avila Garcez. 2019.
Knowledge Discovery and Data Mining, volume 13-17- Measurable counterfactual local explanations for any
August-2016. classifier. CoRR, abs/1908.03020.
Carlos Riquelme, George Tucker, and Jasper Snoek. Yosef Ardhito Winatmoko and Masayu Leylia Khodra.
2018. Deep Bayesian bandits showdown: An empirical 2013. Automatic Summarization of Tweets in
comparison of Bayesian deep networks for Thompson Providing Indonesian Trending Topic Explanation.
sampling. In Proceedings of the 6th International Procedia Technology, 11.
Conference on Learning Representations, ICLR 2018, Bowen Xu, Zhenchang Xing, Xin Xia, and David
Vancouver, BC, Canada, April 30 - May 3, 2018, Lo. 2017. AnswerBot: Automated generation of
Conference Track Proceedings. OpenReview.net. answer summary to developers’ technical questions.
S. Russell. 2019. Human Compatible: Artificial In Proceedings of the 32nd IEEE/ACM International
Intelligence and the Problem of Control. Penguin Conference on Automated Software Engineering (ASE
Publishing Group. 2017).
Sasan Saqaeeyan, Hamid Haj Seyyed Javadi, and Xinnuo Xu, Ondřej Dušek, Jingyi Li, Verena Rieser,
Hossein Amirkhani. 2020. Anomaly detection in smart and Ioannis Konstas. 2020. Fact-based content
homes using Bayesian networks. KSII Transactions on weighting for evaluating abstractive summarisation.
Internet and Information Systems, 14(4). In Proceedings of the 58th Annual Meeting of
the Association for Computational Linguistics, pages
Rosario Scalise, Stephanie Rosenthal, and Siddhartha 5071–5081, Online. Association for Computational
Srinivasa. 2017. Natural language explanations in Linguistics.
human-collaborative systems. In Proceedings of
the Companion of the 2017 ACM/IEEE International Changhe Yuan, Heejin Lim, and Tsai-Ching Lu. 2011.
Conference on Human-Robot Interaction, HRI ’17, Most relevant explanation in bayesian networks. The
page 377–378, New York, NY, USA. Association for Journal of Artificial Intelligence Research, 42(1):309–
Computing Machinery. 352.
Natalie Schluter. 2017. The limits of automatic Jeffrey C. Zemla, Steven Sloman, Christos
summarisation according to ROUGE. In Proceedings Bechlivanidis, and David A. Lagnado. 2017.
of the 15th Conference of the European Chapter Evaluating everyday explanations. Psychonomic
of the Association for Computational Linguistics: Bulletin & Review, 24(5):1488–1500.
Volume 2, Short Papers, pages 41–45, Valencia, Spain. Tianyi Zhang, Varsha Kishore, Felix Wu,
Association for Computational Linguistics. Kilian Q. Weinberger, and Yoav Artzi. 2020.
Thibault Sellam, Dipanjan Das, and Ankur Parikh. BERTScore: Evaluating Text Generation with
2020. BLEURT: Learning robust metrics for text BERT. In International Conference on Learning
Representations.
2387You can also read