Modular fluorescent nanoparticle DNA probes for detection of peptides and proteins
←
→
Page content transcription
If your browser does not render page correctly, please read the page content below
www.nature.com/scientificreports
OPEN Modular fluorescent nanoparticle
DNA probes for detection
of peptides and proteins
Cassandra M. Stawicki1,2, Torri E. Rinker1,2*, Markus Burns1, Sonal S. Tonapi1,
Rachel P. Galimidi1, Deepthi Anumala1, Julia K. Robinson1, Joshua S. Klein1 & Parag Mallick1
Fluorescently labeled antibody and aptamer probes are used in biological studies to characterize
binding interactions, measure concentrations of analytes, and sort cells. Fluorescent nanoparticle
labels offer an excellent alternative to standard fluorescent labeling strategies due to their enhanced
brightness, stability and multivalency; however, challenges in functionalization and characterization
have impeded their use. This work introduces a straightforward approach for preparation of
fluorescent nanoparticle probes using commercially available reagents and common laboratory
equipment. Fluorescent polystyrene nanoparticles, Thermo Fisher Scientific FluoSpheres, were used
in these proof-of-principle studies. Particle passivation was achieved by covalent attachment of
amine-PEG-azide to carboxylated particles, neutralizing the surface charge from − 43 to − 15 mV. A
conjugation-annealing handle and DNA aptamer probe were attached to the azide-PEG nanoparticle
surface either through reaction of pre-annealed handle and probe or through a stepwise reaction of
the nanoparticles with the handle followed by aptamer annealing. Nanoparticles functionalized with
DNA aptamers targeting histidine tags and VEGF protein had high affinity (EC50s ranging from 3 to
12 nM) and specificity, and were more stable than conventional labels. This protocol for preparation
of nanoparticle probes relies solely on commercially available reagents and common equipment,
breaking down the barriers to use nanoparticles in biological experiments.
Fluorescently labeled antibody and aptamer probes are used to visualize and quantify biological molecules in
the fields of biology, chemistry, and biomedicine1. They are employed in applications to study receptor-ligand
binding in plate-based assays2, single-molecule fluorescent microscopy a nalyses3, and flow cytometry4 , as well
as in applications requiring cell-type specific targeting such as theranostics5–7 and in vivo imaging8,9. Several
characteristics are universally important for fluorescent probes: stability, affinity, brightness, and biocompat-
ibility. Conventional fluorescent labels such as luminescent metal complexes, proteins, and organic dyes can
suffer from insufficient brightness, poor stability, and p hotobleaching10–12. In addition, traditional labels often
chemically interact with biomolecules to the detriment of both the fluorescent probe and the biological s ystem13.
Nanoparticles offer numerous advantages over conventional labels. First, fluorescent nanoparticles can be
much brighter than conventional labels due to their high molar extinction coefficients and quantum yields14,15.
Second, nanoparticles have high photostability due to protective encapsulation of fluorescent dyes or to the
mechanism of their fl uorescence12,16. Finally, nanoparticles can be coated with biologically inert chemicals like
poly(ethylene–glycol) (PEG) to improve b iocompatibility17. Several types of nanoparticles have been used as
fluorescent labels16,18,19, each with its own unique set of advantages and disadvantages. Dye-doped polymer par-
ticles are composed of polymer matrices such as polystyrene or polyacrylate and encapsulate fluorescent dyes.
Polymeric nanoparticles are inexpensive, bright, easy to functionalize, and biocompatible; however, they interact
non-specifically if insufficiently passivated and are subject to photobleaching, albeit on far greater time scales
than conventional labels16. Quantum dots, which are composed of semiconducting materials and are intrinsically
fluorescent, have high quantum yields and molar extinction coefficients, are very photostable, and can be modi-
fied with exterior organic capping to enhance b iocompatibility20; however, quantum dots are cytotoxic, limiting
21
their use in vitro and in vivo . Furthermore, quantum dots blink, which can be a hinderance in single-molecule
studies12. Evaluation of other nanoparticle types, such as gold, up-converting, carbon, and silica nanoparticles,
as fluorescent labels is o ngoing18.
1
Nautilus Biotechnology, 201 Industrial Rd #310, San Carlos, CA 94070, USA. 2These authors contributed equally:
Cassandra M. Stawicki and Torri E. Rinker. *email: torrir@nautilus.bio
Scientific Reports | (2021) 11:19921 | https://doi.org/10.1038/s41598-021-99084-4 1
Vol.:(0123456789)www.nature.com/scientificreports/
Although fluorescent nanoparticles may offer improvements to conventional labels, challenges in synthesis,
functionalization, and passivation have limited their use. For example, incorporating dyes into silica nanoparticles
or polymeric matrices requires a detailed understanding of fluorophore quenching behavior and expertise in
emulsion and polymerization techniques16,19,22. The synthesis of quantum dots requires specialized equipment for
techniques like e-beam lithography, formation of microemulsions, and sputtering for vapor-phase synthesis23,24.
Once synthesized, nanoparticles require specialized equipment for characterization, such as electron microscopy,
not available to every laboratory16,25. After synthesis, nanoparticles are functionalized by attaching probes to the
surface, an often arduous and expensive process that requires specific e xpertise26,27. For example, in the case of
silica nanoparticles, a reaction with (3-aminopropyl)triethoxysilane (APTES) is often used to introduce a biocom-
patible amine-functionality to the particle, but this reaction must be controlled to avoid APTES polymerization
and can require additional chemical modification to allow compatibility with probe functional groups28,29. In
addition to functionalizing the nanoparticle with an active chemistry, the affinity reagent must be functionalized
with a compatible conjugation handle. Reagents attached to common chemical moieties like thiols and amines are
readily available from commercial vendors, but specialized and often more desirable functional groups require
custom synthesis and characterization. Finally, achieving sufficient passivation on the nanoparticle surface can
be technically challenging. For instance, quantum dots must be capped with hydrophilic materials, like amphi-
philic polymers, to improve solubility and colloidal stability in aqueous s olutions23,30. For polymeric particles,
passivation prevents undesirable interactions with the biological environment. Moreover, the passivated layer
provides functional groups for further attachment of probes16. Although individual solutions to nanoparticle
challenges have been identified, no common set of best practices is available.
To simplify the preparation and use of nanoparticle-based probes, we set out to develop a protocol using
off-the-shelf reagents to generate fluorescent nanoparticle probes. For proof-of-principle experiments, commer-
cially available dye-laden polystyrene nanoparticles (FluoSpheres, Thermo Fisher Scientific) and quantum dots
(Qdot 655 ITK Carboxyl Quantum Dots, Thermo Fisher Scientific) were chosen due to their stability, brightness,
and biocompatibility. These nanoparticles were modified with PEG to improve affinity and colloidal stability.
Finally, aptamer probes were attached to the particle by annealing disparate probes to a common oligonucleo-
tide conjugated to a chemical moiety for covalent attachment to the nanoparticle; we call this oligonucleotide
the conjugation-annealing handle. This modular design allows nanoparticles to be easily functionalized with
a new probe. In our proof-of-concept studies, we demonstrated the utility of our method by functionalizing
FluoSphere and Qdot fluorescent nanoparticles with previously described DNA aptamer p robes31,32. Our studies
show that our fluorescent nanoparticle probes meet the stability, affinity, brightness, biocompatibility, modular-
ity, and reagent availability requirements necessary for a fluorescent label. We provide a supplemental protocol
with easy-to-follow instructions so that other researchers can create their own fluorescent nanoparticle probes.
Results
Fluorescent nanoparticle probe fabrication. Our method consists of three steps: passivation with
chemically active PEG, attachment of a conjugation-annealing handle to enhance modularity, and attachment of
a DNA-based aptamer probe (Fig. 1). All materials used in this fabrication method are commercially available
(Table 1). For initial protocol optimization and characterization, 40-nm and 200-nm yellow-green or dark-red
FluoSpheres, which are nanoparticles encapsulating fluorescent dyes within a polymeric polystyrene matrix,
were used as the nanoparticle label. To attach the passivating PEG-layer, the FluoSpheres were activated with
1-ethyl-3-(3-dimethylaminopropyl)carbodiimide/N-hydroxysuccinimide (EDC/NHS) and reacted with PEG
functionalized with an amine and an azide moiety for DNA conjugation. We attached the conjugation-annealing
handle and DNA aptamer probe to the nanoparticle either through a single reaction between the nanoparticle
and the pre-annealed probe complex or through a stepwise reaction with conjugation of the handle to the nano-
particle followed by annealing of the aptamer (Fig. 1A). The handle consists of a 3′ dibenzocyclooctyne (DBCO)
for conjugation to the PEG layer and either a 24-base-pair annealing sequence (Illumina P7 primer s equence33)
or a poly-T sequence (21 thymidine bases; Fig. 1B). The aptamer includes a complementary sequence that
anneals to the handle. The optimized protocol is included in the Supplementary Information.
Optimization of nanoparticle PEGylation. To demonstrate that methoxy-PEG (mPEG) was effectively
conjugated to the nanoparticles, we first introduced either 1.6-kDa mPEG-amine (reactive), mPEG-OH (unre-
active), or buffer only at a concentration of 108 PEG molecules/particle and examined the impact of PEG con-
jugation on nanoparticle zeta potential. Zeta potential measurements rely on scattering of incident laser light
to measure the velocity of particle motion under application of an electric field34. Changes in zeta potential of
reacted particles indicate consumption of highly negatively charged carboxylate groups during conjugation and
charge-shielding of any remaining negative charge by the PEG layer35, which should only occur if chemical con-
jugation has occurred. Zeta potentials of − 43 mV in the buffer-treated and mPEG-OH-treated samples indicated
minimal non-specific interactions of PEG with the activated nanoparticle. The zeta potential was − 15.4 mV
when nanoparticles were incubated with 1 08 mPEG-amine molecules/particle (Fig. 2A), indicating that PEGyla-
tion occurred via covalent linkage to carboxylate-modified nanoparticles. Next, we tested a range of PEG graft-
ing densities by evaluating the zeta potential of nanoparticles reacted with 1 06 to 108 PEG molecules/particle.
Increased PEG density reduced the magnitude of negative nanoparticle surface charge from – 35 to − 14 mV,
suggesting a more highly passivated particle at higher PEG densities (Fig. 2B).
We also evaluated the impact of PEG molecular weight on nanoparticle surface charge and colloidal stability.
Colloidal stability was inferred by dynamic light scattering (DLS). In DLS, particle velocity is measured by sub-
jecting the nanoparticle suspension to an incident laser and measuring the constructive and destructive interfer-
ence patterns produced by scattered light over time, which can then be used to calculate the hydrodynamic radius
Scientific Reports | (2021) 11:19921 | https://doi.org/10.1038/s41598-021-99084-4 2
Vol:.(1234567890)www.nature.com/scientificreports/
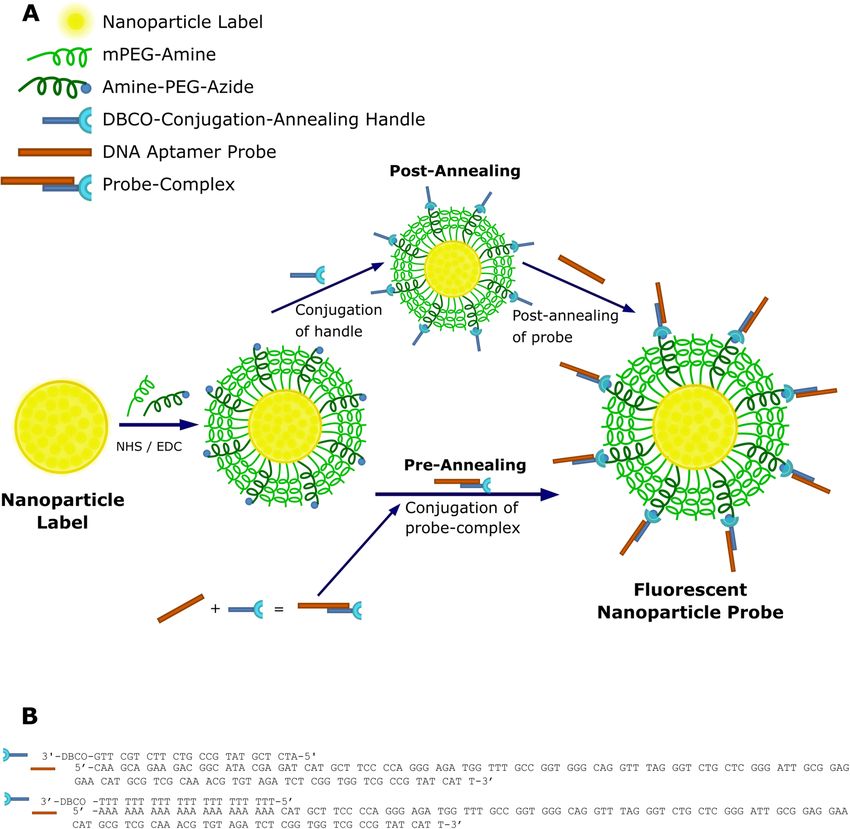
Figure 1. Fluorescent nanoparticle probe fabrication and DNA aptamer probe attachment. (A) Carboxylate-
modified nanoparticle labels are PEGylated for passivation and click chemistry modification using a
combination of mPEG-amine and amine-PEG-azide and NHS/EDC chemistry. DNA aptamer probes are
attached to the particles via annealing to the conjugation-annealing handle either before or after it is conjugated
to the PEG layer. Figure is not to scale. (B) The conjugation-annealing handle is used to conjugate a DNA
aptamer probe to the nanoparticle. The same handle can be used to conjugate different aptamer probes. The
handle consists of a DNA sequence complementary to a short region on the 5′ end of the DNA aptamer probe
and a DBCO functional group on the 3′ end for covalent attachment to the particle. The DNA aptamer probe
consists of a variable probe region that can bind to a target of interest and an annealing region that allows
attachment to the conjugation-annealing handle.
anoparticles34,36. In general, PEGs with molecular weights of about 2 kDa (PEG-45) or larger are used for
of the n
nanoparticle passivation37, so we tested PEGs ranging from PEG-12 to PEG-112. As the molecular weight of PEG
increased, nanoparticle surface charge neutralization increased, indicative of more complete passivation. PEG-
112, the longest polymer tested, had the greatest decrease from an activated zeta potential of − 46 mV to a final
zeta potential of − 7.75 mV (Fig. 2C). PEG-112-conjugated particles had a polydispersity index (PDI) of 0.36 and
hydrodynamic diameter of 628 nm; particles conjugated with lower molecular weight PEGs had PDIs of 0.04–0.1
and diameters of 332–394 nm (Fig. 2D,E). As PDIs greater than 0.1 suggest nanoparticle aggregation34, PEG-112
was eliminated from further study. Particles conjugated to PEG-45 had a zeta potential of − 17 mV, a PDI of 0.11
and diameter of 369 nm, indicating that passivation was achieved and colloidal stability was maintained. Thus,
PEG-45 was used for all subsequent studies at a concentration of 3.5 × 10⁷ PEG molecules per 200-nm particle
and 1.4 × 10⁵ PEG molecules per particle for 40-nm nanoparticles (Fig. S1).
We hypothesized that a higher percentage of azide-PEG-amine would allow conjugation of more probes
per particle, which would result in higher affinity of the nanoparticle probe to its target. We compared mPEG-
amine:azide-PEG-amine ratios of 75:25, 95:5, 99.5:0.5, 99.95:0.05, and 99.995:0.005 in protein binding studies.
Scientific Reports | (2021) 11:19921 | https://doi.org/10.1038/s41598-021-99084-4 3
Vol.:(0123456789)www.nature.com/scientificreports/
Component of fluorescent nanoparticle probe Vendor Catalog No Product name
FluoSpheres Carboxylate-Modified Microspheres, 0.04 µm, yellow-
Thermo Fisher Scientific F8795
green fluorescent (505/515), 5% solids, azide free
FluoSpheres Carboxylate-Modified Microspheres, 0.2 µm, yellow-
Thermo Fisher Scientific F8811
Nanoparticle label green fluorescent (505/515), 5% solids
FluoSpheres Carboxylate-Modified Microspheres, 0.2 µm, dark-red
Thermo Fisher Scientific F8807
fluorescent (660/680), 5% solids
Thermo Fisher Scientific Q21321MP Qdot 655 ITK Carboxyl Quantum Dots
Creative PEGWorks PHB-1882 Amine-PEG-azide, MW 2 kDa
Passivation and Functionalization
Creative PEGWorks PLS-269 mPEG-Amine, MW 2 kDa
Conjugation annealing handle Integrated DNA Technologies Custom sequence; Table 3 < custom_sequence > /iSp9//3DBCON/, HPLC purification
DNA aptamer probe Integrated DNA Technologies Custom sequence; Table 3 20 nmole Ultramer
Table 1. Commercially available reagents for fluorescent nanoparticle probes.
Similar on-target binding was observed at the 75:25 and 95:5 ratios, while lower binding was observed for ratios
with less azide-PEG-amine (Fig. S2). To achieve the highest binding possible while conserving reagents, we
selected a ratio of 95:5 mPEG-amine:azide-PEG-amine for the remainder of these studies.
Quantification of DNA aptamer probe‑to‑nanoparticle ratio. Next, we evaluated changes in parti-
cle charge and size with addition of the conjugation-annealing handle and of the DNA aptamer probe. The addi-
tion of the handle to the nanoparticle surface increased the overall negative charge on the nanoparticle from − 13
to − 19 mV, and subsequent annealing of the DNA aptamer probe further increased negative charge to − 21 mV
(Fig. 3A). Nanoparticle diameter increased as each component was added from 335 nm for the PEGylated par-
ticle to 367 nm for fully functionalized fluorescent nanoparticle probes (Table 2). The PDI remained close to
0.1, indicating that colloidal stability was maintained. The decrease in surface charge and slight increase in size
indicated successful attachment of both the conjugation-annealing handle and the probe to the nanoparticle.
Next, we quantified aptamer attachment to the nanoparticles using qPCR, a technique commonly used to
measure the quantity of DNA on a n anoparticle38. Amplification was performed on oligonucleotides removed
from fabricated nanoparticles by heat. The number of DNA molecules was determined by comparing cycle
threshold (Ct) values of the experimental group to a standard curve of the DNA aptamer. About 430 DNA
aptamer probes were detected per 200 nm particle (Fig. 3B). For particles treated with a negative-control aptamer,
which did not have sequence complementary to the conjugation-annealing handle, about 50 aptamers were
detected per particle.
In addition, we quantified the number of conjugation-annealing handles/nanoparticle by reacting 40 nm
PEGylated particles with a fluorescently labeled conjugation-annealing handle. The number of oligonucleotides
per particle increased with the concentration of input conjugation-annealing handle and no attachment was
observed for the non-DBCO containing control (Fig. S3). In addition, the ratio of 20 conjugation-annealing
handles per 40 nm particle aligns well with the ratio of 430 aptamers per 200 nm particles when differences in
surface area are accounted for. Overall, these data indicate successful aptamer attachment and negligible non-
specific binding between non-specific oligonucleotides and nanoparticles.
Assessment of fluorescent nanoparticle probe binding. We used a plate-based binding assay to
determine whether the addition of the label to the probe altered the binding affinity of the probe and to inter-
rogate the differences between several probe attachment methods. In these proof-of-principle studies, we used
the B1 aptamer, which binds histidine tags31, as our probe. A biotinylated B1 probe detected with traditional
detection methods (amplification of signal by streptavidin HRP or conjugation to a fluorescently labeled strepta-
vidin conjugate) bound histidine-histidine-histidine (HHH) peptide with an observed equilibrium dissociation
constant (Kd) of 55 nM (Figure S4A,B), comparable to the reported Kd of 120 nM31.
We evaluated specific and non-specific binding of the fluorescent nanoparticle probes against on-target (HHH
peptide, His-tagged Her2 protein) and off-target (Ecoli Lysate, a proline-asparagine-glycine (PNG) peptide, and
Myoglobin) biomolecules. When we evaluated binding of the nanoparticle probes to his-tagged Her2 protein,
we observed a twofold higher binding by the B1 probe than by the nanoparticles functionalized with a negative
control aptamer and observed no binding to Ecoli Lysate (Fig. 4A). Similar results were seen for off-target bind-
ing to myoglobin (Fig. 4B). To further investigate non-specific binding, we conducted the assay with HHH and
PNG peptides, as the PNG peptide is not recognized by the B1 aptamer . Streptavidin AlexaFluor 647 Conjugate, a
conventional label, was used as a control to ensure that specific and non-specific binding were not due to the label
type. Nanoparticles were functionalized with the B1 (on-target) and Her239 (off-target) aptamers to differentiate
non-specific binding by the aptamer versus non-specific binding due to the functionalized nanoparticle. Both
the Streptavidin AlexaFluor 647 Conjugate and fluorescent nanoparticle B1 probe bound to the HHH peptide,
but we observed minimal non-specific binding to the PNG peptide (Fig. 4C). Nanoparticles functionalized with
the Her2 aptamer did not bind detectably to either HHH or PNG peptides. Taken together, these results provide
evidence that both particle passivation and probe attachment were successful.
Scientific Reports | (2021) 11:19921 | https://doi.org/10.1038/s41598-021-99084-4 4
Vol:.(1234567890)www.nature.com/scientificreports/
Figure 2. PEGylation of carboxylate-modified FluoSpheres. (A) Zeta potential measurements for carboxylated
FluoSpheres activated with NHS/EDC and reacted with mPEG-amine, mPEG-OH, or buffer only. Data are
means ± standard deviation of three measurements per sample for one of two independent experiments,
analyzed in duplicate. (B) Zeta potential measurements for carboxylated FluoSpheres activated with NHS/
EDC and reacted with increasing concentrations of mPEG-amine. Data are means ± standard deviation
of one experiment, analyzed in triplicate. Table lists theoretical distances between PEG molecules at each
concentration. (C–E) FluoSpheres were conjugated with PEGs of indicated molecular weights, and (C) zeta
potentials, (D) PDIs, and (E) hydrodynamic diameters were determined. Shown are means ± standard deviation
of three measurements per sample, n = 2–3.
Finally, we evaluated a concentration titration of fluorescent nanoparticle B1 probes against the his-tagged
Her2 protein. The half maximal response concentration, E C50, was an average of 5.2 nM (Fig. 4D). This E
C50
value is lower than what was previously reported (120 nM)31 and what we found experimentally with other
conventional labels (55 nM; Fig. S4B). We hypothesize that this apparent increase in affinity could result from
avidity effects, as described in the Discussion Section.
Attachment of alternate aptamers to fluorescent nanoparticles. To demonstrate modularity of
the fluorescent nanoparticle probe system, nanoparticles were functionalized with H3T, a truncated version of
the B1 a ptamer31, and a VEGF aptamer32. These aptamers bind their targets when they are detected with more
traditional methods (Fig. S4B,C). We tested the binding of the HHH peptide by the nanoparticle H3T probe
using a plate-based assay. The nanoparticles bound to the peptide target with an average EC50 of 12 nM (Fig. 5A),
stronger affinity than the E
C50 of 30 nM found using a more traditional detection approach (Fig. S4B) and that
reported in literature (120 nM)31. Nanoparticle probes functionalized with the VEGF aptamer bound VEGF
protein and not an off-target protein with an average EC50 of 5.5 nM (Fig. 5B). This demonstrates the modularity
of our probe attachment approach.
Scientific Reports | (2021) 11:19921 | https://doi.org/10.1038/s41598-021-99084-4 5
Vol.:(0123456789)www.nature.com/scientificreports/
Stage in nanoparticle fabrication Particle diameter (nm) Polydispersity index (PDI) Zeta potential (mV)
Activated Nanoparticle 335 ± 3.0 0.13 − 46.9 ± 1.0
PEGylated Nanoparticle 367 ± 6.0 0.12 − 17.3 ± 0.3
Fluorescent Nanoparticle Probe 367 ± 0.1 0.12 − 21.1 ± 1.5
Table 2. Summary of particle diameter, PDI, and zeta potential of EDC/NHS activated carboxylate-modified
FluoSpheres, PEGylated FluoSpheres and fluorescent nanoparticle probes of a 200-nm diameter. Data are
shown as means ± standard deviation.
Figure 3. Characterization of DNA aptamer probe attachment to PEGylated nanoparticle. (A) Zeta potential
measurements after PEGylation, conjugation of conjugation-annealing handle, and annealing of DNA aptamer
probe. Data are means ± standard deviation of one experiment, analyzed in triplicate. (B) qPCR quantification
of aptamer numbers for particles functionalized with complementary polyA aptamer or non-complementary
(negative control) polyT aptamer. Data shown are means ± standard deviation, n = 3.
Alternative attachment strategies. Finally, we evaluated the on-target binding of fluorescent nano-
particle probes fabricated using pre-annealing or post-annealing of the aptamer to the nanoparticle (Fig. 1A).
Pre-annealed and post-annealed fluorescent nanoparticle B1 probes were used to detect an on-target his-tagged
protein in a plate-based binding assay. Both pre- and post-annealed particles detected the his-tagged protein
with stronger affinity than the off-target myoglobin protein, but at the highest probe concentrations tested, the
pre-annealed particles showed twofold higher binding to his-tagged protein than did the post-annealed particles
(Fig. S5). To explain these differences, further experimentation is required, but we hypothesize that the concen-
tration of probe mixed with the particles in the post-annealing protocol was not high enough to fully saturate
available conjugation-annealing handles.
In addition to annealing the probe to the particle, we evaluated a more traditional attachment approach by
directly conjugating a DBCO-modified aptamer to the PEG-azide layer. We evaluated pre-annealed particles
and the directly conjugated particles in plate-based binding assays against his-tagged protein. Although both
approaches resulted in higher on-target protein binding than off-target binding, the probe prepared using the
pre-annealing approach had on-target binding that was about twofold greater than the probe prepared using
direct conjugation approach (Fig. S6). Additional studies will be required to determine the reason for this effect.
These results indicate that both pre- and post-annealing of aptamers to nanoparticles can be used to achieve
specific binding and that annealing approaches are as good as or better than traditional conjugation approaches.
The pre-annealing fabrication was used in subsequent experiments.
Comparison to alternative commercial labeling options. To understand how our nanoparticle
labels compare to commercially available labels, we conducted a series of studies to compare affinity, stability,
and brightness of the fluorescent nanoparticle probe to off-the-shelf labels including Streptavidin AlexaFluor
647 Conjugate, Streptavidin APC Conjugate, and Streptavidin SureLight APC. In a plate-based binding assay, we
compared the EC50 of our fluorescent nanoparticle B1 probe to commercially available labels attached to bioti-
nylated B1 aptamer (Fig. 6A). The fluorescent nanoparticle probe had binding affinity approximately equivalent
to that of Streptavidin SureLight APC, with average EC50s of 2.7 and 9.9 nM, respectively. Streptavidin Alex-
Scientific Reports | (2021) 11:19921 | https://doi.org/10.1038/s41598-021-99084-4 6
Vol:.(1234567890)www.nature.com/scientificreports/
Figure 4. Fluorescent nanoparticle B1 probe binds specifically to HHH peptide and his-tagged protein.
(A) Fluorescence signals as a function of concentration of nanoparticle B1 probe and negative control probe
upon binding to his-tagged Her2 protein (on-target) and Ecoli lysate (off-target). Data are presented as
means ± standard deviation, n = 3. (B) Signal from nanoparticle B1 probe against his-tagged Her2 (on-target)
and myglobin (off-target). Data are presented as means ± standard deviation, n = 3. (C) Fluorescence signals
from fluorescent nanoparticle B1 and Her2 probes and B1 and Her2 Streptavidin 647 conjugates against HHH
(on-target) or PNG (off-target) peptides. Data is from a single experiment. (D) A representative binding curve
of the B1 probe against his-tagged Her2 used to calculate EC50 values. The table shows EC50 values obtained
from 4 replicates run across two experiments and reports mean ± standard deviation.
aFluor 647 and Streptavidin APC Conjugates had average E C50 values of 43 nM and 28 nM, respectively. The
total number of binding sites per label may impact observed binding affinity due to avidity effects. Information
from the vendor indicates that Streptavidin AlexaFluor 647 Conjugate and the Streptavidin APC Conjugate con-
sist of one streptavidin per label, resulting in approximately three biotinylated probe binding sites per label. The
Streptavidin SureLight APC consists of multiple streptavidin and APC molecules per conjugate, and conversa-
tions with the vendor indicated that the total number of binding sites can vary batch-to-batch. Although more
studies will be required to fully understand the observed results, we conclude that the affinity of the fluorescent
nanoparticle B1 probe is equal to or greater than commercially available labels.
To compare stabilities of fluorescent labels, we evaluated on-target and off-target binding over 16 weeks.
The fluorescent nanoparticle B1 probe showed consistent binding affinity for 12 weeks, whereas the SureLight
APC, Streptavidin APC, and Streptavidin AlexaFluor 647 conjugates showed diminished probe affinity at 1
and 2 weeks post fabrication (Fig. 6B). While binding was diminished, fluorescence intensity over 2 weeks was
consistent for all labels, although a slight decrease was observed for Streptavidin APC Conjugate (Fig. S7). This
suggests that the alternative labels have reduced affinity for their targets over time, whereas affinity of the fluo-
rescent nanoparticle probe is maintained for several months.
Finally, we evaluated the relative brightness of the fluorescent nanoparticle and alternative labels. The fluores-
cent nanoparticles were four to fivefold brighter than Streptavidin SureLight APC and Streptavidin AlexaFluor
647 Conjugate labels on a molar basis (Fig. 6C). In summary, the fluorescent nanoparticle probes had superior
stability and brightness as compared to alternative labels.
Scientific Reports | (2021) 11:19921 | https://doi.org/10.1038/s41598-021-99084-4 7
Vol.:(0123456789)www.nature.com/scientificreports/
Figure 5. Fluorescent nanoparticles functionalized with various aptamers bind specifically. (A) Representative
binding curve for fluorescent nanoparticle H3T probe against HHH peptide. The table shows E C50
values obtained from 3 replicates run across two experiments and reports mean ± standard deviation. (B)
Representative binding curve for fluorescent nanoparticle VEGF probe against VEGF (on-target) and
myoglobin (off-target). The table shows E
C50 values obtained from 4 replicates run across two experiments and
reports mean ± standard deviation.
Use of an alternative nanoparticle core. Finally, we assessed if target specificity was similar when the
same functionalization method was applied to a different nanoparticle core, the commercially available Qdot
655 ITK Carboxyl Quantum Dots. In a plate-based assay, binding affinity for his-tagged Her2 protein was about
2.4-fold higher than background, and the measured EC50 was 55 nM (Fig. 7). We observed little off-target bind-
ing. As noted above, observed affinity can be impacted by both avidity and the detection method, and further
studies will be needed to determine why the affinity was lower for the nanoparticle probes with a Qdot core than
a FluoSphere core. Overall, this experiment demonstrates that our protocol is robust to swap-in of an alternative
core.
Discussion
In these studies, we describe a straightforward method for fabrication of fluorescent nanoparticle probes with the
aim of enabling broader use of nanoparticle-based labels. Our protocol utilizes commercially available reagents
to create nanoparticle probes with high affinity and brightness, good biocompatibility and colloidal stability,
modularity, and long-lasting activity. The first step of our method is nanoparticle passivation. As nanoparticle
surfaces tend to non-specifically adsorb proteins15,16,40–42, dense PEG layers are commonly used to passivate
particles due to favorable interactions with water molecules that energetically disfavor interactions with other
biomolecules 35,43. For the fluorescent nanoparticle probes presented here, nanoparticles were PEGylated using
industry-standard techniques that reduce protein b inding37,42. We optimized PEG density and molecular weight
to maximize particle passivation while maintaining colloidal stability. As PEG density and molecular weight
increased, particle passivation increased. This was expected as short, low-density and low-molecular-weight PEG
grafting results in a “mushroom” conformation, ineffective at passivating surfaces, whereas high-density and
high-molecular-weight PEG grafting results in “brush” conformations, leading to highly effective passivation35,43,44
(Supplementary Information, PEG Density Calculations). With optimized PEGylation conditions, off-target nano-
particle probes showed low non-specific binding to proteins. The zeta potential of our nanoparticles was never
neutral, however, suggesting that passivation of the particle surface was not complete. We may be able to improve
PEGylation of 200-nm particles by increasing the PEG concentration until we see a plateau in zeta potential
as we observed for 40 nm particles. Additionally, mixing high and low molecular weight PEGs has been used
to improve surface passivation in single molecule detection experiments45, and could also improve passivation
of nanoparticle surfaces. Finally, we could evaluate other passivating polymer and surfactant c ombinations46.
The next step of our method is the attachment of the conjugation-annealing handle and the DNA aptamer
probe. In many probe-labeling protocols, each new probe requires optimization, which can be time-consuming
Scientific Reports | (2021) 11:19921 | https://doi.org/10.1038/s41598-021-99084-4 8
Vol:.(1234567890)www.nature.com/scientificreports/
Figure 6. Fluorescent nanoparticle probes compare favorably to commercially available labels. (A) Comparison
of EC50 values for fluorescent nanoparticle B1 probe (“Fluorescent NP Probe”), B1 Streptavidin SureLight APC
(“Surelight APC”), B1 Streptavidin AlexaFluor 647 Conjugate (“AF-647 Conjugate”), and B1 Streptavidin APC
Conjugate (“APC Conjugate”) against HHH peptide targets. Representative binding curves are shown at the
right. Data is shown as box and whisker plots, where the box extends from the 25th to 75th percentiles, the
middle line represents the median, the “ + ” represents the mean, and the whiskers show max and min values.
Each point represents an EC50 from an experimental replicate, n ≥ 3. (B) Fluorescence intensities from binding
curves of fluorescent nanoparticle B1 probe, B1 Streptavidin AlexaFluor 647 Conjugate, and B1 Streptavidin
APC Conjugate against HHH targets at noted timepoints post fabrication. Data shown are from one experiment.
(C) Signal intensity versus concentration of the fluorescent nanoparticle probe, Streptavidin APC Conjugate,
and Streptavidin AlexaFluor 647 Conjugate. Note that the plateau for the nanoparticles is due to the linear range
of the plate reader ending at ~ 20,000 AU. Data shown are means ± standard deviation, n = 3.
and expensive. Our strategy largely avoids this by achieving modularity via a conjugation-annealing handle, a
short DNA sequence designed to anneal aptamer probes on the 5′ end and to covalently attach to the PEG layer
Scientific Reports | (2021) 11:19921 | https://doi.org/10.1038/s41598-021-99084-4 9
Vol.:(0123456789)www.nature.com/scientificreports/
Figure 7. Fluorescent nanoparticle probes can be prepared with a quantum dot core. (A) Binding curves of
Qdot fluorescent nanoparticle B1 probe to his-tagged Her2 (on-target) and myoglobin (off-target) proteins.
Data show means of duplicates from one experiment.
through a DBCO moiety on the 3′ end. By utilizing the conjugation-annealing handle, a multitude of probes
can be prepared without needing to functionalize each probe with a conjugation handle. Here, we highlight
this modularity by demonstrating activity of fluorescent nanoparticles functionalized with B1 and its truncated
version H3T, both designed to bind his-tags, and an aptamer that binds the VEGF p rotein32. The probe can be
attached to the conjugation-annealing handle before or after conjugation to the particle so fluorescent nano-
particles conjugated to the handle can be prepared in large batches. This method could also be used to prepare
antibody probes functionalized with a short DNA sequence complementary to the conjugation-annealing handle.
Our strategy eliminates problems arising from incompatible chemical modifications of commonly available
functionalized nanoparticles and antibodies. One limitation of this approach is that the probes are not covalently
attached to the nanoparticles. In our hands, nanoparticle probes were stable for months, but if necessary, stronger
attachment could be achieved by optimizing the annealing sequences or employing non-natural nucleotides,
such as locked nucleic a cid47.
We used the B1 aptamer in proof-of-principle experiments due to its high affinity and potential utility in
other applications. B1 binds his-tags that are used for the isolation of recombinant proteins via immobilized
metal affinity c hromatography48. The fluorescent nanoparticle B1 probe bound both peptides and proteins spe-
cifically. Both the B1 aptamer and its truncated version, H3T, bound targets with EC50 values ranging from 3 to
12 nM, lower than the 120 nM affinities previously reported for these a ptamers31. Although this suggests that
attachment to the nanoparticle increases aptamer affinity, it is important to note that we report concentration on
a nanoparticle probe basis, but local concentration of probe may be much higher due to the multivalent nature
of the nanoparticle p robe20. Furthermore, the presence of multiple probes per nanoparticle could help stabilize
the interaction with the target, decreasing the off-rate and thus reducing the EC5049,50. This avidity is a major
advantage over traditional labels, which only have one probe per fluorescent label. When we compared fluorescent
nanoparticle labels to other off-the-shelf labels, we found that the affinity increased as the ratio of probe to label
increased. In addition, when we varied the percentage of PEG with a conjugation handle for probe binding, we
noted that higher percentages results in increased probe binding to the target. We hypothesize that both observed
effects are due to avidity. We note that EC50 measurements are highly dependent on the experimental conditions
and do not provide the kinetic information. Studies that utilize approaches like surface plasmon resonance will
improve our understanding of how the fluorescent nanoparticle label impacts probe binding kinetics.
The type of nanoparticle used in the creation of fluorescent nanoparticle probes will depend upon the specific
research application. The protocol we describe can be used with different nanoparticle types as demonstrated
by our validation of Qdot-based probes. B1 probes with a Qdot core showed specific binding to a his-tagged
protein and an HHH peptide with E C50 values of 55 nM. This E C50 is higher than that measured with the
FluorSphere-based probe, possibly due to lower affinity, inadequate detection of Qdot fluorescence, or fewer
probes per nanoparticle. Thus, this strategy is highly versatile but will likely require some optimization studies
when utilizing a new nanoparticle core.
The fluorescent nanoparticle probes described in this work have brightness profiles and stability on par or
better than other commercially available labeling techniques, have high affinity for targets, minimal non-specific
binding, and are biocompatible. Our nanoparticle probes take inspiration from nanotechnologies used in other
applications: Polystyrene nanoparticles have been used in vitro to study targeted cellular interactions and uptake
by conjugating cell membrane-targeting moieties to the nanoparticle s urface51,52, and quantum dots have been
functionalized with aptamers for use as theranostic agents in targeted cancer drug delivery applications53–56 and
as biomolecule sensors57. Previous applications have involved use of custom probes, nanoparticles, or conjugation
chemistries, making broad adoption challenging. In contrast, each component of the fluorescent nanoparticle
probes presented here is commercially available. In addition, our approach is modular, enabling the same core
to be used for multiple probes. We successfully generated nanoparticle probes against his-tags and the VEGF
Scientific Reports | (2021) 11:19921 | https://doi.org/10.1038/s41598-021-99084-4 10
Vol:.(1234567890)www.nature.com/scientificreports/
Component Name Annealing region Oligonucleotide sequence (annealing region in bold)
5′-CAA GCA GAA GAC GGC ATA CGA GATCAT GCT TCC CCA GGG AGA
TGG TTT GCC GGT GGG CAG GTT TAG GGT CTG CTC GGG ATT GCG
P7-B1 or B1 P7
GAG GAA CAT GCG TCG CAA ACG TGT AGA TCT CGG TGG TCG CCG
TAT CAT T-3′
5′-AAA AAA AAA AAA AAA AAA AAACAT GCT TCC CCA GGG AGA TGG
TTT GCC GGT GGG CAG GTT TAG GGT CTG CTC GGG ATT GCG GAG
polyA-B1 polyA
GAA CAT GCG TCG CAA ACG TGT AGA TCT CGG TGG TCG CCG TAT CAT
T-3′
5′- CAA GCA GAA GAC GGC ATA CGA GATGTT TGC CGG TGG GCA GGT
H3T P7 TTA GGG TCT GCT CGG GAT TGC GGA GGA ACA TGC GTC GCA AAC
GTG TAG ATC TCG GTG GTC GCC GTA TCA TT -3′
5′- CAA GCA GAA GAC GGC ATA CGA GATTCT AAA AGG ATT CTT CCC
DNA aptamer probe Her2 P7 AAG GGG ATC CAA TTC AAA CAG CGT GTA GAT CTC GGT GGT CGC
CGT ATC ATT -3′
5′-AGC GTC TCT CGA TCT CAT TCT CAG GTG GGG GGT ATA TTT AGA
polyA-Aptamer2 polyA GAC GGA AGA TCG AGA GCA AGC GTT GTT TTG ATG GCC CAA AAA
AAA AAA AAA AAA AAA-3′
5′-AGC GTC TCT CGA TCT CAT TCT CAG GTG GGG GGT ATA TTT AGA
polyT-Aptamer2 polyT GAC GGA AGA TCG AGA GCA AGC GTT GTT TTG ATG GCC CTT TTT
TTT TTT TTT TTT TTT-3′
5′ CAA GCA GAA GAC GGC ATA CGA GATTCA AGT GGT CAT GTA CTA
Negative-control Aptamer (Fig. 4) P7
GTC AA -3′
5′- CAA GCA GAA GAC GGC ATA CGA GATCCC GTC TTC CAG ACA AGA
VEGF P7
GTG CAG GGG TGT AGA TCT CGG TGG TCG CCG TAT CAT T -3′
DBCO-polyT polyT 5′-TTT TTT TTT TTT TTT TTT TTT-DBCO-3′
Conjugation-annealing handle
DBCO-P7 (revcom) P7 reverse complement 5′-ATC TCG TAT GCC GTC TTC TGC TTG-DBCO-3′
5′-[DBCO-C7]-CAA GCA GAA GAC GGC ATA CGA GAT CAT GCT TCC CCA
GGG AGA TGG TTT GCC GGT GGG CAG GTT TAG GGT CTG CTC GGG
DBCO-B1 NA
ATT GCG GAG GAA CAT GCG TCG CAA ACG TGT AGA TCT CGG TGG
TCG CCG TAT CAT T-3′
5′-/5Biosg/CA TGC TTC CCC AGG GAG ATG GTT TGC CGG TGG GCA GGT
Direct attachment Biotin-B1
TTA GGG TCT GCT CGG GAT TGC GGA GGA ACA TGC GTC GCA AAC-3′
5′-/5Biosg/TC TAA AAG GAT TCT TCC CAA GGG GAT CCA ATT CAA ACA
Biotin-Her2
GC-3′
5′-/5Biosg/GTT TGC CGG TGG GCA GGT TTA GGG TCT GCT CGG GAT
Biotin-H3T
TGC GGA GGA ACA TGC GTC GCA AAC-3′
Table 3. Oligonucleotides for the generation of fluorescent nanoparticle probes.
protein with little specialized equipment and reagents that were all commercially available. In the future, clini-
cally relevant DNA, RNA, protein, or small-molecule based probes could be conjugated to the particles using
a similar technique.
We have highlighted the utility of the nanoparticle probes for studying probe-target interactions in plate-based
assays, but this could be extended to single-molecule studies and flow cytometry. The brightness and resistance
to photobleaching of single nanoparticle labels make these probes particularly suitable for both applications.
In addition, the nanoparticle probes developed in this work could be used for targeted cellular uptake studies,
and the surface functionalization techniques could be extended to create nanoparticles capable of controlled
release for intracellular biomolecule delivery. Finally, the modularity of the probe attachment approach allows
extension of this method to include other types of biological probes such as proteins and small molecules. In
sum, the method for fabricating fluorescent nanoparticle probes described could have vast applications with
only slight modifications and will enable researchers to achieve fluorescent sensitivity that is unattainable with
traditional labeling approaches.
Materials and methods
Materials for nanoparticle functionalization and passivation. Table 1 lists the vendors and catalog
numbers for materials used in these studies. Carboxylate-modified FluoSpheres and QDot nanoparticles were
purchased from Thermo Fisher Scientific. mPEG-amine (molecular weight (MW): 2000 g/mol) and azide-PEG-
amine (MW: 2048 g/mol) were from Creative PEGWorks. DNA conjugation annealing handles and probes were
purchased from Integrated DNA Technologies (IDT) or Eurofins Scientific; sequences are listed in Table 3.
Nanoparticle dispersion and washing. To ensure that nanoparticles are well-distributed in an aqueous
solution, tubes of particles were dispersed by pipetting up and down while partially immersed in a sonication
bath (Branson Bransonic Ultrasonic Cleaner 8510R-DTH). Nanoparticle washes were performed as follows: (1)
nanoparticles were centrifuged at 31,000 × g for 30 min (pre-PEGylation) or 60 min (post-PEGylation) in a 1.5-
mL tube; (2) supernatant was removed, taking care not to disturb the pellet; (3) appropriate volume of buffer was
added; and (4) the pellet was redispersed by pipetting up and down while sonicating until no large aggregates of
nanoparticles were visible.
Scientific Reports | (2021) 11:19921 | https://doi.org/10.1038/s41598-021-99084-4 11
Vol.:(0123456789)www.nature.com/scientificreports/
Nanoparticle activation and PEGylation. Carboxylate-modified microspheres were purchased from
Thermo Fisher Scientific. According to Thermo Fisher Scientific technical support, the carboxylate modified
polystyrene particles are generated by copolymerizing a carboxylic acid-containing monomer with styrene.
Carboxylate-modified microspheres were activated by reacting 5.3 × 10¹³ or 1.7 × 10¹¹ nanoparticles/mL for
40-nm and 200-nm nanoparticles, respectively, with 50 mM (N-3-dimethylaminopropyl)-N’-ethylcarbodiim-
ide hydrochloride (EDC; Sigma) and 100 mM N-hydroxysuccinimide sodium salt (NHS; Sigma) in 20 mM
2-(N-morpholino)ethanesulfonic acid (MES; Sigma), pH 6, 500 mM NaCl at 24 °C for 1 h, shaking at 800 revolu-
tions per minute (RPM) on a ThermoMixer dry block. The protocol outlined here was generally performed on
5.3 × 10¹³ 40-nm nanoparticles or 2.13 × 10¹⁰ 200-nm nanoparticles (see Supplementary Information, Fluorescent
Nanoparticle Probe Protocol). Particles were washed, resuspended in 1 mL phosphate buffer saline (PBS; 10 mM
Na2HPO4, 1.8 mM KH2PO4, 137 mM NaCl, 2.7 mM KCl, pH 7.4), and washed again. Particles were resuspended
in a 100 mg/mL 95:5 mPEG-amine:azide-PEG-amine solution (Table 1) in PBS such that the PEG:nanoparticle
molar ratio was 3.5 × 10⁷ and 1.4 × 10⁵ for 200- and 40-nm nanoparticles, respectively. The reaction was incu-
bated at 24 °C for 1 h shaking at 800 RPM. Then, 250 µl/180 PBS was added to the sample and samples were
washed twice with resuspension in 500/125 µl PBS for 40-nm/200-nm nanoparticles, respectively.
Quantum dots were functionalized using the same procedure with the following modifications: the nano-
particles were activated by reacting 7.23 × 10¹⁴ nanoparticles/mL with 5 mM EDC and 10 NHS. For PEGyla-
tion, nanoparticles were resuspended in 100 mg/mL of a 75:25 mPEG-amine:azide-PEG-amine in PBS to a
PEG:nanoparticle molar ratio of 2 × 10⁴.
DNA aptamer probe attachment. For both pre-annealing and post-annealing processes, 125 µM of the
DNA aptamer probe-complex or the conjugation annealing handle was reacted with particles at a 30,000:1,
125:1, or 25:1 DNA:nanoparticle molar ratio for 200-nm FluoSpheres, 40-nm FluoSpheres, or Qdots, respec-
tively. For pre-annealing, the probe and the handle were combined at concentrations of 125 µM each and incu-
bated at 95 °C for 5 min and at room temperature for 10 min, and 10 × PBS was added to the complex to a
final concentration of 1 × PBS. The complex was then mixed with PEGylated nanoparticles and reacted at 24 °C
overnight with shaking at 800 RPM to allow the DBCO/azide click reaction to proceed. Following incubation,
250/180 µL PBS was added to the sample of 40-nm/200-nM particles, respectively, which was washed twice and
resuspended in 500/125 µL PBS for-40 nm/200-nM particles, respectively. The final sample was stored at 4 °C.
For post-annealing, the annealing handle was reacted with 200 nm nanoparticles at 24 °C overnight with
shaking at 800 RPM. Nanoparticle were washed twice and resuspended in 180 µL PBS. The DNA aptamer probe
was then added to the dry nanoparticle pellet at a concentration of 125 µM and the same molar ratios as the
annealing handle, and incubated at 95 °C for 5 min and at 24 °C for 10 min while shaking at 800 RPM. Nano-
particles were washed twice, resuspended in 125 µl PBS, and stored at 4 °C.
Preparation of fluorescent probes with alternative off‑the‑shelf labels. Biotinylated aptamer
probes were attached to the following streptavidin conjugates: Streptavidin AlexaFluor 647 Conjugate (Thermo
Fisher Scientific, S32357), Streptavidin APC Conjugate (Thermo Fisher Scientific, S32362), and Streptavidin
SureLight APC (allophycocyanin, Columbia Biosciences, D3-2212). The conjugation reaction was performed in
a buffer containing 10 mM HEPES, 1.2 mM NaCl, 5 mM MgCl2, 5 mM KCl pH 7.4 (HEPES buffer). Streptavidin
conjugates at a 1 uM concentration were combined with biotinylated aptamers at a 1:4 molar ratio and incubated
for 30 min while shaking at 600 RPM in HEPES buffer. Unoccupied biotin binding sites were then blocked by
addition of 100 mM D-biotin (Thermo Fisher Scientific) in dimethyl sulfoxide (Thermo Fisher Scientific) at a
40-molar excess of D-biotin to streptavidin and incubation for 30 min while shaking at 600 RPM.
Fluorescent nanoparticle probe characterization. Dynamic light scattering (DLS) measurements for
nanoparticle hydrodynamic diameter, polydispersity index (PDI), and zeta potential were obtained using a Mal-
vern Zetasizer ZSP Zen5600. All reported measurements were carried out in 2% PBS with a 60-s delay between
measurements. Aliquots of 2–5 µl of sample were added to 700 µl of 2% PBS and loaded into a cuvette (Brand-
Tech Scientific, 759150). Zeta potential was measured in Folded Capillary Cell cuvettes (Malvern, DTS1070).
qPCR was used to measure the number of probes/particle. The total number of probes/particle was assessed
by conducting qPCR once the probes were removed from the particles. Removal was achieved by heating the
sample to 95 °C for 10 min, centrifuging at 31,000 × g for 16 min, and collecting supernatant for assessment.
Next, qPCR was performed on an Applied Biosystems QuantStudio 3 Real-Time PCR Instrument. A 10-point
standard curve with concentrations ranging from 1000 to 0.1 pM of the aptamer probe was made in DNase/
RNase free water; a no-template control was included. A PCR reaction master mix was prepared with 12.5 µl of
2 × PowerUp SYBR Green Master Mix (Applied Biosystems, 100029283), 1.25 µl of 25 µM forward primer, and
1.25 µl of 25 µM reverse primer per sample (see Table 4 for primer sequences). A 15-µl aliquot of the master mix
was combined with 10 µl of sample in a 96-well PCR plate (VWR, 83007-374). The plate was mixed on a Qiagen
TissueLyser II for two 25-s intervals at 13 Hz then centrifuged for 2 min at 1000 × g. The qPCR program was
as follows: (1) 50 °C for 2 min, (2) 95 °C for 2 min, (3) 95 °C for 15 s, (4) 50 °C for 1 min, (5) cycle steps 3 and
4 repeated 40 times. The concentration of DNA/nanoparticle was calculated by comparing the Ct values of the
experimental sample to the standard curve. Two replicates were run per sample.
Binding assessment via plate‑based assay. The HHH peptide (Cys-biotin-PEG2-Gly-His-His-His-
Gly(COOH)) was purchased from Thermo Fisher Scientific. It was 84% pure as determined by mass spectrom-
Scientific Reports | (2021) 11:19921 | https://doi.org/10.1038/s41598-021-99084-4 12
Vol:.(1234567890)www.nature.com/scientificreports/
Target Forward Reverse
B1 5′-AATGATACGGCGACCACCGAGATCTACAC-3′ 5′-CAAGCAGAAGACGGCATACGAGAT-3′
Aptamer 2 5′-AGCGTCTCTCGATCTCATTCTC-3′ 5′-GGGCCATCAAAACAACGCTTG-3′
Table 4. Primers.
etry; the dominant contaminant was the peptide missing the PEG2 spacer. The PNG peptide was synthesized
in-house using an Intavis Multipep RSi synthesizer. Recombinant Her2-his (Sino Biological, 1004H08H) and
VEGF (Sino Biological, 11066-HNAH) were resuspended according to the manufacturer’s protocol, aliquoted,
and stored at − 80 °C. Myoglobin (Sigma-Aldrich, M1882) and E. coli lysate (MCLab, ECCL-100) were prepared
in 15 mM Na2CO3, 35 mM NaHCO3 (referred to as 50 mM carbonate-bicarbonate buffer), pH 9.6 and stored at
4 °C.
Peptide ELONA. Wells of streptavidin-coated 384-well plates (Pierce, 15506) were washed twice with 100
µL of wash buffer (0.1% Tween-20, 10 mM HEPES, 1.2 mM NaCl, 5 mM MgCl2, 5 mM KCl, pH 7.4) then
incubated with 50 µL of 1 µM biotinylated peptide in peptide binding buffer (1% sheared salmon sperm DNA
(Invitrogen, AM9680), 10 mM HEPES, 1.2 mM NaCl, 5 mM M gCl2, 5 mM KCl, pH 7.4) and were shaken at
500 rpm for 30 min. Wells were then washed six times with 100 µL wash buffer and blocked with blocking solu-
tion (100 µL QBlock (Grace Biolabs, 105,106) containing 0.12% Span-80, 0.1% Tween-20, 1% sheared salmon
sperm DNA, and 100 µM D-biotin) while shaking at 500 RPM for 30 min. A 25-µL aliquot of fluorescently
labeled aptamer probe in binding buffer (wash buffer containing 1% sheared salmon sperm DNA and 300 µM
dextran sulfate sodium salt (40 kDa, Sigma-Aldrich, 42867)) was added to each well and allowed to incubate for
60 min while shaking at 500 RPM. Wells were then washed 6–8 times with 100 µL of wash buffer followed by
one wash with 100 µL wash buffer without Tween-20 to remove residual bubbles. Finally, 50 µL of wash buffer
without Tween-20 was added to each well, and the plate was read using a Tecan Infinite 200 microplate spectro-
photometer.
Protein ELONAs: fluorescent nanoparticle probes and Quanta Red HRP substrate. High-
binding, 384-well plates (Corning 3577) were coated with 50 µL of 50 nM protein overnight at 4 °C in 50 mM
carbonate-bicarbonate buffer, pH 9.6. The protein solution was washed out with 100 µL of wash buffer per well
and blocked with 100 µL of blocking solution for 90 min. The plates were washed six times with 100 µL of wash
buffer per well and then 25 µL biotinylated aptamer probes or 25 µL of fluorescent nanoparticle probes were
added in binding buffer and incubated for 1 h. For biotinylated probes, wells were then washed three times with
wash buffer, and 50 µL of binding buffer containing 5 µg/mL Streptavidin Poly-HRP (Thermo Fisher Scientific
21140) was added to each well and incubated for 30 min with shaking at 500 RPM. A solution of QuantaRed
HRP substrate (Thermo Fisher Scientific, 15159) was prepared according to manufacturer’s protocol, and 50 µL
of the substrate was added to each well and incubated for 5 min followed by addition of 5 µL stop solution. For
fluorescent nanoparticles probes, wells were washed six times with wash buffer after the 1 h incubation with
probes. Fluorescence was measured on a Tecan Infinite 200 microplate spectrophotometer.
Determination of EC50 values. After obtaining raw fluorescence intensities from ELONAs, the concen-
tration of nanoparticles used was converted to logarithmic scale. GraphPad Prism was used to perform the
half maximal effective concentration (EC50) analysis. The graphs were analyzed using the “Sigmoidal, 4PL, X
is log(concentration)” option. This fits a four-parameter logistic curve (4PL) and the Hill Slope from the data.
Then, EC50 was obtained from the interpolated “Best-fit values” post analysis.
Comparison to other fluorescent labels. Biotinylated aptamer probes conjugated to alternative off-the-
shelf labels were stored at concentrations of 1 µM in 10 mM HEPES, 1.2 mM NaCl, 5 mM MgCl2, 5 mM KCl,
pH 7.4 at 4 °C. Stability of these alternative fluorescent probes was determined by conducting a peptide ELONA
immediately and 1–3 weeks post-conjugation. Fluorescent nanoparticle B1 probes were stored in 500 µl PBS at
4 °C. Stability of the fluorescent nanoparticle probes was assessed by performing a peptide ELONA immediately
and 8, 12, and 16 weeks post-conjugation using a threefold serial dilution of probe from 100 nM to 7 fM in 100 µl
1X NV buffer using a 384-well black microplate (Corning 3601).
Data availability
The datasets generated during and/or analyzed during the current study are available from the corresponding
author on request.
Received: 25 July 2021; Accepted: 20 September 2021
References
1. Ueno, T. & Nagano, T. Fluorescent probes for sensing and imaging. Nat. Methods 8, 642–645 (2011).
2. Goldshtein, H., Hausmann, M. J. & Douvdevani, A. A rapid direct fluorescent assay for cell-free DNA quantification in biological
fluids. Ann. Clin. Biochem. Int. J. Lab. Med. 46, 488–494 (2009).
Scientific Reports | (2021) 11:19921 | https://doi.org/10.1038/s41598-021-99084-4 13
Vol.:(0123456789)You can also read