Cross-Device Computation Coordination for Mobile Collocated Interactions with Wearables - MDPI
←
→
Page content transcription
If your browser does not render page correctly, please read the page content below
sensors
Article
Cross-Device Computation Coordination for Mobile
Collocated Interactions with Wearables
Hyoseok Yoon *          and Choonsung Shin *
 Korea Electronics Technology Institute, Mapo-gu, Seoul 03924, Korea
 * Correspondence: hyoon@keti.re.kr (H.Y.); cshin@keti.re.kr (C.S.); Tel.: +82-2-6388-6618 (H.Y.)

 Received: 3 January 2019; Accepted: 12 February 2019; Published: 15 February 2019

 Abstract: Mobile devices, wearables and Internet-of-Things are crammed into smaller form factors
 and batteries, yet they encounter demanding applications such as big data analysis, data mining,
 machine learning, augmented reality and virtual reality. To meet such high demands in the
 multi-device ecology, multiple devices should communicate collectively to share computation
 burdens and stay energy-efficient. In this paper, we present a cross-device computation coordination
 method for scenarios of mobile collocated interactions with wearables. We formally define a
 cross-device computation coordination problem and propose a method for solving this problem.
 Lastly, we demonstrate the feasibility of our approach through experiments and exemplar cases using
 12 commercial Android devices with varying computation capabilities.

 Keywords: context-awareness; cross-device; Internet-of-Things; computation offloading; machine
 learning; mobile interaction; wearables

1. Introduction
     Recent rapid developments in low-power microcontrollers, application processors, wireless chips
and sensors are paving the way for consumer-level Internet-of-Things (IoT), mobile devices and
wearables. At this rate, integrations of IoT in small, mobile and wearable form factors with even
smaller batteries will be constantly and ubiquitously emerging. On one hand, IoTs are increasingly
required to be stand-alone, always-on and long-lasting to continuously monitor their surroundings.
On the other hand, IoTs are encountering practical challenges to perform demanding algorithms for
big data analysis, data mining, machine learning, augmented reality (AR) and virtual reality (VR).
In this regard, researchers are actively exploring a means of strategically and efficiently managing
constrained resources of IoT such as its processing power and limited batteries. Through emerging
and enabling technologies in edge computing [1,2], fog computing [3] and cross-device interaction
(XDI) [4,5], various common tasks in homes and work places can be performed in coordination of
multiple devices. To provide such a solution, we need to accurately detect and assess IoTs for their
capabilities as well as their deficiencies. Moreover, we need to employ a logical process to help different
IoTs co-operate. Ideally, we dream of context-aware IoTs that communicate in a way to collectively
share computation burdens and stay energy-efficient.
     In this paper, we present a cross-device computation coordination (XDCC) method for scenarios
of mobile collocated interactions with wearables and IoT. We first introduce relevant concepts and
preliminaries to define what a computation coordination problem is. Then, we propose a method
and its components to support and solve the defined problem systematically. Lastly, we demonstrate
general needs and feasibility of using our proposed method for computation coordination through
several experiments and exemplar cases. For this purpose, we use commercial Android smartphones
and Wear OS smartwatches of varying computation capabilities, to represent advanced mobile and
wearable IoTs. Our contribution in this paper is as follows.

Sensors 2019, 19, 796; doi:10.3390/s19040796                                      www.mdpi.com/journal/sensors
Sensors 2019, 19, 796 2 of 22
1. Definition of the Cross-Device Computation Coordination Problem. We define a cross-device
computation coordination (XDCC) problem considering on-device static and dynamic
characteristics of IoTs, mobile devices and wearables.
2. Design and Implementation of Cross-Device Computation Coordination Method. We design
an XDCC method consists of contextual device profiling, task time measurement and side
information lookup.
3. Benchmark Scores as Usable Context and Side Information. We propose a concept of using
third-party benchmark scores to characterize relative performance of IoT, mobile devices and
wearables, which can be used as side information for our XDCC method.
4. Experiments and Exemplar Cases on 12 Commercial Devices. We demonstrate and evaluate
our proposed XDCC method on eight Android smartphones and four Wear OS smartwatches
through several experiments and exemplar cases.
2. Overview
In this section, we introduce background concepts and preliminaries followed by a formal
definition of a cross-device computation coordination problem.
2.1. Concepts
We first introduce two important concepts that are frequently referenced in this paper.
Concept 1 (Mobile Collocated Interactions). Mobile collocated interactions (MCI) is a concept
to describe various situations of users (or a user) participating in collaborative activities with multiple
devices simultaneously or in turn [6,7]. Often, these multiple devices collocate in the user’s vicinity
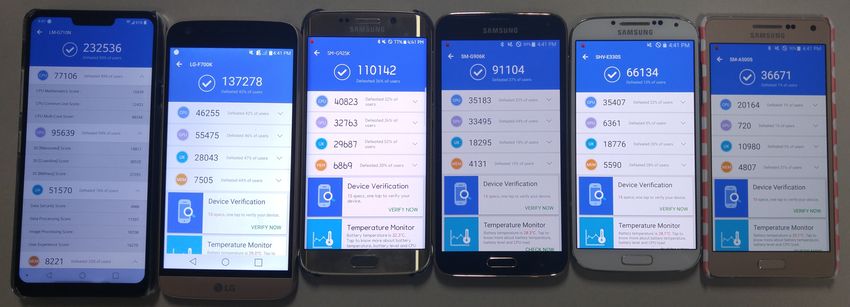
and include a personal mobile device. Figure 1 depicts typical MCI examples we encounter everyday.
Figure 1a–c all demonstrate a common office or home environment where the user has access to
multiple devices including a smartphone, tablet and PC. Figure 1d,e illustrate MCI with wearables
where the user is equipped with a smartwatch. Figure 1f shows MCI with an in-vehicle infotainment
(IVI) to share information between the IVI and the user’s smartphone. A specific type of user interaction
with such multi-devices in MCI is known as cross-device interaction (XDI) [4,5].
(a) Mobile & Tablet, PC (b) Mobile & Tablet, PC (c) Tablet & PC
(d) Mobile & Wearable (e) Mobile & Wearable (f) Mobile & IVI
Figure 1. MCI examples with mobile, tablet, PC, wearables and IVI.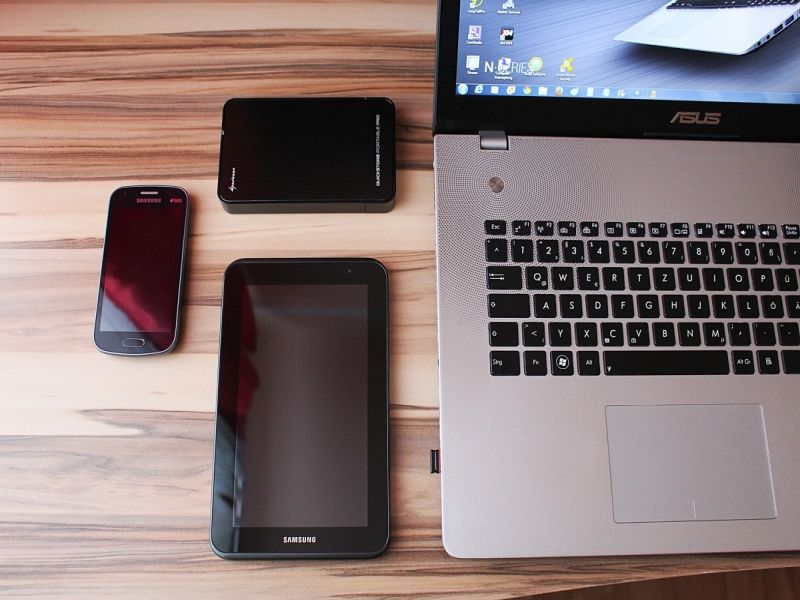
Sensors 2019, 19, 796 3 of 22
For example, real use cases of XDI explored in recent studies include using a wearable device (i.e.,
the Google Glass) with smartphones to offload real-time, computationally heavy and energy-consuming
processes such as text recognition, face detection, marker tracking and gesture recognition [8]. Moreover,
XDI applications contribute to various application domains covering knowledge work, home computing,
data exploration, mobile computing, games/installations, collaboration, education, health and software
development as identified by Brudy et al.’s cross-device taxonomy [5].
Concept 2 (Cross-Device Computation Coordination). We define a concept of cross-device
computation coordination (XDCC) as a means of sharing and integrating information and resources
between the connected devices in MCI so that each device can accomplish their part in support of
a mutual objective of completing a task. Most suitable target tasks for XDCC are tasks that require
real-time, computationally heavy and energy-consuming processes. A typical example includes machine
learning applications (i.e., text recognition, face detection, marker tracking and gesture recognition) and
sensor-based data processing. For example, to display current location on a smartwatch application,
GPS signals received in a smartphone can be shared with a paired smartwatch. To perform XDCC,
we need to specify roles and responsibilities (R & R) of each device as well as a particular interaction
sequence between devices as illustrated in Figure 2.
Device R & R
(1) GPS Sensing Smartphone GPS Sensing
Task
Display
Display Current Location (2) Display Location Smartwatch
Location
Interaction Sequence
Smartphone Smartwatch
Figure 2. A breakdown of an exemplar XDCC.
2.2. Preliminary
We introduce basic definitions that are used throughout this paper.
Definition 1 (Device Resources). A set of n resource items, resources = {r1 , . . . , rn }, represents a
device’s resources where a resource item may be an on-device sensor (i.e., accelerometer, light sensor,
proximity sensor) or a hardware component (i.e., display, speaker).
Definition 2 (Device Profile). A device profile Di for a task consists of available resources of the
device, an optional time spent to perform the task where i is a unique identifier for the device and
side information attributes, Di = (resources, time_s, side_in f o ). Di .resources indicates a set of available
resources on the device. Di .time_s represents on-device completion time for executing the specified task.
Di .side_in f o indicates side information such as the device’s benchmark score.
Definition 3 (Task Description). A task description T is represented with resources and a time
limit attribute as T = (resources, limit). T.resources indicates a set of k resource items required for
completing the task, represented by T.resources = {r1 , . . . , rk }. T.limit indicates the time limit for
completing the task in milliseconds. For example T.limit = 500 indicates that the task should be
completed within 500 ms.
2.3. Problem Definition
With previously defined concepts and preliminaries, we formally define XDCC as a problem of
finding possible XDCC policies.
Definition 4 (Cross-Device Computation Coordination Policy). Given two device profiles
(D1 and D2 ) and a task description T, an XDCC policy XD policy is an implementation of a teamwork
sequence between two paired devices, XD policy = h D1 , D2 i, where D1 specifies a main device
that first performs time-critical computational part of the task followed by a supporting device
D2 performing the rest of the task. More precisely XD policy is valid if D1 satisfies two conditions
Sensors 2019, 19, 796                                                                                    4 of 22

(i.e., contains all the required resources and conforms to the time-limit) of performing the task. Note
that XD policy = h D1 , D2 i and XD policy = h D2 , D1 i are two different XDCC policies.

2.4. Method Overview
     Figure 3 outlines the overview of our proposed method. Our method structure is twofold. First,
multi-devices for XDI such as mobile devices, wearables and IoTs in MCI individually produce their
device profiles. Second, using device profiles and task description, we explore possible solutions for
XDCC policies in either one of the profiled devices or partially on another third-party central server.
In the proposed method, the following three procedures are performed.

•     Step 1—Contextual Device Profiling, which scans multi-devices for available on-device resources
      which include sensors and hardware components. The output of this step is a device profile for
      each device (cf. Section 3.2).
•     Step 2—Task Time Measurement, which performs a task or a simulation of the task to measure the
      time for completing the task on the device. The output of this step is on-device task completion
      time (cf. Section 3.3).
•     Step 3—Side Information Lookup, this optional step integrates external knowledge into the method
      when Step 2 is not viable. This step looks up previously recorded benchmark scores for references
      and outputs a pre-stored or an estimated task completion time (cf. Section 3.4).

                             Mobile Device                Dm
                        Contextual Device Profiling                   Cross-Device
                                                                      Computation
                           Wearable Device
                                                                      Coordination             Valid
                                                           Dw                                 XDCC
                        Contextual Device Profiling
                                                                                              Policies
                                                                     Task Time Measurement

                                 Task                     T         Side Information Lookup
                              Description

                                                      Figure 3. Method overview.

3. Cross-Device Computation Coordination Method
     In this section, we present our rationale for the XDCC problem and describe the three procedures
of our XDCC method in detail.

3.1. A Rationale for XDCC in a Multi-Device Environment
     Mobile devices, wearables and IoTs have different form factors, sizes and user interfaces to serve
various use cases and applications. By using two or more devices simultaneously or in turn, we create
new opportunities that benefit from the extended and combined resources of multi-devices. To do so,
we compare devices to find a device that is both physically capable and computationally more efficient
than its partner. There are two factors we consider for coordinating a computational task T in MCI
between two devices D1 and D2 . We describe our reasoning with simple examples for brevity.

1.    Physical Capability. The first principle is related to the physical capabilities of the devices.
      Consider an MCI case where D1 is physically capable to perform a task T while D2 is not. Then T
      can be performed in only D1 , since D2 is not compatible with T at all. For example, offloading T
      to D1 is a rational decision to make when T requires a speaker and D1 is the only device with
      a speaker.
2.    Computation Efficiency. If T is physically feasible on both D1 and D2 , then we should consider
      our second principle which is related to computation efficiency. If T on D1 takes 10 s and T on D2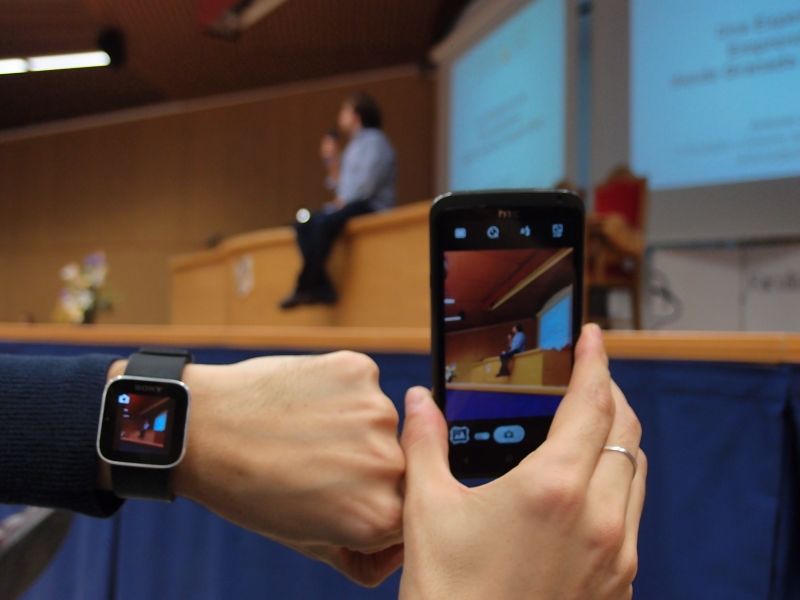
Sensors 2019, 19, 796                                                                                     5 of 22

      takes 100 s, then it is a plausible decision to offload a time-critical task T to D1 to save time. If T
      on D1 is known to consume 5% of battery whereas T on D2 is known to consume 20% of battery,
      then offloading to D1 is a better choice to save scarce resource in the multi-device environment.
      Even though different priorities and strategies can be used, time and battery usages are two
      tightly coupled concerns for MCI with wearables and IoTs.

3.2. Contextual Device Profiling
      The first procedure of the XDCC method is Contextual Device Profiling (CDP) that captures
a snapshot of the devices. Various types of multi-devices in MCI (i.e., mobile devices, wearables
and IoTs) can be described in static and dynamic context of each device. Static context of a device
refers to characteristics of the device that persist in the lifespan of the device. An example is a device
specification that describes hardware components (i.e., processors, screen size, battery capacity, weight)
and presence of embedded sensors of the device (i.e., accelerometer and proximity sensor). Dynamic
context of a device refers to attributes that change through user interactions with the device. Examples
include temperature of the device, current battery level, load of a central processing unit (CPU)
and a number of running applications. Many studies have extracted different contextual usages
from personal mobile devices such as smartphones. Shin et al. derived contextual information from
smartphone sensors and its usages such as GPS, time, battery, app, cellular network, setting, 3D
accelerometer, illumination, screen, call-SMS, Wi-Fi and Bluetooth [9]. In another work, Shin et al.
extracted usage features of smartphones from its general usage, battery usage, data usage, push event
usage, touch inputs, session usage and app usage [10].
      In our work, we take into account both static and dynamic context of cross-devices in MIC. We
retrieve various on-device contextual information to capture a snapshot of the device’s capabilities
and resources. To do so, we pay particular attention to the device’s communication, memory, battery
and sensors. The device’s employed communication technology and its status are significant pieces
of information, because they can result in a preferred transfer method to be used for implementing
XDI. Similarly, current memory usage indicates unmet needs for future data or computation offload.
Furthermore, battery shortages of a device impose physical and usability limitations on users. In this
regard, reducing battery consumption and improving battery life are both academic and engineering
research topics for ubiquitous computing [11] and IoT [12]. To understand a device’s performance,
quantified metrics for a device such as CPU load percentage, numbers of running applications and
processes, are relevant information to collect. However, recent versions of Android prevent access to
/proc/stat for obtaining system and process related information due to security concerns (Android
O prevents access to /proc/stat, https://issuetracker.google.com/issues/37140047). Therefore, such
information is excluded in our suite of on-device sensing for CDP. Table 1 lists different categories of
static and dynamic context for implementing our CDP.

             Table 1. A suite of on-device static and dynamic context sensing for the device profiling.

     Category                     Static Context                           Dynamic Context
     Device Name        Consumer friendly name of a device                         -
     Screen                    Screen size in pixels                               -
     Memory                  Total memory accessible                       Available memory
     Battery Status                      -                     Charging/charged, battery level, temperature
     Charging                            -                             USB charging, AC charging
     Wi-Fi                      Presence/Absence                 Connected/disconnected, signal strength
     Bluetooth                  Presence/Absence                                On/off
     Sensors                    Presence/Absence                             Sensor values

     We developed and implemented a suite of on-device context sensing to obtain static and dynamic
context from the cross-devices. As described in Table 1, we analyze current statuses and usages of the
devices in terms of memory, communication, benchmark scores, sensors and battery.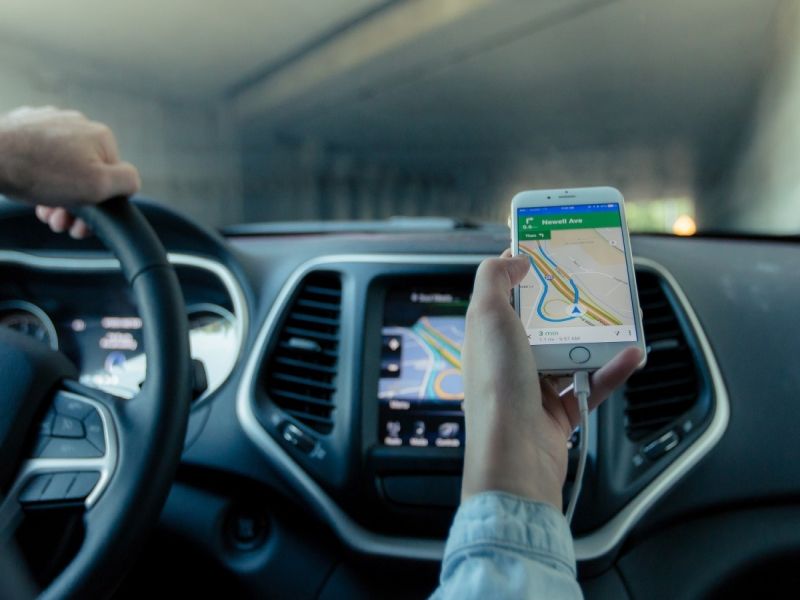
Sensors 2019, 19, 796                                                                              6 of 22

•    Device Name. A device model (Build.MODEL) is used as a consumer friendly name or a unique
     ID for identifying the device.
•    Screen. The screen resolution size in pixels is retrieved, which is important for personalizing or
     retargeting graphical user interfaces.
•    Memory. The available memory on the system, the total memory accessible by the kernel and
     the threshold of available memory are collected by accessing ActivityManager.MemoryInfo (https:
     //developer.android.com/reference/android/app/ActivityManager.MemoryInfo) in Android
     API to determine current memory usage and a low-memory situation.
•    Battery Status. Battery charging status, remaining battery percentage and battery temperature
     information are reported using BatteryManager (https://developer.android.com/reference/
     android/os/BatteryManager).
•    Charging. A source for charging the battery is identified (USB or AC).
•    Wi-Fi. Current Wi-Fi network connection statuses (i.e., connected or not and signal strength if
     connected) are reported using ConnectivityManager (https://developer.android.com/reference/
     android/net/ConnectivityManager) of Android API.
•    Bluetooth. A current Blutooth connection status (i.e., on or off) is reported using BluetoothAdapter
     (https://developer.android.com/reference/android/bluetooth/BluetoothAdapter) of Android API.
•    Sensors. All available sensors on the device are retrieved using SensorManager (https://developer.
     android.com/reference/android/hardware/SensorManager).

3.3. Task Time Measurement
      The second procedure of the XDCC method is Task Time Measurement (TTM) that measures the
time a device takes to perform the task T (i.e., from start to finish). This measurement process can
be actually performed on the device or simulated. Consider a task that classifies a stream of sensor
data into one of pre-defined user gestures. To complete this task, a series of computation is performed.
For example, the stream of sensor data is pre-processed, useful features are extracted and a candidate
gesture that matches with those extracted features is returned as the output of the task. Note that we
are measuring the time to complete the task. So the output of TTM is given in the unit of time which
is different from the output of the task (i.e., a type of user gesture). In practice, devices in MCI have
different hardware specifications (i.e., CPU, GPU and RAM). Consequently, their performance will
vary even with the same task. In our proposed method, it is an engineer’s responsibility to develop
and supply a module that correctly measures the task completion time. We developed Android and
Wear OS-compatible TTM for our work. Algorithm 1 shows a pseudocode for CDP and TTM.
Sensors 2019, 19, 796                                                                              7 of 22

Algorithm 1 An algorithm for computing XDCC policies
Input: A task description T, a mobile device profile Dm , a wearable device profile Dw
Output: A set of capable cross-device policy pairs XD policy
  1: XD policy ← ∅, Dm .time_s ← ∞, Dw .time_s ← ∞ /* initialization */
  2: Dm .resources ← ContextualDeviceProfiling(Dm )
  3: if ( T.resources ∈ Dm .resources ) then /* check for mobile-centric interaction */
  4:      Dm .time_s ← TaskTimeMeasurement(Dm ) /* measure time to complete T on Dm */
  5:      if ( Dm .time_s ≤ T.limit ) then
  6:           Dw .time_s ← 0, XD policy ← ( Dm , Dw ) /* add a new pair */
  7:      end if
  8: end if
  9: if ( T.resources ∈ Dw .resources ) then
 10:      Dw .time_s ← TaskTimeMeasurement(Dw ) /* measure time to complete T on Dw */
 11:      if ( Dw .time_s ≤ T.limit ) then /* check for wearable-centric interaction */
 12:           if Dm .time_s = ∞ then
 13:               Dm .time_s ← 0
 14:           end if
 15:           XD policy ← ( Dw , Dm ) /* add a new pair */
 16:      end if
 17: end if
 18: XD policy ← SortByTaskTime(XD policy ) /* sort pairs by task time of the first device */
 19: return XD policy

3.4. Side Information Lookup
      The third procedure of the XDCC method is Side Information Lookup (SIL) which is an optional
step that integrates external knowledge into our method. SIL is designed to replace repetitive TTM
on devices with similar configuration. For example, performance of two devices with the same
CPU model, the same amount of memory and the same amount of storage are closely comparable,
as witnessed by several benchmark scores. Indeed, an accurate CDP provides useful information.
However, to be used in an application running various computationally intensive tasks, a quantifiable
and comparable metric is required. Therefore, we use two benchmarks (AnTuTu (http://www.antutu.
com/en/index.htm, a commonly used software benchmarking tool for benchmarking smartphones)
and VFP (https://dench.flatlib.jp/app/vfpbench, a benchmarking tool for VFP (Vector Floating Point)
technology, which is the FPU (Floating-Point Unit) coprocessor extension to the ARM architecture)) to
holistically quantify and capture relative “computational level” or “computational readiness” of each
mobile/wearable/IoT devices. We leverage this by measuring device performance on various aspects,
including CPU, GPU, UX, MEM and single, double precision floating point, single and multi-thread.
We envision using a publicly open lookup table that contains device profiles, TTM per tasks and
aforementioned benchmark scores. Using this lookup table, we implement SIL as a lookup function
that outputs TTM. There are three SIL use cases with different inputs. Algorithm 2 shows a pseudocode
for triggering different and hierarchical use cases in SIL.

1.    SIL( DeviceName): An input to SIL is a device name (i.e., consumer friendly name or a unique
      ID). This is a use case of directly retrieving a TTM value previously measured and recorded by
      the same device elsewhere. The output TTM will be most accurate among the use cases.
2.    SIL( DevicePro f ile): An input to SIL is a device profile generated by the CDP. This is a use case
      when the same device information is not available in the lookup table. For example, a similarly
      configured device is located and its TTM is retrieved using the input device profile. Therefore,
      the output TTM is an estimated value.
3.    SIL( BenchmarkScore): An input to SIL is a benchmark score. This is also a use case when the
      same device information is not available in the lookup table. For example, a device of comparable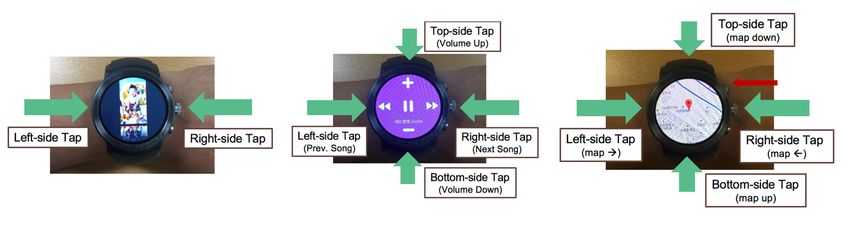
Sensors 2019, 19, 796                                                                                  8 of 22

      performance (i.e., in terms of benchmark score such as 100,000) is located and its TTM is retrieved.
      Consequently, the output TTM is also an estimated value.

Algorithm 2 An algorithm for hierarchical side information lookup
Input: A device profile Di
Output: A TTM value ttm
  1: ttm ← −1 /* initialization */
  2: if (Di exists in the lookup table) then
  3:     ttm ← SIL( Di ) /* Case 1: SIL(DeviceName) - Find TTM of the exact same device */
  4: else
  5:     ttm ← SIL( Di ) /* Case 2: SIL(DeviceProfile) - Find TTM of similarly configured device */
  6:     if (ttm == −1) then
  7:         ttm ← SIL( Di .side_in f o ) /* Case 3: SIL(BenchmarkScore) - Find TTM of similar benchmark */
  8:     end if
  9: end if
 10: return ttm /* return retrieved or estimated TTM */

4. Experiments and Exemplar Cases
    We evaluate our XDCC approach with eight Android smartphones and four smartwatches
ranging from older low-end models to the latest high-end models, by a series of experiments and
exemplar cases. These observations focus on the three procedures of the XDCC method including
CDP (Section 4.1), TTM for on-device machine learning performance (Section 4.2) and exploiting
AnTuTu and VFP benchmark scores in SIL (Section 4.3). Commercial Android-based smartphones and
Wear OS smartwatches from Samsung, LG, Xiaomi, Sony and Motorola are used. For all experiments,
we calculated average measurements while the highest value and the lowest value are both excluded.

4.1. Contextual Device Profiling for Smartphones and Smartwatches
      We developed and implemented a suite of CDP to obtain static and dynamic context
(cf. Section 3.2) of the 12 devices. In our first experiment, we measured the time for our CDP method
on various devices. We analyzed current statuses and usages of the devices in terms of memory,
communication facilities, retrieving benchmark scores, sensors and battery. Figures 4 and 5 show
processing time required for running the suite of CDP on smartphones and smartwatches, respectively.
On most devices, this CDP process took less than 25 ms (on 11 out of 12 devices). Implementation
details for running this experiment using Android and Wear OS are presented.

•     Check Memory. The total memory accessible by the kernel and available memory on the system
      are collected by accessing ActivityManager.MemoryInfo in Android API to determine current
      memory usage percentage and a low memory situation.
•     Check Wi-Fi and Bluetooth. Current Wi-Fi network connection (i.e., connected or not and signal
      strength if connected) and Blutooth connection (i.e., on or off) statuses are reported by using
      ConnectivityManager and BluetoothAdapter of Android API.
•     Check Device Scores. Previously measured AnTuTu and VFP benchmark scores are stored as a
      local database and a device model (Build.MODEL) is used as a key to retrieve associated benchmark
      scores as values.
•     Check Available Sensors. Available sensors on the device are retrieved using SensorManager.
•     Check Battery. Battery charging status, remaining battery percentage and battery temperature
      information are reported using BatteryManager.
Sensors 2019, 19, 796 9 of 22
Samsung S4
Samsung A5
Samsung S5
Samsung S6 edge
LG G4
LG G5
Xiaomi Mi A1
LG G7
0 5 10 15 20 25 30
Milliseconds
Check Memory Check WiFi/BT
Check Device Scores Check Available Sensors
Check Battery
Figure 4. CDP on 8 commercial Android smartphones (lower is better).
Moto 360
Sony SmartWatch3
LG Watch R
LG Watch Sport
0 10 20 30 40 50 60
Milliseconds
Check Memory Check WiFi/BT
Check Device Scores Check Available Sensors
Check Battery
Figure 5. CDP on 4 Wear OS smartwatches (lower is better).
4.2. Task Time Measurement for On-Device Machine Learning Performance
In our second experiment, we chose a relatively computation-intensive machine learning task to
compare task performance on our target devices. Machine learning involves a pipeline of processes
that is challenging for embedded systems such as mobile devices, wearables and IoTs due to the lack of
computational power and resources. Figure 6 shows a typical machine learning flow. We evaluated and
measured task time for completing a sequence of machine learning processes including preprocessing,
feature extraction and model evaluation, on 12 target devices. Implementation details for running this
experiment using Android and Wear OS are presented.
DATA CLASSIFICATION MODEL
COLLECTION PRE-PROCESSING FEATURES ALGORITHMS
• Wearable Sensor • Data Segmentation EXTRACTION • Support Vector Machine
• Machine Operation • Data Labeling • Statistical Features • Naïve Bayes
• Environment Sensor • K-NN PREDICTION
Learning Flow
Prediction Flow
Figure 6. A typical machine learning flow. Highlighted processes are measured in TTM.Sensors 2019, 19, 796 10 of 22
• Preprocessing. We have previously collected 9-axis sensor data from accelerometer, gyroscope,
and linear acceleration and saved them as CSV (Comma Separated Value) files for machine
learning applications. We used this dataset to evaluate preprocessing performance of reading,
parsing and segmenting sensor data for a 1-second sliding window.
• Feature Extraction. As described in the work by [13] and [14], we used similar features to form
two different feature sets for our experiment. First feature set includes a total of 84 features;
7 statistical features (mean, standard deviation, max, min, 3 quantiles) for 3 sensors’ 3 axis (x,
y, z axis) and the magnitude (m) of the combined axes. Second feature set includes 84 features
from the first set and additional 120 features from lower 10 bands produced by a Fast Fourier
Transform (FFT) for 3 sensors’ x, y, z, and m.
• Model Evaluation. As a machine learning model, we used logistic regression classifier in
scikit-learn scikit-learn, https://scikit-learn.org/) to train a model offline and deployed the
trained model to Android and Wear OS devices in a form of PMML (Predictive Model Markup
Language) (PMML, http://dmg.org/pmml/v4-3/GeneralStructure.html) for measuring model
evaluation performance.
Figure 7 shows TTM for preprocessing, feature extraction and model evaluation on Android
smartphones and Wear OS smartwatches. When 84 features were extracted, all smartphones completed
machine learning processes under 500 ms. However, when more demanding FFT features were
included in 204 features, task time increased on all devices as shown in Figure 7.
LG Watch Sport (204F)
LG Watch Sport (84F)
LG Watch R (204F)
LG Watch R (84F)
Sony SmartWatch3 (204F)
Sony SmartWatch3 (84F)
Moto 360 (204F)
Moto 360 (84F)
LG G7 (204F)
LG G7 (84F)
Device Model
Xiaomi Mi A1 (204F)
Xiaomi Mi A1 (84F)
LG G5 (204F)
LG G5 (84F)
LG G4 (204F)
LG G4 (84F)
Samsung S6 edge (204F)
Samsung S6 edge (84F)
Samsung S5 (204F)
Samsung S5 (84F)
Samsung A5 (204F)
Samsung A5 (84F)
Samsung S4 (204F)
Samsung S4 (84F)
0 500 1000 1500 2000 2500 3000 3500 4000 4500 5000
Milliseconds
Preprocessing ExtractFeature Model Evaluation
Figure 7. Processing time for 84 (84F) and 204 features (204F) extraction (lower is better).
4.2.1. Effects of Low Battery
We also examined effects of low battery in TTM to demonstrate that the sensed on-device context
(i.e., battery status) can be used as a performance indicator for the XDCC problem. We used twoSensors 2019, 19, 796 11 of 22
devices that have low scores on AnTuTu and VFP benchmarks, including one smartphone (Samsung S4)
and one smartwatch (Moto 360). The same task (cf. Section 4.2) is used for this experiment as well.
For each device, fully charged (100% denoted as 100B) and low-battery (10–15% denoted as 10B and
15B) conditions were tested for two feature sets (84 features denoted as 84F and 204 features denoted
as 204F). Figures 8 and 9 show total processing time on Samsung S4 and Moto 360 for different battery
conditions, respectively.
1,200
1,000
800
Milliseconds
600
1,008
400 744
200 397
271
0
84F_10B 84F_100B 204F_10B 204F_100B
Figure 8. Effects of low battery on Samsung S4 (lower is better).
Samsung S4. A paired-samples t-test indicated that machine learning process time was
significantly longer for 84F_10B (M = 397, SD = 24.9) than for 84F_100B (M = 271, SD = 8.02), t(7) = 14.6,
pSensors 2019, 19, 796 12 of 22
4.3. AnTuTu and VFP Benchmark Scores as Side Information
As exemplar cases, we explored using AnTuTu and VFP benchmark scores as side information
for SIL (cf. Section 3.4). AnTuTu Benchmark is the most used benchmarking app for Android
devices. When a new Android smartphone is released, often their AnTuTu benchmark scores are
measured and compared to previously released devices to show improvement. We downloaded
AnTuTu benchmark app (AnTuTu Benchmark v7.0.8, https://play.google.com/store/apps/details?
id=com.antutu.ABenchMark) from Google Play to run on Android devices. The benchmarking app
was only used on smartphones, since there was no Wear OS specific version for smartwatches. Table 2
shows AnTuTu benchmark scores for all eight tested smartphones.
Table 2. AnTuTu benchmark scores on the Android smartphones.
Device (Model No.) Year OS Ver. CPU GPU UX MEM Total Score
LG G7 (LM-G710N) 2018 8.0 77,106 95,639 51,570 8221 232,536
Xiaomi Mi A1 (Mi A1) 2017 8.0 39,127 12,700 21,540 5215 78,582
LG G5 (LG-F700K) 2016 6.0 46,255 55,475 28,043 7505 137,278
LG G4 (LG-F500K) 2015 7.0 26,637 23,055 19,161 4016 72,869
Samsung Galaxy S6 edge (SM-G925K) 2015 6.0 40,823 32,763 29,687 6869 110,142
Samsung Galaxy S5 (SM-G906K) 2014 6.0 35,183 33,495 18,295 4131 91,104
Samsung Galaxy A5 (SM-A500S) 2014 6.0 20,164 720 10,980 4807 36,671
Samsung Galaxy S4 (SHV-E330S) 2013 5.0 35,407 6361 18,776 5590 66,134
This app runs various tests to measure and give separate scores on central processing unit (CPU),
graphics processing unit (GPU), user experience (UX) and memory (MEM) aspects as shown in
Figure 10a. As expected, the latest high-end smartphone (i.e., LG G7, which ranks 18th in Table 3)
outperforms other devices in all aspects as shown in Figure 10b. We can leverage a publicly open
lookup table (e.g., Table 3) to find similarly configured devices as well as similarly performing devices.
(a) AnTuTu Benchmark application on smartphones
Samsung S4
Samsung A5
Samsung S5
Samsung S6 edge
LG G4
LG G5
Xiaomi Mi A1
LG G7
50,000 100,000 150,000 200,000 250,000
AnTuTu BenchMark Score
CPU GPU UX MEM
(b) Comparisons of AnTuTu scores (higher is better)
Figure 10. AnTuTu benchmark scores on Android smartphones.Sensors 2019, 19, 796 13 of 22
Table 3. Top 50 AnTuTu benchmark scores on popular Android smartphones (as of November 2018),
retrieved from http://www.antutu.com/en/ranking/rank6.htm.
Device Ranking RAM+Storage CPU GPU 3D Total Score
1. OnePlus 6T 8GB+128GB 92,504 64,447 127,682 295,181
2. Mi MIX 2S 6GB+64GB 89,139 61,097 127,509 287,111
3. OnePlus 6 8GB+256GB 91,547 63,968 127,359 293,745
4. Mi Black Shark 8GB+128GB 91,747 61,101 126,599 291,099
5. ROG Phone 8GB+512GB 94,170 63,449 126,517 297,019
6. Mi 8 6GB+256GB 91,168 59,745 125,970 287,142
7. vivo NEX S 8GB+128GB 92,080 57,043 125,929 286,433
8. Samsung Note9 (SDM845) 6GB+128GB 89,058 59,787 125,893 283,004
9. Mi POCOPHONE F1 6GB+128GB 89,082 59,735 125,786 283,861
10. Meizu 16th 8GB+128GB 92,110 60,562 123,425 286,943
11. Sony Xperia XZ2 4GB+64GB 84,402 61,151 120,998 275,832
12. HUAWEI Mate 20 Pro 6GB+128GB 112,070 68,221 110,574 305,437
13. HUAWEI Mate 20 6GB+128GB 111,964 68,069 110,195 304,306
14. HUAWEI Mate 20 X 6GB+128GB 111,156 67,550 109,787 301,661
15. Samsung S9+ (SDM845) 6GB+64GB 89,216 58,474 108,415 264,543
16. ZenFone 5Z 8GB+256GB 90,665 59,079 106,785 268,858
17. Samsung S9 (SDM845) 4GB+64GB 89,271 58,485 106,389 262,421
18. LG G7 ThinQ 4GB+64GB 87,647 57,084 104,412 257,715
19. Samsung Note9 (9810) 6GB+128GB 85,108 53,597 96,578 243,362
20. Samsung S9+ (9810) 6GB+64GB 89,626 55,646 94,284 247,968
21. Samsung S9 (9810) 4GB+64GB 89,406 55,602 92,800 246,188
22. Google Pixel 2 XL 4GB+128GB 71,089 43,540 90,138 213,603
23. Moto Z2 Force 6GB+64GB 72,094 44,244 83,147 207,589
24. Samsung Note8 (SDM835) 6GB+64GB 68,902 44,700 82,269 203,128
25. Nokia 8 4GB+64GB 72,197 45,851 81,928 208,422
26. HONOR V10 6GB+128GB 69,932 44,528 80,697 208,670
27. HUAWEI Mate 10 Pro 6GB+128GB 71,013 44,408 80,037 209,042
28. Samsung Note 8 (8895) 6GB+64GB 69,323 44,001 79,582 200,533
29. HUAWEI P20 Pro 6GB+128GB 71,799 46,324 78,184 209,863
30. HONOR 10 6GB+128GB 68,930 46,318 78,041 206,674
31. HUAWEI P20 4GB+128GB 71,706 45,804 77,832 208,795
32. Samsung S8 (SDM835) 4GB+64GB 68,472 43,989 77,791 197,129
33. LG V30 4GB+128GB 57,810 33,100 77,698 175,130
34. HONOR Play 4GB+64GB 70,923 45,702 77,379 207,310
35. Samsung S8 (8895) 4GB+64GB 67,549 43,731 77,173 195,700
36. Samsung S8+ (SDM835) 4GB+64GB 68,594 43,853 77,015 197,071
37. Samsung S8+ (8895) 4GB+64GB 62,296 43,192 76,839 189,122
38. HUAWEI nove 3 4GB+128GB 70,499 45,594 76,712 206,140
39. Essential Phone 4GB+128GB 70,083 44,482 73,577 197,362
40. LG G5 4GB+32GB 46,147 35,129 63,673 150,769
41. LG G6 4GB+32GB 51,643 36,278 60,847 153,761
42. Mi 8 SE 4GB+64GB 66,640 44,511 47,843 168,135
43. Mi 8 Lite 4GB+64GB 66,866 38,965 30,409 143,922
44. Nokia 7 Plus 4GB+64GB 64,629 38,908 30,355 140,502
45. Mi 6X 6GB+64GB 62,818 37,222 30,153 138,238
46. vivo V9 6GB+64GB 62,404 38,079 30,139 138,050
47. OPPO F7 Youth 4GB+64GB 62,427 36,331 29,668 137,936
48. HONOR 8X 4GB+64GB 66,921 37,717 22,571 139,794
49. HUAWEI Mate 20 Lite 4GB+64GB 66,201 37,619 22,566 138,890
50. HUAWEI nova 3i 4GB+64GB 66,116 37,614 22,489 138,671
VFP Benchmark (https://dench.flatlib.jp/app/vfpbench) is another application to benchmark
performance of floating point (FP) instruction set in GFLOPS (giga floating point operations per
second) on Android and Wear OS. Specifically, this application tests single precision floating point,
double precision floating point, single-thread and multi-thread. FP operations on embedded systems
and IoTs are complex to perform than that of integers. Therefore, the measured GFLOPS of devicesSensors 2019, 19, 796 14 of 22
are suitable metrics to indicate their readiness for complex (i.e., FP) operation in terms of both
processing time and precision. To obtain GFLOPS of target devices, we downloaded, installed, and ran
Android (VFP Benchmark v1.3.4, https://play.google.com/store/apps/details?id=jp.flatlib.flatlib3.
vfpbench) and Wear OS (VFP Benchmark for Android Wear v1.0, https://play.google.com/store/
apps/details?id=jp.flatlib.flatlib3.vfpbenchw) versions of VFP Benchmark on 8 smartphones and 4
smartwatches, respectively.
The results are summarized in Figure 11 and Table 4. As expected, FP operations on smartphones
are 8 to 51 times faster than that of smartwatches. By using these side information (i.e., AnTuTu and
VFP benchmarks) to build a lookup table and corresponding lookup functions in our XDCC method,
we can directly retrieve benchmark scores, find devices with similar performance, find devices with
comparable configuration and estimate performance of a new device without actually measuring
task time.
150
100
GFLOPS
50
0
LG G7 Xiaomi Mi LG G5 LG G4 Samsung Samsung Samsung Samsung
A1 S6 edge S5 A5 S4
Single Precision FP / Single-thread Double Precision FP / Single-thread
Single Precision FP / Multi-thread Double Precision FP / Multi-thread
(a) GFLOPS for the Android smartphones
4
3
GFLOPS
2
1
0
LG Watch Sport LG Watch R Sony SmartWatch3 Moto 360
Single Precision FP / Single-thread Double Precision FP / Single-thread
Single Precision FP / Multi-thread Double Precision FP / Multi-thread
(b) GFLOPS for the Wear OS smartwatches
Figure 11. VFP benchmark results of Android devices (higher is better).Sensors 2019, 19, 796 15 of 22
Table 4. VFP benchmark results of floating point (FP) instruction sets on the Android and Wear OS
devices (SP: Single Precision, DP: Double Precision, S-Thread: Single-thread, M-Thread: Multi-thread).
Device SP S-Thread DP S-Thread SP M-Thread DP M-Thread ARCH CPU Core
LG G7 22.237 11.122 145.945 71.15 ARMv8A 8
Xiaomi Mi A1 15.774 7.883 124.874 62.88 ARMv8A 8
LG G5 17.131 8.484 58.55 28.339 ARMv8A 4
LG G4 14.522 6.739 60.698 31.537 ARMv8A 6
Samsung S6 edge 16.721 8.382 111.476 53.152 ARMv8A 8
Samsung S5 14.634 3.27 41.851 13.215 ARMv7A 4
Samsung A5 9.32 2.512 36.326 9.68 ARMv7A 4
Samsung S4 13.454 3.238 52.716 12.306 ARMv7A 4
LG Watch Sport 1.508 0.755 3.796 1.398 ARMv7A 4
LG Watch R 1.476 0.739 1.545 0.757 ARMv7A 4
Sony SmartWatch3 2.061 0.862 2.216 1.097 ARMv7A 4
Moto 360 2.955 0.105 3.016 0.117 ARMv7A 1
4.4. Implemented Applications
To demonstrate feasibility of our approach, we present two applications (i.e., gesture
recognition [14] and smart factory data collection [15]) on mobile collocated interactions with wearables
from our earlier work.
First gesture-recognition application uses the machine learning pipeline (cf. Section 4.2) to
implement motion UI that recognizes the smartwatch wearer’s gestures for controlling gallery app,
music player app and map app on the smartwatch [14]. As illustrated in our experiments and Figure 7,
we implemented the motion UI with LG Watch Sport with 84 features. Figure 12 shows the motion
UI application and its interfaces on a smartwatch for MCI. The machine learning pipeline denoted
as MLFunctions is entirely run on the smartwatch and the recognized gesture is shared with the
smartphone. Figure 13 shows the three implemented applications operated by the motion UI.
Smartwatch Mobile Device
Invoke
Main Activity
SendBroadcast(Intent)
Intent Service
BroadcastReceiver Main Activity
onReceive()
BroadcastReceiver
onReceive()
SensorEventListener
onSensorChanged()
TargetUI(gesture)
startMeasurement()
WearableListenerService
★ MLFunctions
getRecognizedResult() Invoke onMessageReceived()
SendBroadcast(Intent)
GoogleApiClient
Wearable.MessageApi.
sendMessage()
★InvokeUI(gesture)
Figure 12. The motion UI application for MCI.Sensors 2019, 19, 796 16 of 22
Figure 13. Motion UI-based gallery app, music player app and map app running on a smartwatch.
Second smart factory data collection application is implemented on less-powerful LG Watch R.
As illustrated in our experiments, LG Watch R is not powerful enough to carry out heavy computation
by itself. Therefore, the smartwatch is used to trigger starting and ending points of a task only
while the collected data is stored on the smartwatch. The collected data is then transferred to a
machine-environment local server at a later time.
Both applications show how different combinations of possible XDCC policies can be integrated
at an application level. Different options on available devices (powerful vs. less-powerful wearables)
and application demands (real-time gesture UI vs. data collection) should be carefully reviewed and
reflected on implementing final applications.
5. Discussion
In this section, we discuss several implications and lessons learned for the XDCC problem based
on our experiments results and exemplar cases.
First, a suite of contextual device profiling should be periodically or often checked before making
computation coordination or offloading decisions. Since CDP running times for both smartphones
(up to 25 ms) and smartwatches (up to 55 ms) are comparably modest, the accumulated time cost of
checking would not be critical in most cases. At this stage, the device profile obtained from CDP should
be used to eliminate mobile devices, wearables and IoTs that are physically incapable of executing
XDCC processes further. To fully exploit device profiles, we can enrich these profiles with more
complex details of the devices and make them publicly accessible for a certain group of tasks.
Second, as shown in the effects of low battery on machine learning processes (cf. Section 4.2.1),
a device’s current battery status is important context to keep track of. The limitation of our experiment
is that we only tested with smartphones and smartwatches. Since they have more flexibilities in terms
of battery capacity than IoTs, performance degradation on IoTs with smaller battery capacities need to
be further investigated. Nevertheless, battery usages of devices in MCI should be well managed in the
XDCC method, so that the collaborative performance of the devices is significantly increased.
Third, previously measured benchmarking scores can be used to estimate performances of other
mobile device, wearables and IoTs within similar ranges. For example, Samsung S4 and Samsung S5
have VFP scores within similar ranges, and their performance on machine learning processes also fall
into the similar ranges (204 features, S4: 743 ms, S5: 713 ms and 84 features S4: 270 ms, S5: 291 ms).
Similarly, we can infer that Samsung Note9 and Samsung S9 have comparable performance with LG
G7, since they have similar AnTuTu scores shown in Table 3. So, if we only have AnTuTu or VFP scores,
we can use benchmark scores as side information for backtracking and estimating performance on
tasks of interest.
Lastly, if we want to deploy machine learning applications or any other computationally intensive
task on mobile or wearable IoTs, features number and user-interaction time are important. Consider
that our interactive application is required to process 2–3 inputs from users within a second. Based on
our experiment results, using 204 features on any of the four smartwatches we tested, are not viableSensors 2019, 19, 796 17 of 22
since their processing time are greater than 500 ms. Then we are forced to use only 84 features on LG
Watch Sport or coordinate computation to smartphones.
6. Related Work
The proliferation of IoT has brought considerable changes in computing paradigms such as edge
computing and fog computing. At the same time, poor computational capability and limited power
capacity of current mobile and wearable IoTs pose problems on runtime performance degradation.
Samie et al. identified four categories of IoT provided services and applications as one-to-one,
one-to-many, many-to-one and many-to-many where IoT systems may exploit single/multiple devices
to implement single/multiple applications [16]. For end-users to efficiently and effectively interact with
the complicated IoT ecosystem, modern concepts such as cross-device interaction and offloading are
becoming more relevant. In this section, we review related work on edge computing, fog computing,
cross-device interaction and offloading, respectively. For more comprehensive and complete surveys,
we direct readers to topical surveys for IoT technologies for embedded computing [16], mobile edge
computing [17], fog computing [18,19], mobile multi-device ecosystems [5,7] and offloading [20,21].
6.1. Edge Computing
There is a branch of work focusing on roles and responsibilities of each individual device (i.e.,
mobile devices, wearables and IoTs). Lopez et al. proposed a vision of human-centered edge-device
based computing where an edge may be a mobile device or a wearable device [22]. In their vision of
“edge-centric computing”, edge devices of the network are proximate to end-users while having more
control with support for mobile uses [22]. Shi and Dustdar argued that edge computing which refers
to “the enabling technologies that allow computation to be performed at the network edge so that
computing happens near data sources”, promotes many new IoT applications [23]. In edge computing,
an edge can be “any computing and network resources along the path between data sources and cloud
data centers [24]“. Shi et al. identified that edge computing has advantages in improving the total
response time and energy consumption of devices by computing at the proximity of data sources [24].
Sun and Ansari proposed an IoT architecture edgeIoT [25] based on fog computing and software
defined networking (SDN), to collect, classify and analyze the IoT data streams while minimzing the
end-to-end delay between nodes. Satyanarayanan also discussed advantages of edge computing (i.e.,
the proximity of cloudlets) in four asepcts; these advantages included highly responsive cloud services,
scalability via edge analytics, privacy-policy enforcement and masking cloud outages [26]. Mao et al.
presented a survey on mobile edge computing (MEC) as a paradigm for distributing edges in order
to provide “sufficient capacities for performing computation-intensive and latency-critical tasks at
mobile devices [17]”. In their survey, MEC research themes across its components are categorized
into computation task models, communication models, computation models of mobile devices and
computation models of MEC servers, respectively [17]. Gu et al. proposed and formulated a task
assignment problem between mobile edges as a one-to-many matching game, with the objective of
minimizing the energy consumption [2].
Aligning our method within the theme of edge computing, our XDCC method aims to increase
the overall performance of targets edge devices (i.e., mobile devices, wearables and IoTs) by executing
XDCC tasks at the appropriate edge with physical capability and computation efficiency. Specifically,
we investigated a particular MCI case where a user’s smartphone and smartwatch served the roles
of edges.
6.2. Fog Computing
There is another branch of work that emphasize more on a distributed yet well-connected
computing infrastructure. Dastjerdi and Buyya characterized fog computing as “a distributed
paradigm that provides cloud-like services to the network edge” whose architecture consists of sensors
and actuators employing “the sense-process-actuate and stream-processing programming models” [27].Sensors 2019, 19, 796 18 of 22
Mukherjee et al. presented a survey to report on various architectures for fog computing and addressed
open challenges of fog computing; some of the open research issues were application offloading,
resource management and optimizing the reconfiguration cost in the SDN-based fog computing [18].
Sarkar et al. proposed a mathematical model to assess fog computing, in terms of power consumption,
service latency, carbon dioxide emission and cost for high number of latency-sensitive applications [28].
Lavassani et al. proposed and demonstrated a model to save energy and reduce the number of packet
transmissions in their fog computing testbed with IoT [3]. Bellavista et al. presented a conceptual
architecture for Cloud-Fog-IoT applications that contains six different perspectives (1. communication,
2. security, 3. data quality, 4. sensing and actuaction management, 5. cloudification and 6. analytics
and decision-making) [19].
In contrast to many studies that explore infrastructure-level issues in fog computing, our work
focus on a task-level model and examines selected devices for achieving a mutual task effectively.
6.3. Cross-Device Interaction
XDI involves and poses many design, technological, social and perceptual challenges in mobile
multi-device ecosystems [7,29]. Scharf et al. defined XDI as “the type of interaction, where human
users interact with multiple separate input and output devices, where input devices will be used
to manipulate content on output devices within a perceived interaction space with immediate
and explicit feedback” [4]. In their work, four features (1. direct interaction with input devices,
2. mediated interaction, 3. perception of output devices, 4. immediate and explicit feedback)
are used to systematically describe XDI [4]. Houben et al. used the term XDI more casually yet
emphasized achieving a mutual task, “the seamless use of multiple devices to work toward achieving
the same goal” [29]. Oh et al. proposed M+ as a platform-level solution to utilize application and
system functionalities across Android devices [30]. Guo et al. built FoggyCache that demonstrates
cross-device approximate computation reuse to minimize redundant computation in multi-devce
mobile and edge scenarios [31]. Guo and Hu presented Potluck to achieve approximate deduplication
in computation-intensive mobile applications [32].
Recently, there are several interactive scenarios for XDI in HCI research communities.
Roels et al. presented INFEX that demonstrates a general framework for sharing information and
UI on an interactive tabletop surface [33]. Serpi et al. proposed Web5VR as a framework for
re-implementing manipulation techniques for different VR devices such as Kinect and Leap Motion [34].
For visualization on multi-devices, Langner et al. proposed VisTiles as a conceptual framework
for visual data exploration specifically targeting co-located mobile devices [35]. For optimizing
user interfaces in XDI, Park et al. proposed AdaM to optimize the allocation of UI elements in UI
distribution [36].
In our work, we presented experiments and exemplar cases in MCI with wearables, which is a
specific case of XDI. While XDI methods and applications presented in this section share the same
motivation (i.e., achieving the same goal), our work focuses on a task-level XDCC with contextual
device profiling and exploiting benchmark scores as usable side information.
6.4. Offloading
Computation or data offloading is a type of resource management actively pursued in edge
computing, fog computing and XDI. Shi et al. proposed several guidelines of computational offloading
for computationally demanding AR applications on wearable devices based on their experiences with
AR applications on Google Glass [37]. Xu et al. identified several open challenges in algorithm design,
incentive mechanism, user behavior utilization, security and privacy, computation-traffic offloading for
realizing opportunistic offloading [20]. Hou and Xie proposed incentive mechanisms for mobile data
offloading by considering social relationship of mobile users [38]. Ma et al. proposed the Computation
Offloading Decision algorithm for IoT sensors where the offloading decision problem is formulated
as a computation offloading game [1]. Ometov et al. proposed a mathematical model that delegatesSensors 2019, 19, 796 19 of 22
computing and caching functionality to resource-rich devices in the vicinity for AR applications
scenarios [39]. Samie et al. proposed a computation offloading technique under bandwidth constraints
to improve battery life of edge devices [40]. Chandra et al. summarized several approaches on
offloading [21] to improve the battery life of mobile devices such as Somniloquy [41], WearDrive [42]
and Mobile Assistance Using Infrastructure [43].
Compared to the related work, our XDCC method focuses on, (1) profiling cross-devices in
MCI with wearables (i.e., smartphone + smartwatch) with benchmark scores as side information and
(2) making an informed decision of offloading complex algorithms such as feature extraction in a
typical machine learning application.
7. Conclusions
In this paper, we explored the concept of cross-device computation coordination in MCI and
presented the XDCC method for performing XDCC concerning mobile devices, wearables and IoTs. A
series of experiments and exemplar cases demonstrated that the XDCC method consists of CDP, TTM
and SIL procedures provide insights for making computation offloading and XDCC decisions. Overall,
the CDP procedure provided in the XDCC method is a light and fast module to be deployed onto both
mobile and wearable IoTs for continuous monitoring the devices. Also exploiting side information
such as AnTuTu and VFP benchmark scores as usable context, is practical and promising when some
of the on-device context is missing or unavailable. As discussed in our exemplar cases, we can design
and implement hierarchical SIL functions and lookup tables to retrieve or estimate a TTM value from
similarly configured devices or similarly performing devices.
Our current approach is limited to computational tasks that involve floating point operations
and machine learning tasks. Further studies are required for tasks that heavily use GPU (i.e., games
and VR/AR applications) and network transfer (i.e., streaming applications). Moreover, since our
work is not deployed to the real world setting to assess workload migration for specific tasks, this
topic deserves further studies along with practical deployment and cross-device compatibility issues.
Nevertheless, we expect that our proposed XDCC method to provide a means of harmoniously
cooperating among mobile devices, wearables and IoTs while answering high application demands
and conforming to IoT’s scalability, ubiquity and context-awareness requirements.
Author Contributions: Conceptualization, H.Y.; Methodology, H.Y. and C.S.; Software, H.Y. and C.S.; Validation,
H.Y. and C.S.; Formal Analysis, H.Y. and C.S.; Investigation, H.Y.; Resources, H.Y.; Data Curation, H.Y.;
Writing—Original Draft Preparation, H.Y.; Writing—Review and Editing, H.Y. and C.S.; Visualization, H.Y.;
Supervision, H.Y.; funding acquisition, H.Y.
Funding: This work was supported by the Basic Science Research Program through the National Research
Foundation of Korea (NRF) funded by the Ministry of Education (NRF-2018R1D1A1B07043983).
Acknowledgments: Figure 1a, Figure 1c, Figure 1e and Figure 1f are CC0 Public Domain, respectively. Figure 1b
is “SimplePix - Responsive WordPress Blog Magazine Theme #1” by Serge Kij licensed under CC BY 2.0. Figure
1d is “Otros wearable devices” by Esteban Romero licensed under CC BY 2.0.
Conflicts of Interest: The authors declare no conflict of interest.
Abbreviations
The following abbreviations are used in this manuscript:
AR Augmented Reality
CDP Contextual Device Profiling
CSV Comma Separate Value
DP Double Precision
FFT Fast Fourier Transform
GFLOPS Giga FLoating point OPerations per Second
GPU Graphical Processing Unit
HCI Human-Computer Interaction
IoT Internet-of-ThingsSensors 2019, 19, 796 20 of 22
MCI Mobile Collocated Interactions
MEM Memory
PMML Predictive Model Markup Language
SDN Software Defined Network
SIL Side Information Lookup
SP Single Precision
TTM Task Time Measurement
UI User Interface
UX User Experience
VR Virtual Reality
XDCC Cross-Device Computation Coordination
XDI Cross-Device Interaction
References
1. Ma, X.; Lin, C.; Zhang, H.; Liu, J. Energy-Aware Computation Offloading of IoT Sensors in Cloudlet-Based
Mobile Edge Computing. Sensors 2018, 18, 1945.
2. Gu, B.; Chen, Y.; Liao, H.; Zhou, Z.; Zhang, D. A Distributed and Context-Aware Task Assignment Mechanism
for Collaborative Mobile Edge Computing. Sensors 2018, 18, 2423.
3. Lavassani, M.; Forsström, S.; Jennehag, U.; Zhang, T. Combining Fog Computing with Sensor Mote Machine
Learning for Industrial IoT. Sensors 2018, 18, 1532.
4. Scharf, F.; Wolters, C.; Herczeg, M.; Cassens, J. Cross-Device Interaction: Definition, Taxonomy and Application.
In Proceedings of th 3rd International Conference on Ambient Computing, Applications, Services and
Technologies, Porto, Portugal, 29 September–3 October 2013; pp. 35–41.
5. Brudy, F.; Holz, C.; Rädle, R.; Wu, C.J.; Houben, S.; Klokmose, C.; Marquardt, N. Cross-Device Taxonomy:
Survey, Opportunities and Challenges of Interactions Spanning Across Multiple Devices. In Proceedings of
the 2019 CHI Conference on Human Factors in Computing Systems, Glasgow, UK, 4–9 May 2019.
6. Lucero, A.; Clawson, J.; Fischer, J.; Robinson, S. Mobile collocated interactions with wearables: Past, present,
and future. mUX J. Mob. User Exp. 2016, 5, 6.
7. Grubert, J.; Kranz, M.; Quigley, A. Challenges in mobile multi-device ecosystems. mUX J. Mob. User Exp.
2016, 5, 5.
8. Golkarifard, M.; Yang, J.; Huang, Z.; Movaghar, A.; Hui, P. Dandelion: A Unified Code Offloading System
for Wearable Computing. IEEE Trans. Mob. Comput. 2019, 18, 546–559. .
9. Shin, C.; Hong, J.H.; Dey, A.K. Understanding and Prediction of Mobile Application Usage for Smart Phones.
In Proceedings of the 2012 ACM Conference on Ubiquitous Computing, Pittsburgh, PA, USA, 5–8 September
2012; ACM: New York, NY, USA, 2012; UbiComp’12, pp. 173–182.
10. Shin, C.; Dey, A.K. Automatically Detecting Problematic Use of Smartphones. In Proceedings of the 2013
ACM International Joint Conference on Pervasive and Ubiquitous Computing, Zurich, Switzerland, 8–12
September 2013; ACM: New York, NY, USA, 2013; UbiComp ’13, pp. 335–344.
11. Ferreira, D.; Dey, A.K.; Kostakos, V. Understanding Human-Smartphone Concerns: A Study of Battery Life.
In Pervasive Computing; Lyons, K., Hightower, J., Huang, E.M., Eds.; Springer: Berlin/Heidelberg, Germany,
2011; pp. 19–33.
12. Jayakumar, H.; Lee, K.; Lee, W.S.; Raha, A.; Kim, Y.; Raghunathan, V. Powering the Internet-of-Things.
In Proceedings of the 2014 International Symposium on Low Power Electronics and Design, La Jolla, CA,
USA, 11–13 August 2014; ACM: New York, NY, USA, 2014; ISLPED ’14, pp. 375–380.
13. Wen, H.; Ramos Rojas, J.; Dey, A.K. Serendipity: Finger Gesture Recognition Using an Off-the-Shelf
Smartwatch. In Proceedings of the 2016 CHI Conference on Human Factors in Computing Systems, San Jose,
CA, USA, 7–12 May 2016; ACM: New York, NY, USA, 2016; CHI ’16, pp. 3847–3851.
14. Lee, K.T.; Yoon, H.; Lee, Y.S. Implementation of smartwatch user interface using machine learning based
motion recognition. In Proceedings of the 2018 International Conference on Information Networking
(ICOIN), Chiang Mai, Thailand, 10–12 January 2018; pp. 807–809.
15. Yoon, H.; Lee, Y.S.; Lee, K.T. Human-Machine-Environment Data Preparation Using Cooperative Manufacturing
Process Triggers. In Proceedings of the 2018 International Conference on Information Technology, Engineering,
Science & Its Applications, Yogyakarta, Indonesia, 1–2 August 2018.You can also read