MT Manager User Manual - Xsens
←
→
Page content transcription
If your browser does not render page correctly, please read the page content below
Document MT0605P, Revision 2020.A, June 2020

MT Manager User Manual
                              For all MT devices
    1                          www.xsens.com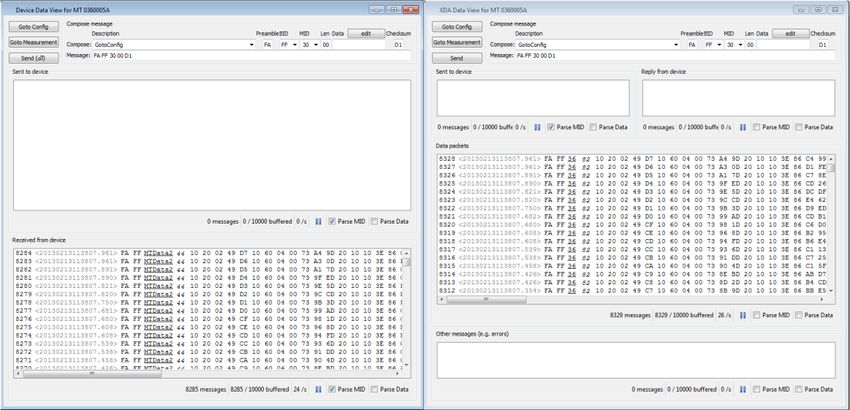
Revision       Date                   By             Changes
 A              1 Apr 2008             MMI            Initial release

 R1             14 Dec 2017            MHA            Added mention about Config Mode after
                                                      closing MT Manager
 2018.A         25 June 2018           SGI            Added information about MTi-7
 2019.A         11 Jan 2019            SGI            Updated for release of MTSS v2019.0,
                                                      added NMEA output message parser
 2019.B         Nov 2019               AKO            Xsens Brand Update
 2020.A         June 2020              SGI            Added Free Acceleration view
                                                      Included CAN output configuration window
                                                      Included NTRIP Client window
                                       PRI            Added GNSS Lever arm support

© 2005-2020, Xsens Technologies B.V. All rights reserved. Information in this document is subject to change
without notice. Xsens, Xsens DOT, MVN, MotionGrid, MTi, MTi-G, MTx, MTw, Awinda and KiC are registered
trademarks or trademarks of Xsens Technologies B.V. and/or its parent, subsidiaries and/or affiliates in The
Netherlands, the USA and/or other countries. All other trademarks are the property of their respective owners.

                                                      2                                 www.xsens.com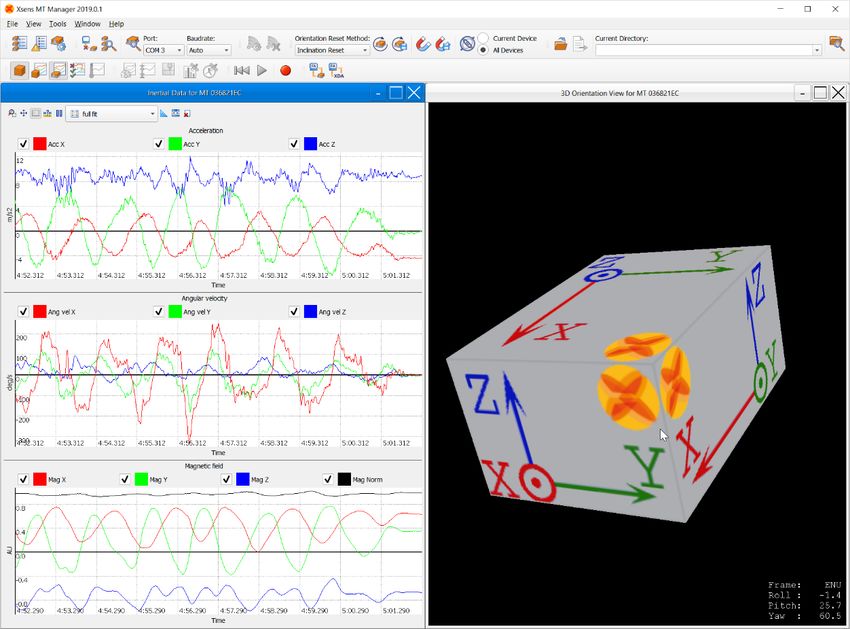
Table of Contents

1 References ................................................................................ 8

2 Xsens Help Center and User Community ................................... 9

3 Introduction ............................................................................ 10

4 Quick start .............................................................................. 11
  4.1    Installing the MT Manager ..........................................................................11
  4.2 Connecting your device to MT Manager ........................................................12
    4.2.1 Automatic COM port selection ................................................................12
    4.2.2 Manual COM port selection ....................................................................13
  4.3 Basic functionality of MT Manager ................................................................14
    4.3.1 Configuring Motion Tracker ...................................................................14
    4.3.2 Recording data ....................................................................................16
    4.3.3 Opening the file and playback data ........................................................17
    4.3.4 Exporting a file to ASCII .......................................................................18

5 Overview MT Manager ............................................................. 20
  5.1    Purpose ....................................................................................................20
  5.2    MT Manager features .................................................................................20
  5.3    Supported devices .....................................................................................20
  5.4    Input Options............................................................................................20
  5.5    Output Files ..............................................................................................21
  5.6    Menu bar ..................................................................................................22
  5.7 Data views, toolbars and buttons ................................................................24
    5.7.1 The Device List ....................................................................................24
    5.7.2 Device Settings ...................................................................................25
    5.7.3 Data Views..........................................................................................26
    5.7.4 Connectivity ........................................................................................41
    5.7.5 File control ..........................................................................................41
    5.7.6 Playback & recording ............................................................................41
    5.7.7 Orientation resets ................................................................................42
    5.7.8 In-run Compass Calibration & Representative Motion ...............................43
    5.7.9 Manual Gyro Bias Estimation .................................................................43

6 Operating guidelines ............................................................... 45
  6.1    Overview ..................................................................................................45
  6.2 Configuring the MT Manager and your devices ..............................................45
    6.2.1 General settings ..................................................................................45
    6.2.2 Using the Device Settings window ..........................................................45

                                                          3                                    www.xsens.com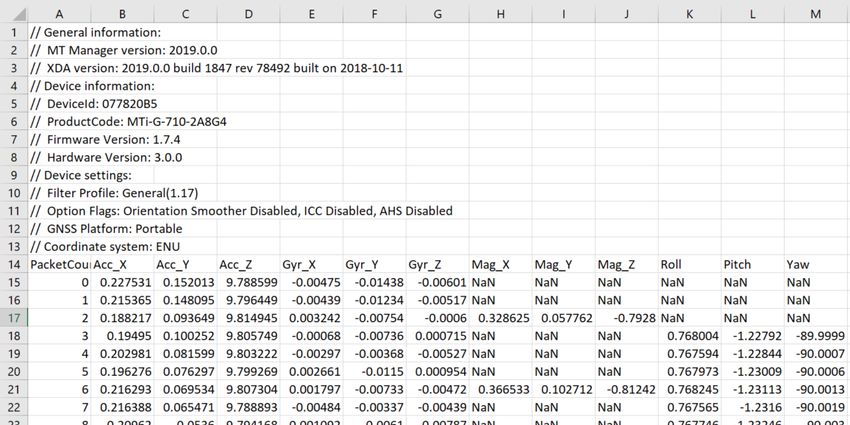
6.3     Using the NTRIP Client ...............................................................................63
  6.4 Using the Device/XDA Data View terminals ...................................................65
    6.4.1 Device Data View .................................................................................65
    6.4.2 XDA Data View ....................................................................................72
  6.5 Typical utilisations .....................................................................................73
    6.5.1 Logging data .......................................................................................74
    6.5.2 Replaying logged data ..........................................................................74
    6.5.3 Exporting ASCII data ............................................................................78
    6.5.4 Exporting KMZ data..............................................................................85
    6.5.5 Using multiple MTis ..............................................................................86

7 System requirements .............................................................. 88

List of Tables
Table 1: MTi product documentation overview ........................................................... 9
Table 1: Playback and plotting options ....................................................................17
Table 2: The MT Manager menu structure ................................................................22
Table 3: The data shown in the Device List ..............................................................24
Table 4: The MT System State shown in the Device List ............................................24
Table 5: The line colours in the inertial data graph....................................................28
Table 6: The different scaling options in the graph windows. ......................................28
Table 7: Colours in the Euler angles graph ...............................................................32
Table 8: Colours in the quaternion graph .................................................................33
Table 9: Signals in the Status window .....................................................................36
Table 10: Colours used in the SV information window ...............................................39
Table 11: Meaning of buttons in the File Control toolbar ............................................41
Table 12: Meaning of the buttons in the Playback and Recording toolbar .....................42
Table 13: The available orientation resets ................................................................42
Table 14: Explanation of the information in the header of the Device Settings window ..46
Table 15: The information displayed in the Device Settings tab ..................................48
Table 16: The modes in the Output Configuration window .........................................49
Table 17: Buttons in the Output Configuration window ..............................................53
Table 18: List of available synchronization functions .................................................56
Table 19: Synchronization options of the Trigger Indication function ...........................57
Table 20: List of options for Send Latest synchronization functionality .........................57
Table 21: List of options for Interval Transition Measurement (SyncOut) functionality ...59
Table 22: List of options for Clock Bias Estimation synchronization functionality ...........60
Table 23: Functions available in the Device Data Viewer ............................................66
Table 24: The options in the menu in the Device Data Viewer after right-clicking the data.
..........................................................................................................................68
Table 25: Parameters shown when data is being processed from a file ........................76
Table 26: Parameters that can be chosen to automatically form a file name for the ASCII
exporter ..............................................................................................................79
Table 27: Overview of all possible exported columns in an ASCII file ...........................81

                                                              4                                    www.xsens.com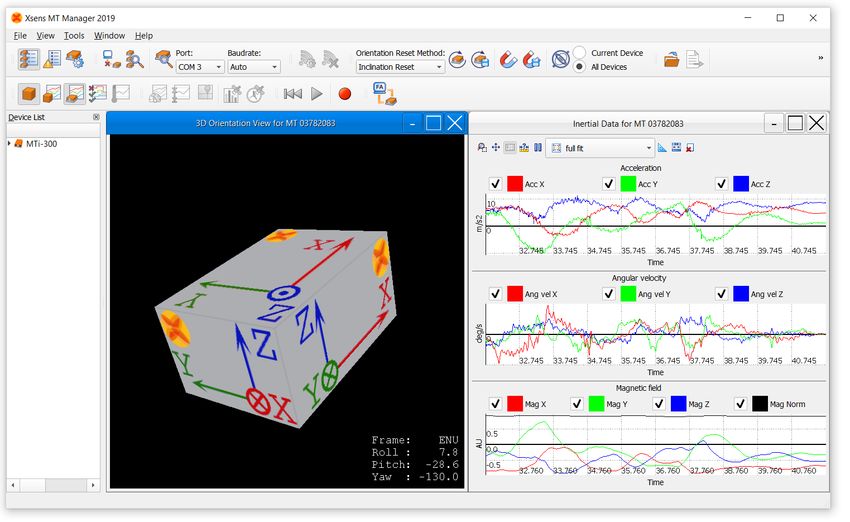
List of Figures
Figure 1: The installation procedure is straightforward. In the second screen, you can
choose to skip installation of several components (not recommended) ........................11
Figure 2: MT Manager scanning for attached devices .................................................12
Figure 3: The main screen of MT Manager with an MTi-300 attached via USB ...............13
Figure 4: The connectivity toolbar ..........................................................................13
Figure 5: Manually selecting the COM port that MT Manager uses during its scanning
procedure ............................................................................................................13
Figure 6: Manually selecting the baud rate that MT Manager uses during its scanning
procedure ............................................................................................................14
Figure 7: MT Manager showing the MTi-300 with DeviceID 03782083 in the Device List 15
Figure 8: The Output Configuration windows features easy to use presets. ..................15
Figure 9: The header of the Device Settings window shows general information on the
MTi .....................................................................................................................16
Figure 10: A typical view of MT Manager .................................................................16
Figure 11: After opening a file with MT Manager, a window is shown when orientation is
not available in the file. .........................................................................................17
Figure 12: The Playback toolbar .............................................................................17
Figure 13: The Graphs options in the Tools - Preferences window ...............................18
Figure 14: The Preferences – ASCII Exporter window ................................................19
Figure 15: The menu bar in MT Manager .................................................................22
Figure 16: The Device List .....................................................................................24
Figure 17: Right-click on the Device allows to disconnect a single MT ..........................25
Figure 18: the Output Configuration tab for an MTi-G-710 GNSS/INS. Depending on the
MTi attached, the Output Configuration window may show fewer options. ....................26
Figure 19: The Data Views and GNSS toolbars .........................................................26
Figure 20: The 3D Box view is an easy way of visualizing the orientation of any MTi .....27
Figure 21: The Inertial data view for acceleration, angular velocity and magnetic field ..28
Figure 22: Tools let you configure the graphs ...........................................................28
Figure 23: A zoom rectangle in the Euler angles graph ..............................................29
Figure 24: Zooming in y-direction only can be enabled with the button "show all samples"
..........................................................................................................................30
Figure 25: Panning is available in all directions .........................................................30
Figure 26: The Show Values button activates the possibility to see the values in the
graph ..................................................................................................................31
Figure 27: Turning off some of the channels allows for closer investigation of a particular
signal ..................................................................................................................31
Figure 28: The orientation graph shows the orientation of the MTi over a period of 10
seconds ...............................................................................................................32
Figure 29: The quaternion graph shows the 4 components in one graph ......................33
Figure 30: The Free Acceleration view, visualizing 3D Free Acceleration in m/s2 ...........34
Figure 31: Tick boxes for status in the Output Configuration window ...........................34
Figure 32: The status window of an MTi-30 AHRS. In this particular screen shot, several
gyroscopes are clipping .........................................................................................35
Figure 33: The status windows of the MTi-G-710 and MTi-7 have two extra channels,
GNSS Fix and Filter Mode ......................................................................................35

                                                              5                                    www.xsens.com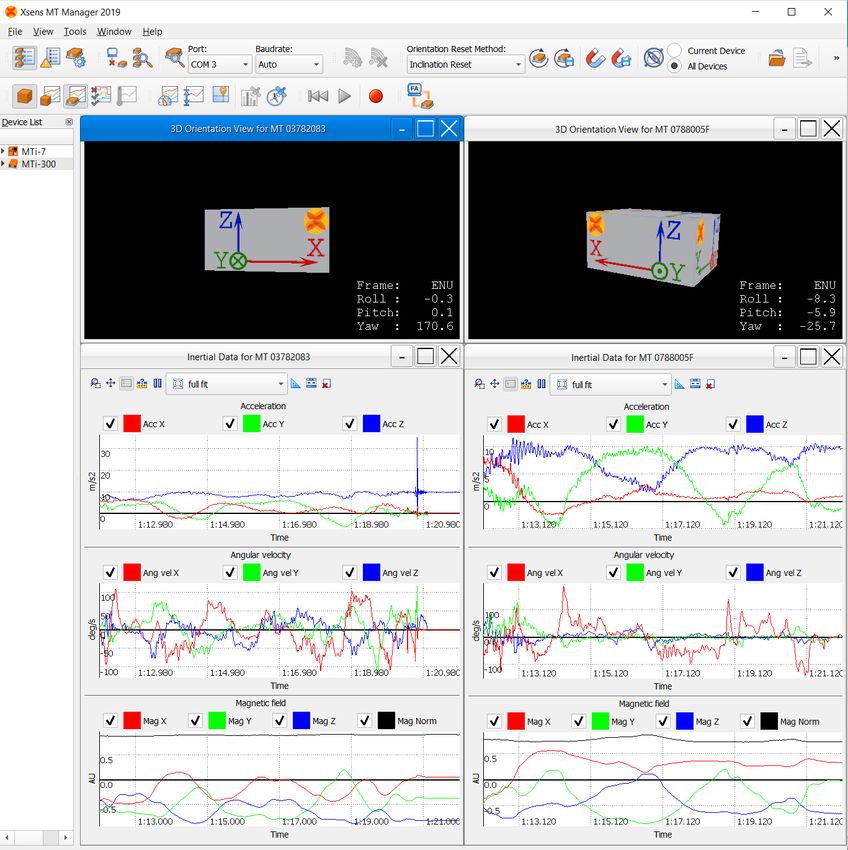
Figure 34: The Temperature view window, showing that the MTi is warming up directly
after powering it. ..................................................................................................36
Figure 35: The Velocity data view, displaying 3D velocity in m/s ................................37
Figure 36: The Altitude data view, displaying height above the WGS-84 Ellipsoid in
meters ................................................................................................................38
Figure 37: The Position view, displaying 2D position .................................................38
Figure 38 The SV info window showing 5 GPS satellites and 6 GLONASS satellites being
used for the navigation solution and 2 satellites that have been detected. ...................39
Figure 39: The UTC Time view. ..............................................................................40
Figure 40: The message terminals for the device (left) and XDA (right) .......................40
Figure 41: The messages window may show warnings on e.g. missed data packets ......41
Figure 42: The Connectivity toolbar ........................................................................41
Figure 43: The File control toolbar ..........................................................................41
Figure 44: The Playback and recording bar when an MTi is attached (left) and when a file
is loaded in MT Manager (right) ..............................................................................41
Figure 45: The orientation resets toolbar can be used to apply a specific reference
coordinate system to the MTi's orientation, velocity and sensors data output ...............42
Figure 46: Click the Representative Motion button to start the Representative Motion
mode. Click it again to stop the Representative Motion mode. ....................................43
Figure 47: This button stores the ICC parameters in the non-volatile memory ..............43
Figure 48: The Manual Gyro Bias Estimation window guides the user through the use of
the feature. .........................................................................................................44
Figure 49: In the Device Settings window, it is important to write the changes made to
the MTi................................................................................................................45
Figure 50: The header shows general information on the MTi .....................................45
Figure 51: The modeling parameters show values determined in Xsens' calibration
procedure ............................................................................................................47
Figure 52: Device settings in the MT Settings dialog show various device-specific settings
..........................................................................................................................49
Figure 53: The mode can be selected at the top of the Output Configuration Window ....49
Figure 54: The Output Configuration window of an MTi-670 that is attached to MT
Manager. When another device is attached, the output configuration window may contain
fewer options. ......................................................................................................50
Figure 55: String report mode output configuration options .......................................51
Figure 56: CAN mode output configuration window of an MTi-670 ..............................52
Figure 57: The Output Configuration Window of a file that contains data from an MTi-G-
710. All outputs are shown, but cannot be edited. ....................................................53
Figure 58: Starting the setup of a synchronization option. .........................................55
Figure 59: Trigger Indication sets a marker in the MTData2 packet when a voltage is read
on the SyncIn line. The red line represents the voltage on the Sync line ......................57
Figure 60: Send Latest configured as Rising Edge .....................................................58
Figure 61: The Interval Transition Measurement with its default settings. ....................59
Figure 62: Clock bias estimation on a clock of 4 Hz. ..................................................60
Figure 63: GPS Clock Sync synchronizes the crystal of the MTi and the GPS clock. ........61
Figure 64: Warning that you are about to delete the GPS clock Sync ...........................61
Figure 65: With StartSampling, the MTi will only start sending data when a pulse has
been received ......................................................................................................62
Figure 66: 1 PPS Time pulse in the Synchronization dialog .........................................62

                                                              6                                    www.xsens.com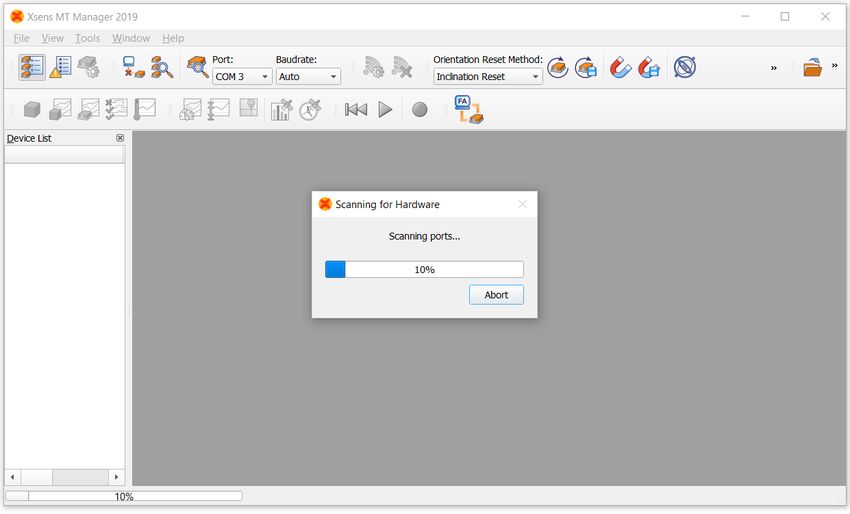
Figure 67: The Sync Options dialog gives a warning when settings are conflicting or
duplicate .............................................................................................................63
Figure 68: NTRIP Client configuration window. .........................................................64
Figure 69: The NTRIP Mount point details contains a detailed overview of all available
mount points. ......................................................................................................65
Figure 70: The Device Data View showing data that is being received from the MTi
device. ................................................................................................................66
Figure 71: A typical view of received MTData2 messages shown in the Device Data View
..........................................................................................................................67
Figure 72: Right-clicking on the data in the window shows a menu with options ...........68
Figure 73: Composing a message in the Device Data View can be done by selecting a
message from the "Compose' menu ........................................................................69
Figure 74: Click "edit" to make changes to the message selected from the "Compose"
menu ..................................................................................................................69
Figure 75: After clicking “edit”, the data field from the message can be edited. ............70
Figure 76: Messages showing the acknowledge sequence in the low-level Xbus protocol 71
Figure 77: An example showing how to request settings from the MTi device. ..............72
Figure 78: The XDA message terminal has an extra field with respect to the Device Data
Viewer, showing the data received from the Xsens Device API (XDA) ..........................73
Figure 79: The logging name can be changed in the Preferences window. Use
and/or  to ensure unique file names ..............................................................74
Figure 80: Log files of the MT Manager have an .mtb extension ..................................75
Figure 81: When opening an .mtb that contains SDI data, you choose the desired filter
profile .................................................................................................................75
Figure 82: The file loading screen, displaying relevant information on file ....................75
Figure 83: The behaviour of the graphs can be adapted in the Preferences - Graphs
window ...............................................................................................................77
Figure 84: The Playback toolbar .............................................................................77
Figure 85: ASCII exporter settings dialog ................................................................78
Figure 86: In the delimiter options, you can even choose your own exotic delimiter, e.g.
§ or ¼ ................................................................................................................79
Figure 87: When no data is available in a row, specify your own characters for the empty
cell/field ..............................................................................................................80
Figure 88: Options for data export ..........................................................................80
Figure 89: Exported ASCII txt file in Excel. Empty fields are filled with NaN (configurable
in the Preferences window). ...................................................................................81
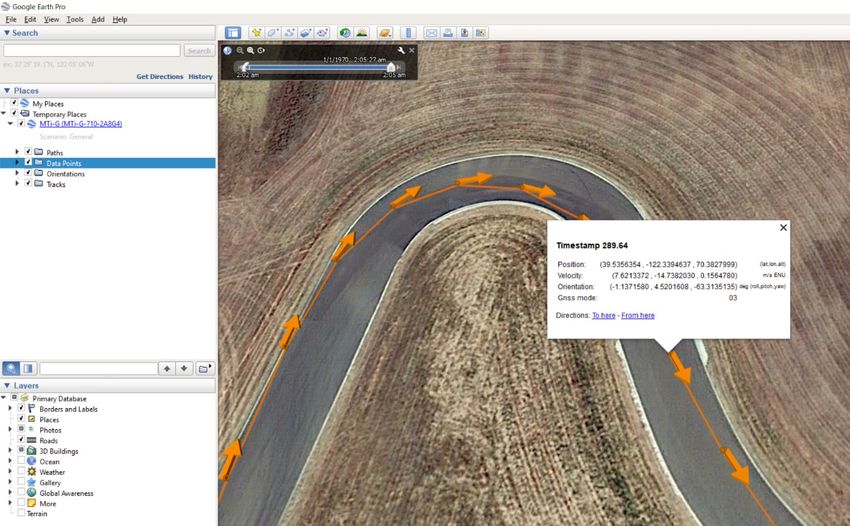
Figure 90: An MTi-G-710 data point in Google Earth .................................................86
Figure 91: Managing an MTi-300 (left) and an MTi-7 (right) .......................................87

List of Abbreviations
The MT Family Reference Manual 1 provides a list of abbreviations used across our MT
documentation.

1The latest available documentation can be found in your MT Software Suite installation
folder or via the following link: https://xsens.com/xsens-mti-documentation

                                                              7                                    www.xsens.com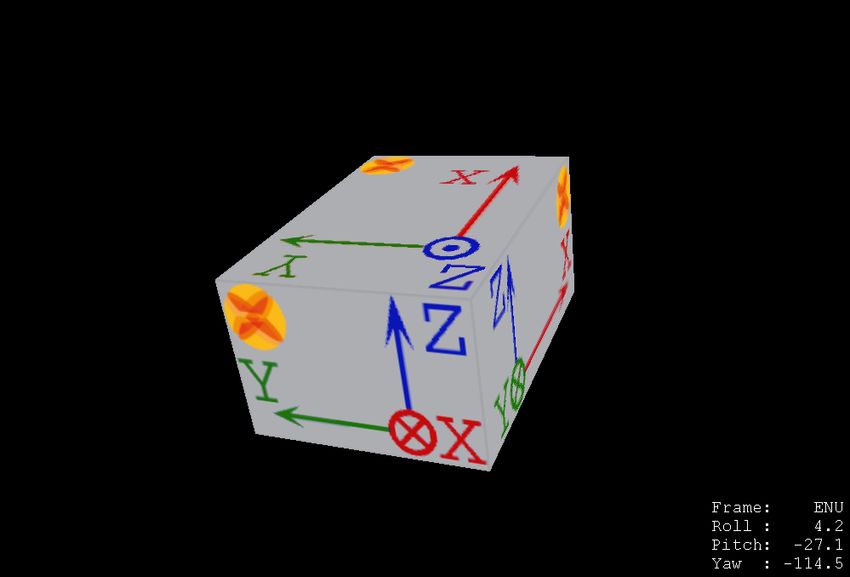
1 References

 Reference id     Document description
 [LLCP]           “MT Low-Level Communication Protocol Documentation.pdf”, document ID
                  MT0101P
 [MFM]            “Magnetic Field Mapper Documentation.pdf”, document ID MT0202P
 [FWU]            “Firmware Updater User Manual.pdf”, document ID FU0100P
 [MTi_10s_100s]   “MTi User Manual.pdf”, document ID MT0605P
 [MTw_SDK]        “MTw SDK User Manual.pdf”, document ID MV0319P
 [MTi_1s]         “MTi 1-series Data sheet”, document ID MT0512P
 [MTI_600s]       “MTi 600-series Data sheet”, document ID MT1603P
 [CAN]            “MT CAN Protocol Documentation”, document ID MT1604P

Note: The latest available documentation can be found in your MT Software Suite
installation folder or via the following link: https://xsens.com/xsens-mti-documentation

                                               8                            www.xsens.com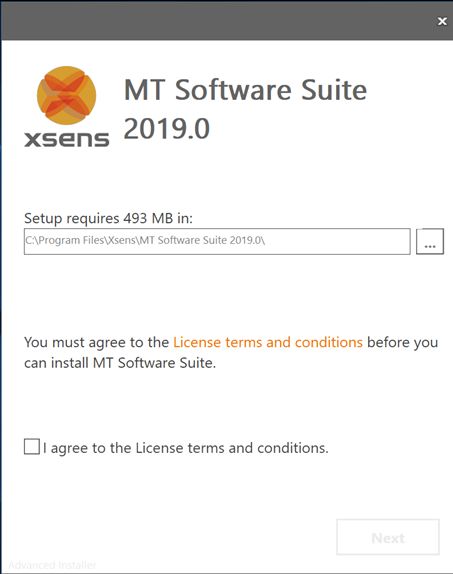
2 Xsens Help Center and User Community
Xsens has an extensive help center, a place where users of Xsens and Xsens employees
(support, field application engineers, sales and R&D engineers) meet. The knowledge
base contains tips and tricks, guidance and answers to frequently asked questions. News
is also shared at the knowledge base and it is possible to ask additional questions
(registration required).

The user community is the place to ask questions. Answers may be given by other users
or by Xsens employees. The response time in the user community is significantly shorter
than the response time at Xsens support.

The knowledge base and user community are searchable simultaneously. A search query
thus shows results irrespective of the source.

Please visit https://base.xsens.com to complete your 1 minute registration.

Table 1 summarizes all available official documents for the Xsens MTi product line.

                        Table 1: MTi product documentation overview

         MTi 1-series                   MTi 600-series             MTi 10/100-series
                 MTi Family Reference Manual
   MTi 1-series Datasheet          MTi 600-series Datasheet
                                    MTi 600-series DK User
 MTi 1-series DK User Manual
                                            Manual
                                                                    MTi User Manual
                                      MTi 600-series HW
 MTi 1-series HW Integration          Integration Manual
            Manual                     MT CAN protocol
                                        Documentation
                                     MT Manager Manual
                                 Magnetic Calibration Manual
                     MT Low Level Communication Protocol Documentation
                                Firmware Updater User Manual

                                              9                           www.xsens.com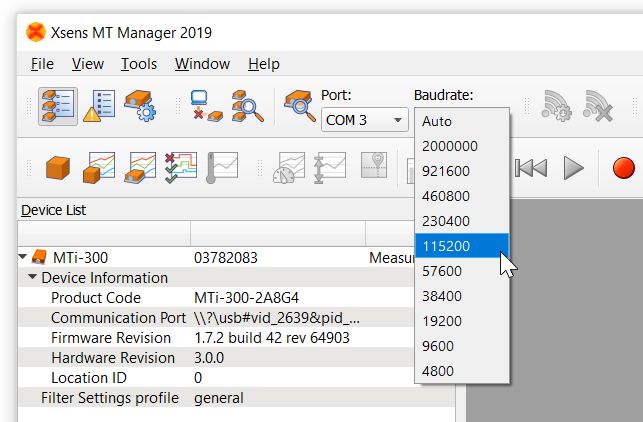
3 Introduction
This user manual describes the product features and operating instructions for Xsens’ MT
Manager 2019.

MT Manager is compatible with all Xsens Motion Trackers (for a complete list of supported
MTs, refer to section 5.3). Note that listed features and sections in this document may
not apply to all Xsens devices. For device specific details please refer to the
documentation listed in Section Error! Reference source not found..

The MT Manager uses the XsensDeviceApi64.DLL or XsensDeviceApi32.DLL with the
dynamic library interface. This is the same API that is provided for software development
in the MT SDK.

The MT Manager software is an easy-to-use software with familiar Windows user
interface, which allows you to:
    • view 3D orientation in real-time
    • view inertial and magnetic sensor data in real time
    • view latitude, longitude, altitude plots in real time (depends on Motion Tracker used)
    • monitor and compose message to and from the device via a message terminal
    • export log files to other formats like ASCII and KMZ
    • change and view various device settings and properties
    • run a self-test to check the mechanical functions of the inertial sensors and
        magnetometer

The MT Manager is therefore an easy way to get to know and to demonstrate the
capabilities of the Motion Tracker.

                                             10                           www.xsens.com
4 Quick start
This section is intended to help you install and use the MT Manager quickly. For detailed
instructions, please go to sections 5 and 6.
4.1 Installing the MT Manager
First you need to install the MT Manager on your computer. This is easily done by using
the MT Software Suite application that guides you through the installation.
NOTE: the most recent version of the software, source code and documentation can be
downloaded from the support section of www.xsens.com.
For users of previous Xsens’ MT software:
Be sure to uninstall the previous version of the USB converter drivers:
Open the Windows Control Panel and go to Add or Remove Programs.
Look for the entry 'Windows Driver Package - Xsens USB-serial Converter Driver
Package'. Please uninstall all entries of these drivers.
For Windows Vista/Windows 7/Windows 8/Windows 10 users:
Download the installer fromwww.xsens.com. This installation procedure also tells the
procedure to install the entire MT Software Suite.
The installation procedure installs several components and starts with the screen as
shown below:
Figure 1: The installation procedure is straightforward. In the second screen, you can choose to skip
installation of several components (not recommended)
11 www.xsens.com4.2 Connecting your device to MT Manager
Connect a device to your PC using the supplied USB cable. With the USB cable, the MTi
device is automatically found.
4.2.1 Automatic COM port selection
Upon execution of the MT Manager it automatically scans the available COM-ports and/or
MTi USB devices on the PC for connected devices.
Figure 2: MT Manager scanning for attached devices
If you are using an RS-485 sensor, be sure to enable the RS-485 compatibility mode in
the General pane via “Tools” → “Options…”, refer to section 5.6. Without RS-485
compatibility enabled, the RS485 MTi device may not be found.
The MTis are displayed in the Device List with the respective unique MT device ID
number.
12 www.xsens.comFigure 3: The main screen of MT Manager with an MTi-300 attached via USB
After physically connecting one or more devices, press the rescan button to let MT
Manager search for connected devices on any available COM port and update the device
list.
When you want to disconnect all devices, press the disconnect button .
4.2.2 Manual COM port selection
If you want to select the COM port manually, then in the Connectivity toolbar:
Figure 4: The connectivity toolbar
You can choose a COM port and the baud rate if you are using a serial connection or a
USB converter, see below. Note that the direct USB connection does not have a COM-
port. Instead, the USB has a unique USB name that you can find in the Device Settings
dialog window, see section 6.2.2.4.
Figure 5: Manually selecting the COM port that MT Manager uses during its scanning procedure
13 www.xsens.comFigure 6: Manually selecting the baud rate that MT Manager uses during its scanning procedure
For the COM ports you can choose between all active COM ports. It is recommended to
use the “Auto” baud rate to have the baud rate determined automatically. Then, press
the “Scan Port” button2 .
To learn how to retrieve the USB name, please refer to section 6.2.2.4.
Now you are ready to go using your Motion Tracker with the MT Manager.
4.3 Basic functionality of MT Manager
This section describes how to setup the MTi for recording and exporting data.
4.3.1 Configuring Motion Tracker
After the MTi is connected, the MTi should be in the Device List in the bar on the left.
2If you are using an RS-485 sensor, be sure to enable the “RS-485 compatibility mode” (refer to
section 4.2.1).
14 www.xsens.comFigure 7: MT Manager showing the MTi-300 with DeviceID 03782083 in the Device List
The first step is to configure the MTi. Open the Device Settings window . The Output
Configuration settings tab will be shown.
The default output configuration can be found in [LLCP]. The preset drop down bar allows
choosing other options. Recording data with the XDA processing preset allows
reprocessing the file with any compatible filter profile. It is possible to select individual
data IDs, but note that when orientation is selected, the onboard processed orientation is
recorded. Files with onboard processed orientation data cannot be reprocessed using a
different filter profile.
Figure 8: The Output Configuration windows features easy to use presets.
In this step-through, the settings of the MTi other than the output configuration will not
be changed. It is however possible to change filter settings, configure synchronization
options or to review the calibration parameters. In the header, it also shows the
hardware ID, Firmware Revision and other MTi information.
15 www.xsens.comFigure 9: The header of the Device Settings window shows general information on the MTi
4.3.2 Recording data
First check if you receive data. Open for example the 3D view and the inertial data
graph .
Figure 10: A typical view of MT Manager
Press the record button in the menu bar: .
The record status is shown in the bottom right corner:
Press the record button again to stop recording.
16 www.xsens.com4.3.3 Opening the file and playback data
Open the file with File – Open,CTRL+O or the Open File icon . When orientation data
is not in the file, a pop-up window will ask for the required filter profile. When applicable,
additional processing options can be enabled or disabled by using the check boxes. See
[MTi_10s_100s] for more information on filter profiles and additional processing options.
Figure 11: After opening a file with MT Manager, a window is shown when orientation is
not available in the file.
You can now playback the file by pressing the Play-button. You can revert to the
beginning of the file with the Rewind to Start-button.
Figure 12: The Playback toolbar
Choose to playback data in real-time or at once by changing graph settings in Tools -
Preferences.
Table 2: Playback and plotting options
Parameter Comments
File plotting Real-time plays data in real-time;
All Data (as fast as possible) plots all data at once. Note that you
need to increase the Maximum Display time to see all data;
All Data (update every 5 sec..) is required when the file is extremely
large
Maximum display Increase this value to a higher value (File) in order to show more
time data, especially useful when investigating a file.
17 www.xsens.comFigure 13: The Graphs options in the Tools - Preferences window
4.3.4 Exporting a file to ASCII
In order to use the data in other programs, e.g. Excel or MATLAB, the MT Manager allows
to export the data to a text file. To do so, click open a log file and press the Export
button . A window will open in which you can elect the data to be exported. When the
exported data is not available, the field will be filled with the Empty Field option. Click
Export to generate the ASCII text file.
18 www.xsens.comFigure 14: The Preferences – ASCII Exporter window
19 www.xsens.com5 Overview MT Manager
This section describes the options available to the user in the MT Manager.
In section 6 operating the MT Manager is described.
5.1 Purpose
The purpose of the MT Manager is to provide easy access to the capabilities of any of the
currently supported devices (refer to section 5.3).
The MT Manager can be used to interface with the MT and to visualize and log data. It
offers export options for ASCII text files. The ASCII export format can be customised to
your needs.
5.2 MT Manager features
The MT Manager software is an easy-to-use software with a familiar Windows user
interface, which allows you to:
• view 3D orientation in real-time
• view inertial and magnetic sensor data in real time
• view latitude, longitude, altitude plots in real time (depends on Motion Tracker used)
• view and compose messages to and from the device via a real time message
terminal
• reprocess binary data log files
• export log files to ASCII
• change and view various device settings and properties
• run a self test to check the mechanical functions of the inertial sensors and
magnetometer
•
The MT Manager is therefore an easy way to get to know and to demonstrate the
capabilities of your Xsens Motion Tracker.
5.3 Supported devices
Currently the following devices are being supported by the MT Manager:
• MTi 1-series
• MTi 10-series 5th generation
• MTi 100-series, including MTi-G-710 GNSS/INS 5th generation
• MTi 600-series
• MTw Awinda [MTw_SDK])
For detailed information about these MTs, please refer to the corresponding User Manuals
and Technical Documentation: [MTi_1s], [MTI_600s] and [MTi_10s_100s].
Future Xsens Motion Trackers will be supported as of their release.
5.4 Input Options
The MT Manager can handle real-time input and input from recorded binary files (see also
sections 6.5.1 and 6.5.2).
Real-time: Serial data using USB or COM port (via USB virtual COM-port or RS2323).
3 COM1 and COM2 only
20 www.xsens.comFiles: .MTB (MT Binary Communication Protocol) 4 log files. Contain recorded
output log-files from a Motion Tracker.
In both cases the input (file) format is the same.
The .MTB log files generated with the MT Manager will contain the following MT Data
messages:
• Configuration data
• Extended MT Specification data (eMTS)
• Filter state message, message ID 0x98 (in case of data with preset “XDA
processing”)
• If enabled, UTC date and time at regular intervals (as configured)
• If enabled, GNSS satellite SVInfo at regular intervals (as configured)
• MTData2 at output frequency (as configured)
The MT Manager software handles the request of these additional data packets from the
MT (not only requesting MT Data) to enable full analysis of log-files in the MT Manager
software later.
NOTE: An MTB file can contain any number of MTData2 packets that are requested from
the MT. Only if an MTB file contains Sensor Component Readout or sensors data (∆q/∆v
or inertial data) and/or GNSS data messages, the data can be re-processed using
different filter profiles. In all other cases the .MTB file is considered a log-file, which can
be played back again for viewing.
In the case that only sensors data and/or GNSS data is requested from the MTi, the MT
Manager will run the sensor fusion filter in XsensDeviceApi64.DLL of the host PC (and not
on the DSP of the MT) to estimate orientation, position, velocity.
5.5 Output Files
The MT Manager can export data logged in .MTB files to different formats as described in
section 6.5.3.
ASCII text data
• Calibrated sensor data (3D acceleration, rate of turn, magnetic field, ∆q/∆v, free
acceleration, etc.)
• Orientation data
• Position
• Velocity
The output orientation can be represented in different conventions:
• Unit normalised Quaternions (also known as Euler parameters)
• Euler angles: roll, pitch, yaw (XYZ Earth fixed type, also known as Cardan)
• Rotation Matrix (Direction Cosine Matrix)
Data and (UTC) time can also be included in the exported files. See 6.5.3.5 for more
information on the columns of the exported ASCII file.
4 The .MTB extension is associated with MT Manager.
21 www.xsens.comKMZ geographic data
• Timestamp
• Position
• Velocity
• Orientation
• GNSS Mode
• UTC time
KMZ files (available from MTi-G-710 and MTi-7data sets only) are excellent to study
trajectories in e.g. Google Earth.
5.6 Menu bar
In the MT Manager menu bar you will find the following entries:
Figure 15: The menu bar in MT Manager
In the table below each (sub-) entry is explained.
Table 3: The MT Manager menu structure
Entry Entry (level 2) Entry (level 3) Description
(level 1)
File Open File Open a previously recorded (shortcut: CTRL-O):
• MT Manager log file (.mtb)
• Xsens log file (.bin and .xm)
• Xbus Master log file (.xm)
• Binary log file (.bin)
Close Closes the currently opened file
Export Export an opened log file to (shortcut: CTRL-E):
• ASCII formatted file
For more details, refer to section 6.5.3.
List of last opened A list of last opened files
files
Exit Closes MT Manager
View Displays Device List Toggle to open/close Device list. Refer to section
5.7.1
Message Window Toggle to open/close the Messages window
Device Settings Toggle to open/close the MT Settings dialog
3D Orientation Toggle to open/close the 3D display of
orientation
Inertial Data Toggle to open/close the inertial data graph
Orientation data Toggle to open/close the orientation graph
Status Data Toggle to open/close the status graph
Temperature Data Toggle to open/close the temperature graph
Velocity Toggle to open/close the velocity graph
Altitude Toggle to open/close the altitude graph
Device Data View Toggle to open/close the Device Data terminal
XDA Data View Toggle to open/close the XDA Data terminal
(hidden by default, enable this feature through
Tools>Preferences)
22 www.xsens.comPosition Toggle to open/close the position graph
Space Vehicle Toggle to open/close the SV information graph
Information
UTC Date/Time Toggle to open/close the UTC date/time window
Status bar Toggle to switch on/off the status bar at the
bottom of the MT Manager window. This status
bar shows playback information, “extended” tool
tips etc.
Tools Preferences MT Manager Here you can change the following general
settings:
Graphs:
- Euler Angles or Quaternions
- Celsius or Fahrenheit
- Toggle display graphs as strobes
- File Plotting mode: Real time or All data
- Display time in graphs
Miscellaneous:
- Orientation output frame
- Toggle show docked MTw’s and log and
visualize docked MTw’s
- Enable RS485 Compatibility
- Enable XDA Data View
XDA options:
- Allows to load an alternative filter
profiles file (use by Xsens support
department only)
Logging Here you can change Logging Settings (refer to
section 6.5.1)
- Name of the log file (template)
Restore Resets the communication settings of an MTi to
Communication the default factory settings, allowing to regain
communication with an MTi in MT Manager (COM
port interface only)
Wireless Opens the wireless configuration window (MTw
configuration only)
Power off All Docked MTws Powers off all docked and USB connected MTws
Wireless system Powers off all MTws that have a wireless
connection
All Devices Powers off all MTws
NTRIP Client Opens the NTRIP Client window (refer to section
6.3).
Window Tile Tiles the open graph windows. Tiling will be done
in order of opening. With 3 graphs, opening the
graphs in a specific order determines which
graph is over the entire height of the window in
the left column and which graphs are placed as
smaller windows in the right column.
Cascade Cascades the open graph windows
Help Documentation Links to the latest online documentation
Support BASE – Knowledge Links to BASE – Articles, guides, FAQ and online
Base and Community user forum
Forum
Contact Support Contact Xsens Product Specialists
Updates Download Firmware Links to the download page for the MTi Firmware
Updater Updater
Check for new MT Check for new MT Software Suite versions
Software Suite versions
Online Shop Opens the webpage http://shop.xsens.com
where accessories and MT’s can be ordered.
About MT Manager Display version information and includes EULA
23 www.xsens.com5.7 Data views, toolbars and buttons
In this section the sub-windows, toolbars and button functionalities of the MT Manager
are explained:
5.7.1 The Device List
By default, the Device List is displayed in a sub-window, showing useful information
about your MT. Note that the Device List is read only.
Figure 16: The Device List
The information in Table 4 is available.
Table 4: The data shown in the Device List
Parameter Description Comments
DeviceID A unique DeviceID. See [MTi_10s_100s] for Fixed value, retrieved from
explanation of the DeviceID device
Product Code Product code, built up from type of device, Fixed value, retrieved from
product series, interface, accelerometer device
range and gyroscope range.
Location ID Location ID that allows identifying the MTi in Can be set in MT Settings
a system setup Dialog
Serial Port USB or COM port number Automatically detected
Filter Settings The filter setting profile used for orientation Can be set in MT Settings
Profile dialog
Table 5: The MT System State shown in the Device List
MT System State Description Comments
Measuring The MT is outputting data
Recording Data is being saved to file
Flushing Data is being retransmitted after Applies to Awinda MTw only
recording has been stopped
Config Mode MT is in config mode. This happens when When you close MT Manager,
configuration messages are sent to the the MTi will go to Config Mode.
MT or when the user puts the MT in See
config mode https://base.xsens.com/hc/en-
us/articles/115003997494
File Mode (open) A file is selected. MT Manager is waiting
for the user to process the file.
File Mode (loading) A file is being loaded and processed Progress is displayed in the
fourth column.
24 www.xsens.comFile Mode (ready) Displayed when a file is loaded and when
the entire file has been processed.
File Mode (playing) Displayed when the file is being played
back
With the Device List, it is possible to disconnect specific devices. Right-click on any
parameter associated with the MTi that needs to be disconnected, right click and choose
Disconnect. The MTi will be removed from the Device List.
Figure 17: Right-click on the Device allows to disconnect a single MT
5.7.2 Device Settings
In the Device Settings window several (low-level) settings can be changed, including the
output configuration. Take caution in changing settings in Device Settings as these
settings can have large effects on the MTi device. In this window it is possible to save
and load a set of device-specific settings, including the output configuration that can be
copied to other devices (with the same product code). You can always revert a device to
its Factory Settings using the Revert button.
For details on the Device Settings, please refer to Section 6.2.2.
5.7.2.1 Output configuration
In the Output Configuration tab, all output options of the MTi can be set, including
frequencies and formats.
25 www.xsens.comFigure 18: the Output Configuration tab for an MTi-G-710 GNSS/INS. Depending on the MTi
attached, the Output Configuration window may show fewer options.
5.7.3 Data Views
The MT Manager offers a wide range of information displayed in its sub-windows, which
can be opened and closed via the (Main Views and GNSS) toolbar buttons or the menu
bar:
Figure 19: The Data Views and GNSS toolbars
The individual buttons and their functionality will be explained in the next sub-sections;
availability of some of the buttons and related sub-windows depends on the type of the
connected device (e.g. position and velocity information will not be accessible with e.g.
MTi-20 VRU or MTi-300 AHRS).
The icons corresponding with the button that activates a specific sub-window are
displayed on the top left of each subsection.
5.7.3.1 3D Box view
The 3D Box View is a real-time graphical (OpenGL) representation of the MT orientation
measurements, i.e. roll, pitch and yaw.
26 www.xsens.comFigure 20: The 3D Box view is an easy way of visualizing the orientation of any MTi
5.7.3.2 Inertial data view
Per sensor type, the Inertial Data view graphically shows the 3D calibrated measurement
data vs. time:
• acceleration (from the accelerometers) in m/s2;
• angular velocity (from the gyroscopes) in deg/s;
• magnetic field (from the magnetometers) in normalised arbitrary units (a.u.).
27 www.xsens.comFigure 21: The Inertial data view for acceleration, angular velocity and magnetic field
Table 6 explains the line colours and the buttons in this view.
Table 6: The line colours in the inertial data graph
Colour Corresponding axis
Red Acceleration, angular velocity (roll) and normalised magnetic field in X direction
Green Acceleration, angular velocity (pitch) and normalised magnetic field in Y direction
Blue Acceleration, angular velocity (yaw) and normalised magnetic field in Z direction
Black Total acceleration, angular velocity or magnetic field, if available
Automatic scaling
It is possible to choose the scaling of the inertial data plot using the pull-down dialog.
Figure 22: Tools let you configure the graphs
Table 7: The different scaling options in the graph windows.
Scaling option Functionality
No auto scaling Y-scale will no longer be scaled
Expand to fit Y-scale will be stretched to show all data in plot
Full fit Y-scale will be stretched to show all data in plot
Zooming
When the Zoom-icon is selected, you have several options to zoom.
28 www.xsens.comOption 1: Press and hold either mouse button, drag mouse to make a zoom rectangle
(right button zooms out, left button zooms in):
Figure 23: A zoom rectangle in the Euler angles graph
-Release mouse button to zoom in/out to the zoom rectangle
-Press other mouse button to cancel the zoom
-Use scroll wheel to make minor adjustment to first point of the rectangle
Option 2: Double click and hold one of the mouse buttons to generate a default zoom
rectangle centered around the mouse position with zoom factor 2.0 (right button zooms
out, left button zooms in):
Then:
-Release mouse button to zoom in/out to the zoom rectangle
-Press other mouse button to cancel the zoom
-Move the mouse to move the zoom rectangle
-Use the scroll wheel to increase/decrease the zoom factor
Option 3: Use scroll wheel without buttons pressed to simulate a double click centered
around the mouse position and immediately applying the zoom i.e. apply a default zoom
rectangle centered around the mouse position (right button zooms out, left button zooms
in).
- NOTE: Zooming is not possible when the autoscale method is set to “full fit”.
Zooming in y-direction only
When zooming with the above option, it can happen that new data will not be shown in
the zoom box, as the x-scale (time) ends before the place where new data is created. In
order to zoom only in y-direction, enable the function “show all samples” with the show
all samples button:
29 www.xsens.comWhen “show all samples” is enabled, the x dimension of the zoom rectangle is always the
complete width of the graph:
Figure 24: Zooming in y-direction only can be enabled with the button "show all samples"
Panning the graph
When the pan icon is enabled, you can pan the graph with the following actions:
- Press and hold left/right mouse button
- Release the mouse to stop panning
- Move the mouse to pan the graph
NOTE: Panning is not allowed when the autoscale method is full fit
Figure 25: Panning is available in all directions
Showing data values
30 www.xsens.comWith the Show Values button enabled, hovering over the graph will display the values
at that moment.
Figure 26: The Show Values button activates the possibility to see the values in the graph
Showing less data channels
With the checkboxes, it is possible to omit data from the plot. This way, you can closely
investigate one particular signal.
Figure 27: Turning off some of the channels allows for closer investigation of a particular signal
Freezing a graph
When you are using an MTi in live view, you cannot pause the file (see section 5.7.6), to
investigate data further. In that case, you can use the freeze button and zoom and pan
on visible data:
Clearing and resetting graphs
There are two ways of clearing and resetting graphs. To clear the graph, use the clear
button .
Another way to reset the zoom that is very convenient when you have used zoom and
pan functions, is to close and open the graph.
5.7.3.3 Orientation data view
The Orientation data view shows the 3D orientation (calculated from the angular
velocities) in either Euler angles in degrees vs. time or Quaternions vs. time
31 www.xsens.comFigure 28: The orientation graph shows the orientation of the MTi over a period of 10 seconds
Table 8 explains the line colours in “degrees vs. time” view:
Table 8: Colours in the Euler angles graph
Colour Corresponding axis
Red Orientation of the X-axis
Green Orientation of the Y-axis
Blue Orientation of the Z-axis
32 www.xsens.comFigure 29: The quaternion graph shows the 4 components in one graph
Table 9 explains the line colours in the “Quaternions vs. time” view:
Table 9: Colours in the quaternion graph
Colour Description
Red q1
Green q2
Blue q3
Black q0
Please refer section 5.7.3.2 for explanation of the various buttons and checkboxes.
5.7.3.4 Free Acceleration view
The Free Acceleration view window visualizes the 3D Free Acceleration of the MTi (VRU,
AHRS and GNSS/INS devices only). By default, Free Acceleration is visualized in the East-
North-Up (ENU) format. In order to switch between ENU, NWU and NED visualizations, go
to Tools > Preferences > MT Manager > Graphs.
33 www.xsens.comFigure 30: The Free Acceleration view, visualizing 3D Free Acceleration in m/s2
5.7.3.5 MT Status
The MT Status sub-window displays various status flags.
Be sure to enable the Status Data Output in MT Output Configuration dialog:
Figure 31: Tick boxes for status in the Output Configuration window
34 www.xsens.comFigure 32: The status window of an MTi-30 AHRS. In this particular screen shot, several gyroscopes
are clipping
Figure 33: The status windows of the MTi-G-710 and MTi-7 have two extra channels, GNSS Fix and
Filter Mode
Please refer section 5.7.3.2 for explanation of the various buttons and checkboxes.
35 www.xsens.comTable 10: Signals in the Status window
Colour Status data description
Red Motion Tracker has passed the self-test according to eMTS. For an up-to-date
self-test indicator, see [LLCP], RunSelfTest
Light green Filter accuracy indicator; low=”not accurate”, high=”accurate”
Dark purple Manual Gyro Bias Estimation (refer to https://base.xsens.com/hc/en-
us/articles/360002763354):
1 (high): running with no rotation assumption
at 2/3 of the y-axis: error: rotation detected, no gyro bias estimated
0 (low): estimation complete, no errors
Bright blue GNSS fix; indicates if the GNSS receiver has a valid fix
Orange RepMo: Representative Motion mode of In-run Compass Calibration (ICC)
active
Dark blue (3x) Clipping flags for the accelerometers, 20g
Dark green (3x) Clipping flags for the gyroscopes, 450 deg/s or 1000 deg/s
Dark red (3x) Clipping flags for the magnetometers
Magenta Filter mode; indicates what the state of the filter in the MTi-G-710 or MTi-7 is,
see [LLCP]
5.7.3.6 Temperature view
The Temperature view window shows the internal temperature of the device.
Temperature data is visualized in degrees Celsius by default. In order to change to
degrees Fahrenheit, go to Tools > Preferences > MT Manager > Graphs.
Figure 34: The Temperature view window, showing that the MTi is warming up directly after
powering it.
36 www.xsens.com5.7.3.7 Velocity view
The Velocity view window visualizes the 3D velocity of the MTi (MTi-G-710 and MTi-7
only). By default, Velocity is visualized in the East-North-Up (ENU) format. In order to
switch between ENU, NWU and NED visualizations, go to Tools > Preferences > MT
Manager > Graphs.
Figure 35: The Velocity data view, displaying 3D velocity in m/s
5.7.3.8 Altitude view
The Altitude view window visualizes the altitude of the MTi (MTi-G-710 and MTi-7 only).
Altitude is displayed as height above the WGS-84 Ellipsoid in meters.
37 www.xsens.comFigure 36: The Altitude data view, displaying height above the WGS-84 Ellipsoid in meters
5.7.3.9 Position view
The Position view window visualizes the 2D position of the MTi (MTi-G-710 and MTi-7
only). Position is displayed in terms of longitudinal and latitudinal coordinates.
Figure 37: The Position view, displaying 2D position
38 www.xsens.com5.7.3.10 Space Vehicle Information window
The Space Vehicle Information (or SatInfo) Window shows the various satellites with
their respective signal strength in dBHz.
The columns are labelled according to the constellation and the number of the space
vehicle. The digit in front of the semicolon indicates the satellite system, the number
after the semicolon is the satellite number. E.g. 0:5 indicates Space Vehicle #5 from the
GPS constellation. The labels are
Table 11: Colours used in the SV information window
Label Color Meaning
Detected (unused) Blue The satellite data is not used for the navigation
solution.
Note that SBAS satellites (1:#) can only be detected
or unhealthy. If SBAS corrections are being used for
the GPS satellites, the GPS satellites are light green.
Used Dark green The satellite data is used for the navigation solution.
No differential corrections have been applied.
Used+D Light green The satellite data is used for the navigation solution;
differential correction have been applied. GLONASS
satellites do not have differential corrections, so they
are always dark green if used for the navigation
solution
Unhealthy Red The satellite data is not used
Figure 38 The SV info window showing 5 GPS satellites and 6 GLONASS satellites being used for
the navigation solution and 2 satellites that have been detected.
39 www.xsens.com5.7.3.11 UTC Time view
The UTC Time view window visualizes the UTC Time output of the MTi. The GNSS receiver
automatically retrieves UTC Time for the MTi-G-710 and MTi-7. For all other devices, UTC
Time can be set manually (see 6.2.2.4).
Figure 39: The UTC Time view.
5.7.3.12 Device/XDA Data View terminals
The message terminal shows messages sent to and received from the device or the
Xsens Device API (XDA) in real-time. The Device Data View terminal can also be used to
compose low-level messages in order to quickly understand the communication protocol.
See section 6.4 for more information about the message terminals. The XDA Data View is
hidden by default. It can be enabled through Tools>Preferences.
Figure 40: The message terminals for the device (left) and XDA (right)
5.7.3.13 Message window
The message window shows warnings and other informational messages.
40 www.xsens.comYou can also read


