Khoe-San Genomes Reveal Unique Variation and Confirm the Deepest Population Divergence in Homo sapiens
←
→
Page content transcription
If your browser does not render page correctly, please read the page content below
Khoe-San Genomes Reveal Unique Variation and Confirm the
          Deepest Population Divergence in Homo sapiens
          Carina M. Schlebusch ,*,,†,1,2,3 Per Sjödin,†,1 Gwenna Breton ,†,1 Torsten Günther,1 Thijessen
          Naidoo,1,2,3 Nina Hollfelder,1 Agnes E. Sjöstrand,1,5,6 Jingzi Xu,1 Lucie M. Gattepaille,1 Mario Vicente,1
          Douglas G. Scofield ,7,8 Helena Malmström,1,2 Michael de Jongh,9 Marlize Lombard ,2 Himla
          Soodyall,10,11 and Mattias Jakobsson*,,1,2,3
          1
           Human Evolution, Department of Organismal Biology, Evolutionary Biology Centre, Uppsala University, Uppsala, Sweden
          2

                                                                                                                                                                 Downloaded from https://academic.oup.com/mbe/article/37/10/2944/5874945 by Uppsala Universitetsbibliotek user on 26 April 2021
           Palaeo-Research Institute, University of Johannesburg, Auckland Park, South Africa
          3
           SciLifeLab, Stockholm and Uppsala, Sweden
          4
           Department of Archaeology and Classical Studies, Stockholm University, Stockholm, Sweden
          5
           Eco-anthropologie, Museum National d’Histoire Naturelle, CNRS, Universite de Paris, Paris, France
          6
           Laboratoire TIMC-IMAG, UMR 5525, Universite Grenoble Alpes, CNRS, La Tronche, France
          7
           Department of Ecology and Genetics, Evolutionary Biology Centre, Uppsala University, Uppsala, Sweden
          8
           Uppsala Multidisciplinary Center for Advanced Computational Science, Uppsala University, Uppsala, Sweden
          9
           Department of Anthropology and Archaeology, University of South Africa, Pretoria, South Africa
          10
            Division of Human Genetics, School of Pathology, Faculty of Health Sciences, University of the Witwatersrand and National Health
          Laboratory Service, Johannesburg, South Africa
          11
            Academy of Science of South Africa
          †
           These authors contributed equally to this work.
          *Corresponding author: E-mails: carina.schlebusch@ebc.uu.se; mattias.jakobsson@ebc.uu.se.
          Associate editor: Connie Mulligan
          The sequence data from the 25 individuals are deposited on the European Genome Phenome archive (https://www.ebi.ac.uk/ega/),
          accession number (EGAS00001004459), and are available for academic research use under controlled access policies.

          Abstract
          The southern African indigenous Khoe-San populations harbor the most divergent lineages of all living peoples. Exploring
          their genomes is key to understanding deep human history. We sequenced 25 full genomes from five Khoe-San pop-
          ulations, revealing many novel variants, that 25% of variants are unique to the Khoe-San, and that the Khoe-San group
          harbors the greatest level of diversity across the globe. In line with previous studies, we found several gene regions with
Article

          extreme values in genome-wide scans for selection, potentially caused by natural selection in the lineage leading to Homo
          sapiens and more recent in time. These gene regions included immunity-, sperm-, brain-, diet-, and muscle-related genes.
          When accounting for recent admixture, all Khoe-San groups display genetic diversity approaching the levels in other
          African groups and a reduction in effective population size starting around 100,000 years ago. Hence, all human groups
          show a reduction in effective population size commencing around the time of the Out-of-Africa migrations, which
          coincides with changes in the paleoclimate records, changes that potentially impacted all humans at the time.
          Key words: Khoe-San, southern Africa, population structure.

          Introduction                                                                          Africans representing the other branch (Gronau et al. 2011;
          Genetics has played an increasingly important role in reveal-                         Veeramah et al. 2012; Schlebusch et al. 2012, 2017; Schlebusch
          ing human evolutionary history, by demonstrating that Homo                            and Jakobsson 2018). Southern African hunter-gatherers
          sapiens emerged from Africa (Cann et al. 1987;                                        (San) and herders (Khoekhoe) are collectively referred to as
          Ramachandran et al. 2005), with some groups outside                                   Khoe-San (Schlebusch 2010). Khoe-San people speak Khoisan
          Africa admixing with archaic humans (Meyer et al. 2012;                               languages, a group of languages that rely heavily on “click”
          Prüfer et al. 2014). Our deepest roots include indigenous                            sounds. Three out of the five major Khoisan language families
          groups of current-day southern Africa, with modern-day                                are spoken in southern Africa, namely, Kx’a (formerly called
          Khoe-San representing one branch in the earliest population                           Northern Khoisan), Tuu (formerly Southern Khoisan), and
          divergence in Homo sapiens, and all other Africans and non-                           Khoe-Kwadi (formerly Central Khoisan). These three

          ß The Author(s) 2020. Published by Oxford University Press on behalf of the Society for Molecular Biology and Evolution.
          This is an Open Access article distributed under the terms of the Creative Commons Attribution Non-Commercial License
          (http://creativecommons.org/licenses/by-nc/4.0/), which permits non-commercial re-use, distribution, and reproduction in any
          medium, provided the original work is properly cited. For commercial re-use, please contact journals.permissions@oup.com       Open Access
          2944                          Mol. Biol. Evol. 37(10):2944–2954 doi:10.1093/molbev/msaa140 Advance Access publication July 22, 2020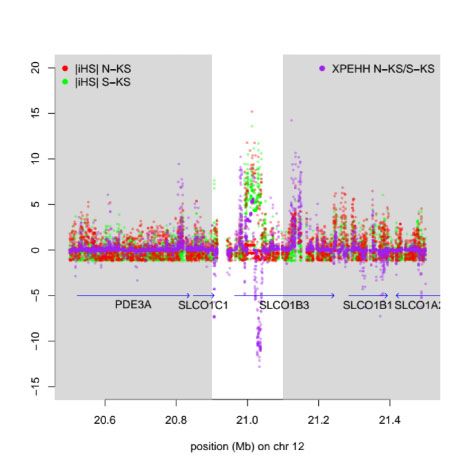
Khoe-San Genomes Reveal Unique Variation . doi:10.1093/molbev/msaa140                                                                MBE
Table 1. Summary of Genomic (autosomal) Variation in Five Individuals each from Five Khoe-San Groups.
Category                                           Total          Karretjie          Nama         jGui kGana        Juj’hoansi         !Xun
Dinucleotide SNPs (filtered)                    18,637,959       10,555,587       10,514,246       10,649,570       10,429,573       10,676,563
Exonic SNPs (%)                                    0.653            0.597            0.598            0.596            0.599            0.598
Novel variants versus dbSNP                 1,960,665 (10.5%) 578,935 (5.5%) 632,492 (6.0%) 491,543 (4.6%) 548,528 (5.3%) 477,360 (4.5%)
  built 151 (% of variants)
Singletons (% of variants)                  5,403,107 (29.0%) 4,547,752 (43.1) 4,504,833 (42.8) 4,639,215 (43.6) 4,315,691 (41.4) 4,660,181 (43.6)
Non-singleton novel variants (% of variants) 602,402 (3.2%) 108,129 (1.0%) 95,736 (0.9%) 97,282 (0.9%) 106,546 (1.0%) 91,365 (0.9%)
Mean Depth per Individual,                   53.4 (45.1–59.8) 52.5 (45.1–56.9) 55.3 (53.7–56.4) 51.7 (48.2–54.8) 52.8 (48.0–59.8) 54.7 (51.7–57.1)
  duplicates excluded

                                                                                                                                                     Downloaded from https://academic.oup.com/mbe/article/37/10/2944/5874945 by Uppsala Universitetsbibliotek user on 26 April 2021
  (all positions in ref genome)
Mean heterozygosity (genomic)                    0.001274         0.001273         0.001266         0.001275         0.001263         0.001291
Heterozygosity variable sites                    0.183249         0.183205         0.182149         0.183438         0.181665          0.18579
  (Called1Filtered Variants)
Tajima’s D                                       20.7827          20.3349          20.3200          20.3609          20.2830          20.3639
Tajima’s D (exonic)                              21.1412          20.5198          20.4844          20.5477          20.4731          20.5446
Mean DAF                                        0.1746052        0.2746496        0.2751872        0.2727002        0.2770476        0.2724151
Mean DAF exonic                                 0.1607157        0.2650433        0.2663403        0.2632778        0.2680222        0.2638948
Total indels (VQSRed)                            2,176,524        1,441,604        1,458,457        1,433,307        1,439,949        1,461,609
Deletions                                        1,267,661         802,507          799,461          812,743          795,648          815,037
Insertions                                        908,863          634,150          634,609          640,933          631,300          642,247
Complex indels                                    527,796          513,400          512,696          514,178          512,684          514,099
Structural variants                                4,452            1,979            2,030            2,419            2,139            2,362
Proportion                                         0.378             0.39             0.37            0.379            0.377            0.374
  Structural variants with genes

language families show no linguistic relatedness to each other                1–3, Supplementary Material online and table 1), we called
(Güldemann 2014). A few complete genomes from Khoe-San                       20,020,719 autosomal SNPs (table 1 and supplementary table
individuals have been investigated with poor representation                   S5.1, Supplementary Material online). After group-wide qual-
among the different groups (Meyer et al. 2012; Kim et al. 2014;               ity filtering (supplementary sections 1–3, Supplementary
Mallick et al. 2016). As the Khoe-San represents one of two                   Material online), 18,637,959 autosomal biallelic SNPs
branches of the deepest population divergence within Homo                     remained (table 1), 1,960,665 (10.5%) of which were novel
sapiens, it is crucial to reveal their evolutionary history and               (compared with dbSNP build 151). The two southern
their genetic diversity in order to understand the early evo-                 Khoe-San groups (Nama and Karretjie People) presented
lutionary history of our species.                                             the most novel variants (table 1 and supplementary fig.
   We sequenced and analyzed 25 complete high-coverage                        S5.4, Supplementary Material online). Although many novel
genomes from five different Khoe-San groups, representing the                 variants were singletons (supplementary fig. S5.3A,
three main Khoisan linguistic phyla, across an extensive geographic           Supplementary Material online and table 1), 3.2% of them
area. These genomes were placed into a global context by jointly              were both novel and present in more than one copy; dem-
investigating 11 previously published genomes from the HGDP                   onstrating that many variants common among the Khoe-San
panel, sequenced on the same platform and subjected to similar                have not been reported yet. Of the 5,101,560 variants present
single nucleotide polymorphism (SNP) calling procedures (Meyer                in all five Khoe-San groups, 24,517 were novel (supplementary
et al. 2012; Raghavan et al. 2014), and another 67 genomes se-                fig. S5.4, Supplementary Material online). These variants, com-
quenced on the Complete Genomics platform (Drmanac et al.                     mon among Khoe-San groups but absent in other popula-
2010; Lachance et al. 2012; 1000 Genomes Project Consortium                   tions, have not been previously characterized.
2015). Using these data sets, we characterized genome variation                   The Khoe-San exhibited the greatest genetic diversity
across the world and inferred past population history, where                  (mean heterozygosity per individual: 1.154  103; fig. 1C
Khoe-San groups showed greater genetic diversity than any other               and supplementary figs. S5.1 and S5.5, Supplementary
group, but still revealed a reduction in effective population size            Material online), compared with other African genomes
coinciding with the Out-of-Africa migrations and bottleneck. We               (mean heterozygosity: 1.079  103, Mbuti, Mandenka,
further discovered a number of selection targets in the Khoe-San              Yoruba, and Dinka). However, modern-day Khoe-San groups
and other groups, and within our common ancestors of                          received 10–30% admixture from a mixed eastern African-
>300,000 years ago. These results shed new light on Pleistocene               Eurasian group 1,500 years ago (Schlebusch et al. 2017;
human demographic history and evolution.                                      Skoglund et al. 2017). When genomic material attributed to
                                                                              recent admixture was masked out, the genetic diversity of the
                                                                              Khoe-San (mean heterozygosity after masking: 1.106  103)
Results and Discussion                                                        decreased and approached that of other African groups (sup-
Among the genomes of 25 individuals (mean coverage 53.4                      plementary fig. S8.1, Supplementary Material online), but still
after mapping and quality filtering; supplementary sections                   remained significantly greater (P ¼ 0.013, Wilcoxon test).
                                                                                                                                              2945
Schlebusch et al. . doi:10.1093/molbev/msaa140                                                                                        MBE

          A

                                                                                                                                                      Downloaded from https://academic.oup.com/mbe/article/37/10/2944/5874945 by Uppsala Universitetsbibliotek user on 26 April 2021
          B                                                               C

          D                                                               E

FIG. 1. Sample locations and genetic diversity in the Khoe-San. (A) Sample locations across the world. Colors depict the various data sets included
in the study and sample sizes are indicated after the population code. CG, Complete Genomics diversity set (Drmanac et al. 2010); HGDP, HGDP
data (Meyer et al. 2012); KGP, 1000 Genomes typed on Complete Genomics platform (1000 Genomes Project Consortium 2015); KSP, this study;
LC, Lachance et al. (2012); SGDP, Simons Genome Diversity Project (Mallick et al. 2016); BBA, Ballito Bay A (Schlebusch et al. 2017). The locations
chosen for the CEU, GIH, and MXL reflect the ancestry of the population (not the sampling location). (B) Sample locations across Africa.
Populations in boldface display newly sequenced individuals. (C) Genetic (autosomal) variation for three population groups: Khoe-San, other
sub-Saharan Africans, and non-Africans. The summary statistics were calculated on the joint KSP and HGDP group called data set to avoid biases.

2946
Khoe-San Genomes Reveal Unique Variation . doi:10.1093/molbev/msaa140 MBE
A
0.005
0.004
Shared private alleles
Karretjie
Nama
0.003
Juhoansi
GuiGhanaKgal
Xun
Mbuti
0.002
Mandenka
Yoruba
Downloaded from https://academic.oup.com/mbe/article/37/10/2944/5874945 by Uppsala Universitetsbibliotek user on 26 April 2021
Dinka
Sardinian
0.001
French
Papuan
Dai
Han
0.000
Karitiana
Karretjie Nama Gui_Gana Juhoansi Xun
B
0.005
0.004
Shared private alleles
0.003
Karretjie
Nama
Juhoansi
GuiGhanaKgal
0.002
Xun
Mbuti
Mandenka
Yoruba
Dinka
0.001
Sardinian
French
Papuan
Dai
Han
0.000
Karitiana
Mbuti Yoruba Dinka Sardinian
FIG. 2. Grouped bar-plots summarizing private allele sharing as a fraction of the total number of variant sites in the data set: (A) Privately shared
alleles of various Khoe-San groups with comparative groups. (B) Privately shared alleles of comparative groups.
Among the Khoe-San, the !Xun had the highest heterozygos- In a set of 99 sequenced individuals (from 31 populations),
ity and allelic diversity (table 1 and supplementary figs. S5.1 we inferred population stratification across the globe
and S5.5, Supplementary Material online), also sharing the (27 million variants; supplementary figs. S6.1, S6.4, and
most alleles with all other African groups (fig. 2B), pointing S6.6, Supplementary Material online). The first two principal
to the highest amount of admixture into the !Xun from non- components (PCs) (supplementary fig. S6.1, Supplementary
Khoe-San African groups among the Khoe-San. Material online) explained 7.5% of the global genetic variation
Fig. 1. Continued
The KSP and HGDP data sets were both sequenced on Illumina platforms. Note that the HGDP San individual was not included in the metrics
shown here. Heterozygosity was computed from the number of variable positions divided by number of sequenced positions, and averaged across
individuals. Mean total runs of homozygosity (ROH) displays the sum over the lengths 0.2–1 Mb. Average (across the genome) number of distinct
alleles (allelic richness) and average number of alleles are unique to a single population (private allelic richness) in a sample of eight haploid
genomes per variable site. Standard errors were calculated. For heterozygosity, it is the standard error of the mean per individual, averaged across
individuals. For ROH, it is the standard error of the mean of individuals. Standard errors for heterozygosity and for allelic richness were very small
(Schlebusch et al. . doi:10.1093/molbev/msaa140 MBE
and roughly divided it into three groups: non-Africans, Khoe- ka range (supplementary tables S7.2 and S7.2, Supplementary
San, and other Africans. Subsequent PCs summarized varia- Material online, and fig. 3). These dates correlate well with
tion in other African hunter-gatherer groups (eastern- and previous estimates (Gronau et al. 2011; Veeramah et al. 2012)
western-rainforest hunter-gatherers and Hadza), as well as that also fall within the 200–300 ka (kiloannum: thousand
variation within the Khoe-San (northern, southern, and cen- years ago) range when applying the mutation rate used here.
tral) (supplementary fig. S6.1, Supplementary Material on- The Juj’hoansi (with the lowest level of recent admixture) had
line). Variation among non-Africans first became visible at a point estimate of 270 ka (9,000 generations), SD 20 ka
PC20 (we note, however, that the African data set was larger (GphoCS method; TT method: 260 ka, SD 12 ka), whereas
than the non-African data set, 60 vs. 39 individuals). This the Nama (with the greatest level of recent admixture) had a
Downloaded from https://academic.oup.com/mbe/article/37/10/2944/5874945 by Uppsala Universitetsbibliotek user on 26 April 2021
PCA—based on a globally representative, whole-genome point estimate of 210 ka, SD 30 ka (TT method: 210 ka,
data set—illustrates the extent of African diversity and is a SD 30 ka; supplementary tables S7.1 and S7.2, Supplementary
reflection of global genetic diversity, in contrast to inferences Material online). The Mbuti then diverged around 220 ka,
based on SNP genotypes, where non-African variation is mag- SD 10 ka (TT method: 215 ka, SD 9 ka), with the other pop-
nified through ascertainment bias and sample bias (supple- ulation divergences occurring subsequently. We inferred a
mentary section 6, Supplementary Material online). mean divergence time of 160 ka, SD 20 ka (TT method:
We found a distinct signal of eastern African/non-African 190 ka, SD 20 ka) among the different San groups, consis-
affinity and shared private variants among the Khoe-San, tent with previous estimates (Schlebusch et al. 2017).
particularly for the Nama (supplementary section 6.7, We note that the population history of humans may
Supplementary Material online, fig. 2, and supplementary not always be well represented by divergence models, as
figs. S6.1–S6.7 and S6.16–S6.19, Supplementary Material on- gene flow often occurs among human groups, and
line). This outcome is consistent with recent migration of isolation-by-distance models may sometimes be better
mixed (eastern African-Eurasian) herding groups to southern descriptions (Vicente et al. 2019). For instance, there is
Africa, and potentially long-term gene flow between eastern distinct sharing of private alleles between the !Xun/
African hunter-gatherers (e.g., Hadza) and Khoe-San (Pickrell Juj’hoansi (who traditionally live in the northwestern part
et al. 2012, 2014; Schlebusch et al. 2012, 2017; Breton et al. of southern Africa) and Mbuti central African rainforest
2014; Macholdt et al. 2014; Skoglund et al. 2017). This pattern foragers, indicating gene-flow across south-central Africa
can also be seen in mtDNA and Y chromosome data (sup- (fig. 2). The indigenous southern African hunter-gatherer
plementary section 5.10, Supplementary Material online) genetic component, might thus have extended far beyond
(Naidoo et al. 2020), with haplogroup sharing detected be- southern Africa in the past (Skoglund et al. 2017; Henn
tween the Juj’hoansi and Hadza. et al. 2018; Scerri et al. 2018, 2019; Schlebusch and
We estimated population divergence between the Khoe- Jakobsson 2018; Vicente et al. 2019). A likely consequence
San and various other groups using different and comple- is that all population divergence estimates should be inter-
mentary approaches (Gronau et al. 2011; Schlebusch et al. preted as lower bounds and that the actual population
2017). We applied a mutation rate of 1.25 108 per base structure could be much older.
pair per generation and a generation time of 30 years to con- The effective ancestral population size (Ne) of currently
vert estimates to years ago in the past (unscaled estimates, living individuals can be estimated from genome data (Li
means, medians, and standard deviations are available in sup- and Durbin 2011), and the resolution for certain time periods
plementary tables S7.1 and S7.2, Supplementary Material on- can be affected by evaluating different numbers of genomes,
line). Consistent with previous studies (Gronau et al. 2011; with increasing numbers improving resolution closer to the
Veeramah et al. 2012; Schlebusch et al. 2012, 2017; Schlebusch present day (Schiffels and Durbin 2014). All human groups
and Jakobsson 2018), the deepest divergences included the were inferred to have had an Ne of 30,000 about 300 ka,
Khoe-San populations (fig. 3 and supplementary tables S7.1 with a reduction in estimated effective size starting around
and S7.2 and figs. S7.1, S7.2, and S7.6, Supplementary Material 150–100 ka (assuming a mutation rate of 1.25 108 per
online); a result probably not caused by “archaic admixture” base pair per generation and a generation time of 30 years;
into the Khoe-San (supplementary section 10 and fig. S10.1, fig. 4 and supplementary fig. S7.11, Supplementary Material
Supplementary Material online). Modern-day Khoe-San have, online). Non-African populations reached a lowest level (Ne
however, >10% of their genetic material tracing to a recent 2,000) in the bottleneck around 80 ka, coinciding with the
admixture with external groups (Schlebusch et al. 2017; Homo sapiens Out-of-Africa migration event (Nielsen et al.
Skoglund et al. 2017). By sequencing the genome of the 2017). Surprisingly, most African populations also showed a
Stone Age boy from Ballito Bay (BBA), South Africa, the deep- reduction in estimated Ne during this period, reaching 1/3
est population divergence in Homo sapiens was estimated to of the previous Ne (fig. 4 and supplementary figs. S7.10 and
350,000–260,000 years ago (Schlebusch et al. 2017). S7.11, Supplementary Material online). The decline in effec-
Consistent with the recent admixture into all modern-day tive population sizes appears to be the largest among eastern
Khoe-San groups, which reduces population divergence African populations, followed by western Africans, and sub-
time estimates (Schlebusch et al. 2017) (supplementary sec- sequently by the rainforest hunter-gatherer populations.
tion 8 and figs. S7.2, S7.4, and S8.2, Supplementary Material Khoe-San groups seem to be the least affected; however,
online), we found the mean divergence time of all Khoe-San the genome of the 2,000-year-old Ballito Bay boy (unaffected
populations from all other groups to be within the 200–300 by recent admixture into Khoe-San groups) also showed a
2948Khoe-San Genomes Reveal Unique Variation . doi:10.1093/molbev/msaa140 MBE
A Calculations based on modern DNA Calculations based on modern and ancient
only (this study): DNA (Schlebusch et al. 2017):
Khoe-San Ballito Bay A
Mbuti
Mbuti Western Africans
Western Africans Eastern Africans
Eastern Africans Non-Africans
Non-Africans
Downloaded from https://academic.oup.com/mbe/article/37/10/2944/5874945 by Uppsala Universitetsbibliotek user on 26 April 2021
B Density
10.0
GPhoCS
estimates
5.0
0.0
0 100000 200000 300000
●
TT method ● ●
●
estimates ●
●
FIG. 3. Population divergence estimates. (A) Schematic overview of the estimated population divergences. The colored nodes correspond to the
population divergences that were estimated with the TT method and GPhoCS, and the estimates are presented in (B). (B) Distribution of
divergence time estimates based on GPhoCS (unscaled estimates, means, and medians available in supplementary table S7.1, Supplementary
Material online) and mean 6 standard error of the divergence time estimated with the TT method (supplementary table S7.2, Supplementary
Material online).
reduction in effective population size (fig. 3A; Schlebusch et al. of varying conditions of bottleneck strength, duration, and
2017). age. From this investigation, we observed a qualitatively similar
If we jointly analyze two individuals (four haploid genomes) pattern (supplementary sections 7.3 and 9, Supplementary
instead of one, it should provide more resolution on the tim- Material online) of reduced power to infer population-size
ing of the bottleneck (Schiffels and Durbin 2014), because the changes around 80 ka when basing the inference on single
mean time to first coalescence for four haploid genomes is 85 genomes. Thus, all human groups appeared to have suffered
ka (assuming an average ancestral Ne of 17,000 and a genera- reduced Ne, of varying degrees, between 100 and 20 ka;
tion time of 30 years). For this analysis, we found that all Khoe- declining to between 50% and 10% of an Ne of 30,000 at
San groups showed a reduction to 1/3 of the previous Ne 300 ka. We note that Ne does not necessarily capture the
between 100 and 20 ka (fig. 4C and supplementary fig. S7.12, census size and that population structure clearly can impact
Supplementary Material online). The same pattern was also the estimates of Ne (Mazet et al. 2016). However, in terms of
observed with samples of five individuals (ten haploid population genetics and understanding of past population
genomes), though it could not be detected with samples of histories, estimates of Ne are informative as they tell us about
one single modern-day Khoe-San individual (fig. 4 and sup- the rate of genetic drift, which in turn can be important for
plementary fig. S7.12, Supplementary Material online). We understanding the evolutionary history.
simulated data under a bottleneck model and ran MSMC With the 25 complete genomes from Khoe-San individuals
on samples of one, two, four, and five individuals under a range that represent one of two legs of the deepest population
2949Schlebusch et al. . doi:10.1093/molbev/msaa140 MBE
50000
Karretjie Nama San
GuiGhanaKgal Xun Other African
Juhoansi baa001 non−African
40000
Effective population size
30000
20000
Downloaded from https://academic.oup.com/mbe/article/37/10/2944/5874945 by Uppsala Universitetsbibliotek user on 26 April 2021
10000
0
PC1 Sea Surface Temp.
4
2
0
−2
10000 20000 30000 40000 50000 −4
Karretjie Juhoansi Xun
GuiGhanaKgal Nama
Effective population size
2 chromosomes 4 chromosomes 10 chromosomes
0
0 50000 100000 150000 200000 250000
Years ago
FIG. 4. Estimates of effective population size across time. (A) Effective population sizes estimated for autosomal data from single individuals (i.e.,
two chromosomes) for the Khoe-San (average over the five individuals in each population), the HGDP individuals, and the Stone Age southern
African Ballito Bay A boy (BBA; Schlebusch et al. 2017). (B) African temperature variation estimated from the reconstruction of sea surface
temperature in the southwestern Indian Ocean (Caley et al. 2018). (C) Khoe-San effective population sizes estimated from single individuals (“two
chromosomes,” solid gray), pairs of individuals (“four chromosomes,” solid colored lines), and five individuals (“ten chromosomes,” colored dotted
lines). The curves are averaged over all MSMC runs for all different combinations of individuals (respectively, five, ten, and one).
divergence in Homo sapiens, we have a unique opportunity to and table S12.2, Supplementary Material online) and use the
search for regions in the genome that display an unusual 3P-CLR (Racimo 2016) statistic to investigate adaptation in
signal of high numbers of derived variants among all groups the lineage leading to Homo sapiens.
of humans. This pattern will be an indicator of distinct adap- Four of the top-ten 3P-CLR peaks and four of the eight
tation prior to the deepest population divergence, top-five regions for the three PBS-statistics (because there is
>300,000 years ago. We developed and investigated three overlap among the PBS top lists, the three top-five lists sum
Population Branch Statistic (PBS) - derived analyses (supple- up to eight genomic regions) can be linked to selection for
mentary section 12, Supplementary Material online; brain development (supplementary section 12,
Schlebusch et al. 2012) that target different parts of human Supplementary Material online). The region with the stron-
evolutionary history (fig. 5A and supplementary section 12 gest signal common to all three PBS statistics implicates the
2950Khoe-San Genomes Reveal Unique Variation . doi:10.1093/molbev/msaa140 MBE
A B
Downloaded from https://academic.oup.com/mbe/article/37/10/2944/5874945 by Uppsala Universitetsbibliotek user on 26 April 2021
C D
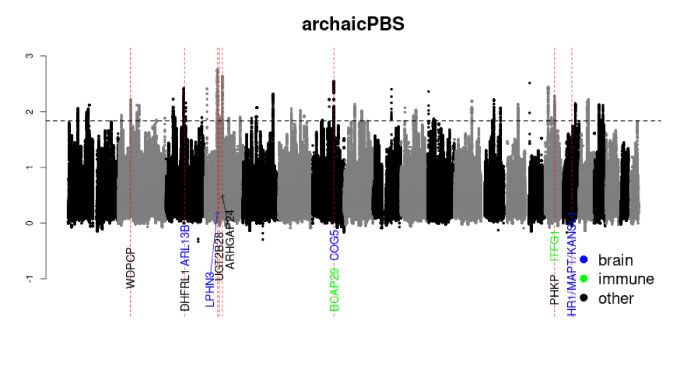
FIG. 5. Signatures of adaptation in the genomes. (A) Schematic overview of the three different population branch statistic (PBS) based analyses. The
different PBS-based statistics are designed to capture adaptation signals in different parts of the phylogeny. (B) Manhattan plot of the archaicPBS
statistic across the genome (supplementary fig. S12.3, Supplementary Material online, displays the aPBS and the emhPBS results). The eight dashed
red lines show all the top-five peaks among the three PBS statistics (they are highly correlated). The most likely candidate genes are written below
the peaks with genes involved with brain functions, immune system, and other functions indicated in blue, green, and black, respectively. The
dashed horizontal line shows the 99.9% percentile of the archaicPBS statistic for these data. (C) A close-up of the strongest peak for archaicPBS,
which is located upstream of the gene LPHN3. (D) An example of a local selection signal in southern Khoe-San. jiHSj for southern Khoe-San is
shown in green, jiHSj for northern Khoe-San in red, and XP-EHH in purple. The strong negative XP-EHH values suggest adaptation in southern
Khoe-San.
LPHN3 (latrophilin 3) gene on chromosome 4 (fig. 5B and top-five regions for the PBS-statistics overlap with immune
C), which has an important function in determining the response genes (supplementary sections 12.1 and 12.2,
connectivity rates between the principal neurons in the Supplementary Material online). Additional strong signals
cortex, and the gene is associated with attention deficit– are found for genes in sperm/flagellum motility (supplemen-
hyperactivity disorder (Lu et al. 2015). For several of these tary sections 12.1 and 12.2, Supplementary Material online);
genes, there is also a strong effect on skull morphology, in for example, the DNAL1 gene expressed in motile flagella is
addition to the brain-associated effect (see supplementary located in the region with the strongest 3P-CLR signal (sup-
section 12, Supplementary Material online), a result that plementary section 12.1, Supplementary Material online) and
has been reported previously (Green et al. 2010; the flagellum category is an enriched GO-term in two of the
Schlebusch et al. 2012). Furthermore, the regions with three PBS statistics (supplementary tables S12.3 and S12.5,
strong signals of adaptation in the lineage leading to Supplementary Material online).
Homo sapiens are enriched for brain development genes We note that identifying targets of selection in early
in gene ontology (GO) analyses (Kofler and Schlotterer humans, several hundred thousands of years ago, is a difficult
2012) (supplementary tables S12.1 and S12.5, problem and that, similar to previous studies (Schlebusch
Supplementary Material online). et al. 2012; Racimo et al. 2014; Racimo 2016), our approach
Immune response genes also overlap with signals of adap- also results in a list of potential targets of selection, which
tation in the lineage leading to Homo sapiens. For instance, need further investigation. However, although there is modest
the third and fourth strongest 3P-CLR signals and two of the overlap with previous studies, the emerging trend of these
2951Schlebusch et al. . doi:10.1093/molbev/msaa140 MBE
investigations points to some similarity in gene functions table S11.8, Supplementary Material online) overlaps with the
(Green et al. 2010; Schlebusch et al. 2012; Racimo et al. MINPP1 gene-region, which codes for the only enzyme known
2014; Racimo 2016). to hydrolyze phytic acid in humans. Phytic acid is storing
In addition to adaptation in the lineage leading to Homo phosphorus in many plant tissues, particularly in bran, seeds,
sapiens, we searched for gene regions targeted by selection in cereals, and grains. Phytic acid is not digested by humans, but
specific groups, that is, local adaptation signals using it chelates minerals and vitamins and tends to decrease their
haplotype-based methods for within population (iHS; uptake from food (supplementary section 11.8,
Voight et al. 2006) and between population comparisons Supplementary Material online). The sign of the signal indi-
(XP-EHH; Sabeti et al. 2007) (see supplementary section 11, cates that this gene has been under much stronger selection
Downloaded from https://academic.oup.com/mbe/article/37/10/2944/5874945 by Uppsala Universitetsbibliotek user on 26 April 2021
Supplementary Material online). Signals of local adaptation in the non-Khoe-San group than in the Khoe-San group. This
frequently overlapped with genes involved in immune re- signal has not been reported previously and is an ideal can-
sponse to infectious diseases in several of the analyses and didate for future studies that focus on potential targets of
on different levels of population groupings. For instance, selection, related to the change in food-producing lifeways.
within the northern Khoe-San the strongest signal overlapped Genes involved in skeletal muscle development show sig-
with the MHC-region (supplementary table S11.1 and fig. nals of adaptation, specifically among the Khoe-San popula-
S11.1, Supplementary Material online), and the two strongest tions (supplementary sections 11.5–11.7, Supplementary
signals in the southern Khoe-San were found close to the Material online). In southern Khoe-San, two strong selection
MHC region; near several genes coding for immunoglobins signals (the second strongest XP-EHH signal and the widest
(supplementary table S11.3 and fig. S11.1, Supplementary XP-EHH signal) both implicate genes associated with muscle
Material online). When contrasting the northern and south- function (the DTNB gene and the NAA35 gene; supplemen-
ern Khoe-San, two other regions within the MHC were iden- tary table S11.4, Supplementary Material online), the SNTB1
tified as strong targets of adaptation (in the top-ten regions in gene was among the top-ten XP-EHH regions in northern
XP-EHH analysis; supplementary table S11.2 and fig. S11.2, Khoe-San (supplementary table S11.2, Supplementary
Supplementary Material online). GO-term analyses (Kofler Material online), and the strongest iHS signal in the Khoe-
and Schlotterer 2012) show enrichment for immune response San group as whole overlaps with the PPP1R12B gene region
genes among the adaptation signals in the southern Khoe- that plays a regulatory role in muscle contraction (supple-
San as well as in other Africans (supplementary table S11.9, mentary table S11.5, Supplementary Material online).
Supplementary Material online). Previous studies found the Selection acting on genes related to muscle development
MHC region to be a common target of selection in various and function has been reported previously for Khoe-San
Khoe-San groups (Schlebusch et al. 2012; Owers et al. 2017; groups (Schlebusch et al. 2012) and other populations
Sugden et al. 2018) as well as other populations (Pickrell et al. (Pickrell et al. 2009). Interestingly the DTNB gene specifically
2009). The greatest single iHS-value in the northern Khoe-San also appeared in the top 1% of selected genes in East Asians,
overlaps with the anthrax toxin receptor-like pseudogene 1 the SNTB1 gene in the top 1% in Oceania (it was the top-11th
(ANTXRLP1, on chromosome 10), which is near the anthrax iHS signal) and the PPP1R12B gene in the top 1% in Bantu-
toxin receptor-like (ANTXRL) gene. Anthrax is endemic to speaking groups (it was the top-14th iHS signal) (Pickrell et al.
Namibia, where many of the northern San groups live, and 2009).
causes intense sporadic disease outbreaks affecting wild ani- Based on the complete genomes, we also examined the
mals and humans (Turner et al. 2013). This signal has not distribution of loss-of-function (LOF) variants in the Khoe-
been reported previously. In summary, immune system- San and estimated levels of functional significance (supple-
related genes appear to be targets of adaptation irrespective mentary section 5.9, Supplementary Material online).
of time and group, but with slightly different genes involved, Biological functions associated with LOF variants in the
which, sometimes, can be directly linked to local and endemic Khoe-San included the detection of chemical stimuli (smell
disease conditions. and taste), receptor activity, immune response, and keratin/
Signals of local adaptation overlap with genes associated intermediate filaments (supplementary table S5.7,
with diet, for instance the FRRS1 gene involved in dietary Supplementary Material online). We found two examples
absorption of iron shows a strong signal in the northern of LOF variants which are close to completely lost in most
Khoe-San (supplementary table S11.2 and supplementary non-African populations, but are found at moderate to high
section 11.5, Supplementary Material online), and the frequencies among the 25 Khoe-San individuals; CASP12 and
SLCO1B3 gene that mediates fat metabolism and uptake of FMO2. The functional form of the CASP12 gene was found at
xenobiotic compounds shows a strong adaptive signal in the 48% among the 25 Khoe-San individuals, whereas the global
southern Khoe-San (the genome-wide greatest single iHS- average is around 5% and the loss of the Caspase-12 protein
value; fig. 5D and supplementary table S11.3 and supplemen- has been associated with an increased risk of sepsis as it is
tary section 11.6, Supplementary Material online). Adaptation involved in the downregulation of inflammatory cytokines
to increased metabolism of endo- and xenobiotics (Schuster (Saleh et al. 2004, 2006). Although the nonfunctional form
et al. 2010) and fat storage (Sugden et al. 2018) have been of FMO2 is close to fixation in most populations, the func-
reported previously for Khoe-San groups. The genome-wide tional form was found among the Khoe-San at 60%. The gene
greatest signal of group-specific adaptation (supplementary product is an enzyme that metabolizes thiourea; however, in
2952Khoe-San Genomes Reveal Unique Variation . doi:10.1093/molbev/msaa140 MBE
doing so produces toxic derivatives (Veeramah et al. 2008). Laboratory, Sweden. The SNP&SEQ Technology Platform is
Carriers of the functional allele may be at increased risk for also supported by the Knut and Alice Wallenberg
pulmonary toxicity when exposed to thiourea, which is pre- Foundation. We thank Joseph Lachance and Sarah Tishkoff
sent in a wide range of industrial, household, and medical for sharing the data published in Lachance et al. (2012) and
products. The high frequencies of these functional alleles in Carolina Bernhardsson for help with the data upload. We
the Khoe-San may point to differing selective pressures expe- thank the Working Group of Indigenous Minorities in
rienced in the past by these populations. Southern Africa (WIMSA) and the South African San
Council for their support and facilitating fieldwork. The proj-
Conclusion ect was reviewed and approved by the University of
Downloaded from https://academic.oup.com/mbe/article/37/10/2944/5874945 by Uppsala Universitetsbibliotek user on 26 April 2021
The genetic diversity among the Khoe-San is the greatest Witwatersrand (South Africa) Human Research Ethics
among all human groups across the world, which, in part, is Committee (M180654), the Swedish Ethical Review
explained by relatively recent (pre-colonial) admixture. When Authority (Dnr 2019-05174), and the South African San
the admixed DNA portion was excluded, the genetic diversity Council. This work was supported by the Swedish Research
of the Khoe-San approached levels seen in other African Council (No. 621-2014-5211 to C.M.S. and No. 642-2013-8019
populations. All human groups, including the Khoe-San, to M.J.], the Lars Hierta Foundation (to C.M.S.), the Nilsson-
showed a reduction in Ne (between 1/3 and 1/10) between Ehle Endowments (to C.M.S.), the European Research Council
100 and 20 ka (fig. 4). The early phase of the reduction (ERC—No. 759933 to C.M.S.), and the Knut and Alice
coincides with the Out-of-Africa bottleneck for non- Wallenberg Foundation (to M.J.).
Africans. Sub-Saharan African populations would not have
been impacted by this migration bottleneck, but they all (in-
References
cluding the Khoe-San) show a reduction in Ne (fig. 4C). This
observation suggests that an additional factor—beyond the 1000 Genomes Project Consortium; Auton A, Brooks LD, Durbin RM,
Garrison EP, Kang HM, Korbel JO, Marchini JL, McCarthy S, McVean
migration out of Africa—impacted all humans at this time, GA, Abecasis GR. 2015. A global reference for human genetic vari-
perhaps the change in climate. For example, work on the Lake ation. Nature 526(7571):68–74.
Malawi core indicates severe drought and low-lake stage oc- Beuning KRM, Zimmerman KA, Ivory SJ, Cohen AS. 2011. Vegetation
curring between 109 and 92 ka when the area is also shifting response to glacial-interglacial climate variability near Lake Malawi in
from leaf- to grass-dominated vegetation (Veeramah et al. the southern African tropics. Palaeogeogr Palaeoclimatol Palaeoecol.
303(1–4):81–92.
2008; Beuning et al. 2011; Scholz et al. 2011), which roughly Breton G, Schlebusch CM, Lombard M, Sjodin P, Soodyall H, Jakobsson
aligns with a change from warm toward colder temperatures M. 2014. Lactase persistence alleles reveal partial East African ances-
for Africa (fig. 4B; Caley et al. 2018). These events may have try of southern African Khoe pastoralists. Curr Biol. 24(8):852–858.
caused a reduction in the number of humans; potentially also Caley T, Extier T, Collins JA, Schefuß E, Dupont L, Malaize B, Rossignol L,
driving them out of arid African regions, such as the Sahara, Souron A, McClymont EL, Jimenez-Espejo FJ, et al. 2018. A two-
million-year-long hydroclimatic context for hominin evolution in
and into western Asia. southeastern Africa. Nature 560(7716):76–79.
By revealing substantial and previously unknown genetic Cann RL, Stoneking M, Wilson AC. 1987. Mitochondrial DNA and hu-
variation, we demonstrate that a sizable portion of human man evolution. Nature 325(6099):31–36.
genetic variation, including common variants, remains undis- Drmanac R, Sparks AB, Callow MJ, Halpern AL, Burns NL, Kermani BG,
covered among populations often overlooked in medical ge- Carnevali P, Nazarenko I, Nilsen GB, Yeung G, et al. 2010. Human
genome sequencing using unchained base reads on self-assembling
netics. We inferred adaptation signals in the genomes and DNA nanoarrays. Science 327(5961):78–81.
found an overrepresentation of these signals overlapping im- Green RE, Krause J, Briggs AW, Maricic T, Stenzel U, Kircher M, Patterson
munity genes, irrespective of group or time period. This sug- N, Li H, Zhai W, Fritz MH, et al. 2010. A draft sequence of the
gests that immunity genes have been under selection Neandertal genome. Science 328(5979):710–722.
throughout human evolutionary history and across the globe. Gronau I, Hubisz MJ, Gulko B, Danko CG, Siepel A. 2011. Bayesian infer-
ence of ancient human demography from individual genome
sequences. Nat Genet. 43(10):1031–1034.
Materials and Methods Güldemann T. 2014. “Khoisan” linguistic classification today. In:
A full description of materials and methods is included in the Güldemann T, Fehn A-M, editors. Beyond ‘Khoisan’: historical rela-
tions in the Kalahari Basin. Current Issues in Linguistic Theory 330.
Supplementary Material online. Amsterdam: John Benjamins. p. 1–41.
Henn BM, Steele TE, Weaver TD. 2018. Clarifying distinct models of
Acknowledgments modern human origins in Africa. Curr Opin Genet Dev. 53:148–156.
Kim HL, Ratan A, Perry GH, Montenegro A, Miller W, Schuster SC. 2014.
We are grateful to all subjects who participated in this re- Khoisan hunter-gatherers have been the largest population through-
search. The computations were performed at the Swedish out most of modern-human demographic history. Nat Commun.
National Infrastructure for Computing (SNIC-UPPMAX). 5(1):5692.
We thank Johanna Lagensjö and the Uppsala SNP&Seq Kofler R, Schlotterer C. 2012. Gowinda: unbiased analysis of gene set
Platform for use of laboratory space and reagents. enrichment for genome-wide association studies. Bioinformatics
28(15):2084–2085.
Sequencing was performed by the SNP&SEQ Technology Lachance J, Vernot B, Elbers CC, Ferwerda B, Froment A, Bodo JM, Lema
Platform in Uppsala. The facility is part of the National G, Fu W, Nyambo TB, Rebbeck TR, et al. 2012. Evolutionary history
Genomics Infrastructure supported by the Swedish and adaptation from high-coverage whole-genome sequences of
Research Council for Infrastructures and Science for Life diverse African hunter-gatherers. Cell 150(3):457–469.
2953Schlebusch et al. . doi:10.1093/molbev/msaa140 MBE
Li H, Durbin R. 2011. Inference of human population history from characterization of positive selection in human populations.
individual whole-genome sequences. Nature 475(7357): Nature 449(7164):913–918.
493–496. Saleh M, Mathison JC, Wolinski MK, Bensinger SJ, Fitzgerald P, Droin N,
Lu YC, Nazarko OV, Sando R 3rd, Salzman GS, Li NS, Sudhof TC, Arac D. Ulevitch RJ, Green DR, Nicholson DW. 2006. Enhanced bacterial
2015. Structural basis of latrophilin-FLRT-UNC5 interaction in cell clearance and sepsis resistance in caspase-12-deficient mice.
adhesion. Structure 23(9):1678–1691. Nature 440(7087):1064–1068.
Macholdt E, Lede V, Barbieri C, Mpoloka SW, Chen H, Slatkin M, Saleh M, Vaillancourt JP, Graham RK, Huyck M, Srinivasula SM, Alnemri
Pakendorf B, Stoneking M. 2014. Tracing pastoralist migrations to ES, Steinberg MH, Nolan V, Baldwin CT, Hotchkiss RS, et al. 2004.
southern Africa with lactase persistence alleles. Curr Biol. Differential modulation of endotoxin responsiveness by human
24(8):875–879. caspase-12 polymorphisms. Nature 429(6987):75–79.
Mallick S, Li H, Lipson M, Mathieson I, Gymrek M, Racimo F, Zhao M, Scerri EML, Chikhi L, Thomas MG. 2019. Beyond multiregional and sim-
Downloaded from https://academic.oup.com/mbe/article/37/10/2944/5874945 by Uppsala Universitetsbibliotek user on 26 April 2021
Chennagiri N, Nordenfelt S, Tandon A, et al. 2016. The Simons ple out-of-Africa models of human evolution. Nat Ecol Evol.
Genome Diversity Project: 300 genomes from 142 diverse popula- 3(10):1370–1372.
tions. Nature 538(7624):201–206. Scerri EML, Thomas MG, Manica A, Gunz P, Stock JT, Stringer C, Grove
Mazet O, Rodriguez W, Grusea S, Boitard S, Chikhi L. 2016. On the M, Groucutt HS, Timmermann A, Rightmire GP, et al. 2018. Did our
importance of being structured: instantaneous coalescence rates species evolve in subdivided populations across Africa, and why does
and human evolution–lessons for ancestral population size infer- it matter? Trends Ecol Evol (Amst). 33(8):582–594.
ence? Heredity (Edinb) 116(4):362–371. Schiffels S, Durbin R. 2014. Inferring human population size and separa-
Meyer M, Kircher M, Gansauge MT, Li H, Racimo F, Mallick S, Schraiber tion history from multiple genome sequences. Nat Genet.
JG, Jay F, Prufer K, de Filippo C, et al. 2012. A high-coverage genome 46(8):919–925.
sequence from an archaic Denisovan individual. Science Schlebusch C. 2010. Issues raised by use of ethnic-group names in ge-
338(6104):222–226. nome study. Nature 464(7288):487; author reply 487.
Naidoo T, Xu J, Vicente M, Malmström H, Soodyall H, Jakobsson M, Schlebusch CM, Jakobsson M. 2018. Tales of human migration, admix-
Schlebusch CM. Forthcoming 2020. Y-chromosome variation in ture, and selection in Africa. Annu Rev Genomics Hum Genet .
southern African Khoe-San populations based on whole genome 19(1):405–428.
sequences. Genome Biol Evol. doi:10.1093/gbe/evaa098. Schlebusch CM, Malmstrom H, Gunther T, Sjodin P, Coutinho A, Edlund
Nielsen R, Akey JM, Jakobsson M, Pritchard JK, Tishkoff S, Willerslev E. H, Munters AR, Vicente M, Steyn M, Soodyall H, et al. 2017. Southern
2017. Tracing the peopling of the world through genomics. Nature African ancient genomes estimate modern human divergence to
541(7637):302–310. 350,000 to 260,000 years ago. Science 358(6363):652–655.
Owers KA, Sjodin P, Schlebusch CM, Skoglund P, Soodyall H, Schlebusch CM, Skoglund P, Sjodin P, Gattepaille LM, Hernandez D, Jay F,
Jakobsson M. 2017. Adaptation to infectious disease exposure in Li S, De Jongh M, Singleton A, Blum MG, et al. 2012. Genomic
indigenous Southern African populations. Proc Biol Sci. variation in seven Khoe-San groups reveals adaptation and complex
284:20170226. African history. Science 338(6105):374–379.
Pickrell JK, Coop G, Novembre J, Kudaravalli S, Li JZ, Absher D, Srinivasan Scholz CA, Cohen AS, Johnson TC, King J, Talbot MR, Brown ET. 2011.
BS, Barsh GS, Myers RM, Feldman MW, et al. 2009. Signals of recent Scientific drilling in the Great Rift Valley: the 2005 Lake Malawi
positive selection in a worldwide sample of human populations. Scientific Drilling Project—an overview of the past 145,000 years
Genome Res. 19(5):826–837. of climate variability in Southern Hemisphere East Africa.
Pickrell JK, Patterson N, Barbieri C, Berthold F, Gerlach L, Palaeogeogr Palaeoclimatol Palaeoecol. 303(1–4):3–19.
Guldemann T, Kure B, Mpoloka SW, Nakagawa H, Naumann Schuster SC, Miller W, Ratan A, Tomsho LP, Giardine B, Kasson LR, Harris
C, et al. 2012. The genetic prehistory of southern Africa. Nat RS, Petersen DC, Zhao F, Qi J, et al. 2010. Complete Khoisan and
Commun. 3(1):1143. Bantu genomes from southern Africa. Nature 463(7283):943–947.
Pickrell JK, Patterson N, Loh PR, Lipson M, Berger B, Stoneking M, Skoglund P, Thompson JC, Prendergast ME, Mittnik A, Sirak K, Hajdinjak
Pakendorf B, Reich D. 2014. Ancient west Eurasian ancestry in M, Salie T, Rohland N, Mallick S, Peltzer A, et al. 2017. Reconstructing
southern and eastern Africa. Proc Natl Acad Sci U S A. prehistoric African population structure. Cell 171(1):59–71.e21.
111(7):2632–2637. Sugden LA, Atkinson EG, Fischer AP, Rong S, Henn BM, Ramachandran
Prüfer K, Racimo F, Patterson N, Jay F, Sankararaman S, Sawyer S, Heinze S. 2018. Localization of adaptive variants in human genomes using
A, Renaud G, Sudmant PH, de Filippo C, et al. 2014. The complete averaged one-dependence estimation. Nat Commun. 9(1):703.
genome sequence of a Neanderthal from the Altai Mountains. Turner WC, Imologhome P, Havarua Z, Kaaya GP, Mfune JKE, Mpofu
Nature 505(7481):43–49. IDT, Getz WM. 2013. Soil ingestion, nutrition and the seasonality of
Racimo F. 2016. Testing for ancient selection using cross-population anthrax in herbivores of Etosha National Park. Ecosphere 4(1):art13.
allele frequency differentiation. Genetics 202(2):733–750. Veeramah KR, Thomas MG, Weale ME, Zeitlyn D, Tarekegn A, Bekele E,
Racimo F, Kuhlwilm M, Slatkin M. 2014. A test for ancient selective Mendell NR, Shephard EA, Bradman N, Phillips IR. 2008. The poten-
sweeps and an application to candidate sites in modern humans. tially deleterious functional variant flavin-containing monooxyge-
Mol Biol Evol. 31(12):3344–3358. nase 2*1 is at high frequency throughout sub-Saharan Africa.
Raghavan M, Skoglund P, Graf KE, Metspalu M, Albrechtsen A, Moltke I, Pharmacogenet Genomics. 18(10):877–886.
Rasmussen S, Stafford TW Jr, Orlando L, Metspalu E, et al. 2014. Veeramah KR, Wegmann D, Woerner A, Mendez FL, Watkins JC, Destro-
Upper Palaeolithic Siberian genome reveals dual ancestry of Bisol G, Soodyall H, Louie L, Hammer MF. 2012. An early divergence
Native Americans. Nature 505(7481):87–91. of KhoeSan ancestors from those of other modern humans is sup-
Ramachandran S, Deshpande O, Roseman CC, Rosenberg NA, Feldman ported by an ABC-based analysis of autosomal resequencing data.
MW, Cavalli-Sforza LL. 2005. Support from the relationship of ge- Mol Biol Evol. 29(2):617–630.
netic and geographic distance in human populations for a serial Vicente M, Jakobsson M, Ebbesen P, Schlebusch CM. 2019. Genetic af-
founder effect originating in Africa. Proc Natl Acad Sci U S A. finities among Southern Africa hunter-gatherers and the impact of
102(44):15942–15947. admixing farmer and herder populations. Mol Biol Evol.
Sabeti PC, Varilly P, Fry B, Lohmueller J, Hostetter E, Cotsapas C, Xie X, 36(9):1849–1861.
Byrne EH, McCarroll SA, Gaudet R; The International HapMap Voight BF, Kudaravalli S, Wen X, Pritchard JK. 2006. A map of recent
Consortium, et al. 2007. Genome-wide detection and positive selection in the human genome. PLoS Biol. 4(3):e72.
2954You can also read