Identifying threshold responses of Australian dryland rivers to future hydroclimatic change
←
→
Page content transcription
If your browser does not render page correctly, please read the page content below
www.nature.com/scientificreports

            OPEN           Identifying threshold responses of
                           Australian dryland rivers to future
                           hydroclimatic change
                                            1*                   1                2                    1                        3
                           Z. T. Larkin          , T. J. Ralph       , S. Tooth       , K. A. Fryirs       & A. J. R. Carthey
                           Rivers provide crucial ecosystem services in water-stressed drylands. Australian dryland rivers are
                           geomorphologically diverse, ranging from through-going, single channels to discontinuous, multi-
                           channelled systems, yet we have limited understanding of their sensitivity to future hydroclimatic
                           changes. Here, we characterise for the first time the geomorphology of 29 dryland rivers with
                           catchments across a humid to arid gradient covering >1,800,000 km2 of continental eastern and central
                           Australia. Statistical separation of five specific dominantly alluvial river types and quantification of
                           their present-day catchment hydroclimates enables identification of potential thresholds of change.
                           Projected aridity increases across eastern Australia by 2070 (RCP4.5) will result in ~80% of the dryland
                           rivers crossing a threshold from one type to another, manifesting in major geomorphological changes.
                           Dramatic cases will see currently through-going rivers (e.g. Murrumbidgee, Macintyre) experience step
                           changes towards greater discontinuity, characterised by pronounced downstream declines in channel
                           size and local termination. Expanding our approach to include other river styles (e.g. mixed bedrock-
                           alluvial) would allow similar analyses of dryland rivers globally where hydroclimate is an important driver
                           of change. Early identification of dryland river responses to future hydroclimatic change has far-reaching
                           implications for the ~2 billion people that live in drylands and rely on riverine ecosystem services.

                           Rivers are lifelines in climatically variable and water-stressed drylands, the dry subhumid through hyperarid
                           environments that cover 40–50% of the Earth’s land surface and host ~28% of the world’s population1,2. Dryland
                           rivers are fundamentally important for human populations, providing a plethora of provisioning, regulating, sup-
                           porting and cultural ecosystem services1,3. Yet dryland rivers exist in marginal environments and are threatened
                           by declines in water availability due to the impacts of climate change (e.g. decreased rainfall, increased temper-
                           ature and evapotranspiration, and greater climatic variability) and other human activities (e.g. river regulation,
                           flow diversion and abstraction, and land use change)4–6. Rivers are not static conduits of water, sediment and
                           nutrients, but adjust dynamically to a suite of internal and external drivers. Among various external drivers (e.g.
                           tectonic activity, sea level fluctuations, climate), research has shown that late Quaternary hydroclimatic changes
                           have driven substantial geomorphological changes to many dryland rivers globally, including during the mid to
                           late Holocene [e.g.7–10]. Indeed, in tectonically stable settings such as continental Australia, and in reaches where
                           rivers are free from significant bedrock influence, hydroclimatic changes are the principal driver of river response
                           and resulting channel-floodplain geomorphology. To date, however, assessment of the potential likelihood and
                           pathways of hydrological and geomorphological changes in dryland rivers due to future hydroclimate change
                           have not been considered in any rigorous or systematic fashion11,12. Analyses of future changes have tended to
                           focus solely on dryland hydrology, such as surface water availability or river flow regimes [e.g.5,13–15], rather than
                           on the implications of these changes for river response and physical structure (e.g. number of channels, sinuosity,
                           lateral stability, landform assemblages). This is a critical knowledge gap, as dryland river geomorphology pro-
                           vides the physical template atop which complex ecosystems and anthropogenic land uses operate and intersect16,
                           thereby defining the range and quality of ecosystem service delivery.
                               In the Australian drylands, a continuum of dominantly alluvial river types extends from relatively high-energy
                           rivers that maintain a single, continuous channel downstream, to lower energy, declining or discontinuous
                           rivers that undergo various forms of channel breakdown, including disintegration into networks of multiple,
                           smaller channels and/or termination on unchannelled plains termed floodouts [cf.17 Fig. 1]. In some instances,

                           1
                            Department of Earth and Environmental Sciences, Macquarie University, North Ryde, 2109, NSW, Australia.
                           2
                            Department of Geography and Earth Sciences, Aberystwyth University, Aberystwyth, SY23 3DB, UK. 3Department
                           of Biological Sciences, Macquarie University, North Ryde, 2109, NSW, Australia. *email: zacchary.larkin@mq.edu.au

Scientific Reports |   (2020) 10:6653 | https://doi.org/10.1038/s41598-020-63622-3                                                             1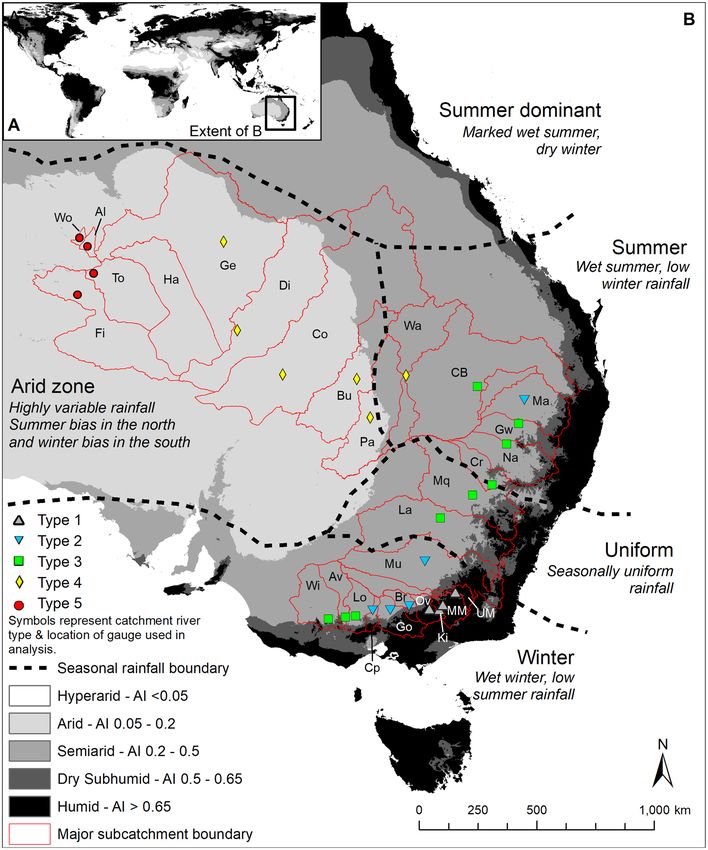
www.nature.com/scientificreports/ www.nature.com/scientificreports
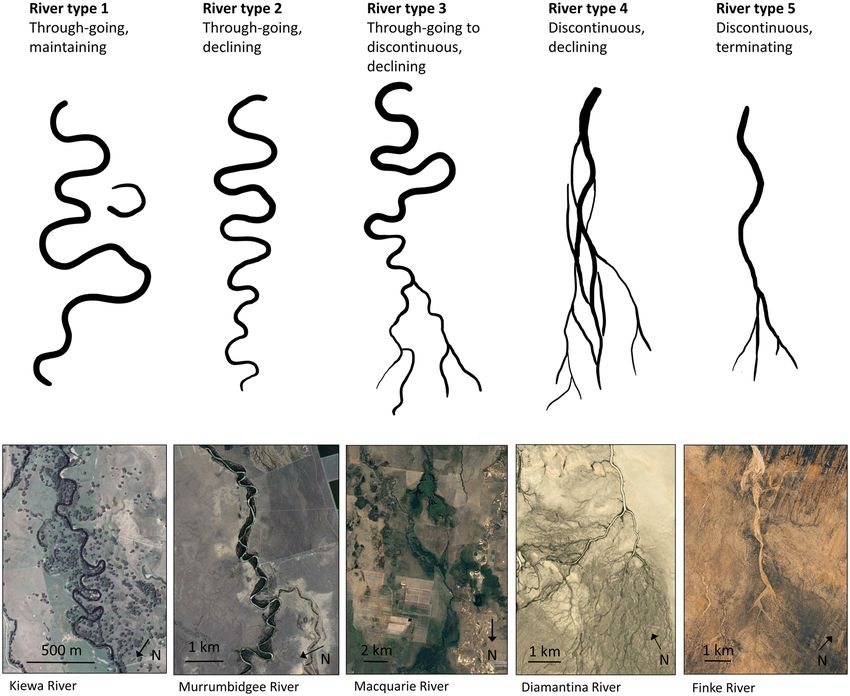
Figure 1. Schematic of the five dryland river types defined in this study, with satellite images of typical
examples from various Australian rivers (Satellite imagery data: Google Earth, Image © 2017 Digital Globe,
Image © 2017 CNES/Airbus). Flow direction is from top to bottom in all diagrams and images.
channel breakdown is associated with extensive floodplain wetlands [e.g.18] that provide ecosystem services in
these water-stressed settings (e.g. wildlife habitat, water filtration and supply). Globally, other dryland river types
occur, including dominantly alluvial (e.g. braided), dominantly bedrock (e.g. incised or ingrown meanders), and
mixed bedrock-alluvial (e.g. anabranching/anastomosing) types19,20. In this study, these river types have not been
considered, as Australian dryland rivers are not braided and are dominantly alluvial in their middle and lower
reaches. Previous research has suggested that regional continua of dryland river types may be related to hydro-
climatic gradients, with greater aridity leading to a greater propensity for channel breakdown21,22. To refine these
concepts and identify thresholds of change relevant for Australian dryland rivers, we characterise the hydrol-
ogy and geomorphology of 29 rivers draining >1,800,000 km2 of continental eastern and central Australia, and
establish the hydroclimatic conditions under which different river types persist. First, we categorise Australian
dryland rivers into five types using a suite of geomorphological characteristics. Second, we establish the distinct
hydrological characteristics of these river types using streamflow gauge data and correlate these characteristics
with catchment aridity. Third, by establishing robust and significant relationships between modern dryland river
types, hydrology and catchment aridity, we define envelopes of mean catchment aridity index (AI) values for each
river type. Fourth, we use downscaled global climate model projections to project future hydroclimatic changes
and associated geomorphological responses. Where projections suggest that a catchment will shift outside of the
envelope of aridity defined by modern climatic data, we anticipate the trajectory of geomorphological change for
the trunk river in that catchment and identify the geomorphological thresholds that may be crossed. With further
refinement to include a wider range of dryland river types (e.g. mixed bedrock-alluvial types), this approach will
provide a quantitatively-tested method for broader, continental and global studies of dryland river sensitivity to
hydroclimatic changes that may be exacerbated or compounded by other human activities, such as future river
regulation, flow diversion and abstraction, and land use change. Early identification of dryland river responses to
global hydroclimatic changes will have far-reaching implications for the management of dryland rivers and the
maintenance of dryland river ecosystem service delivery.
Diversity of Australian dryland rivers
Much of continental eastern Australia is characterised by large catchments that host perennial, intermittent or
ephemeral rivers and associated wetlands. These catchments are located in a post orogenic, intracratonic setting,
where denudation rates and river sediment loads are low compared to global averages. Beyond the headwaters,
many rivers follow lengthy courses across piedmonts and lowland plains where bedrock outcrop is less common
Scientific Reports | (2020) 10:6653 | https://doi.org/10.1038/s41598-020-63622-3 2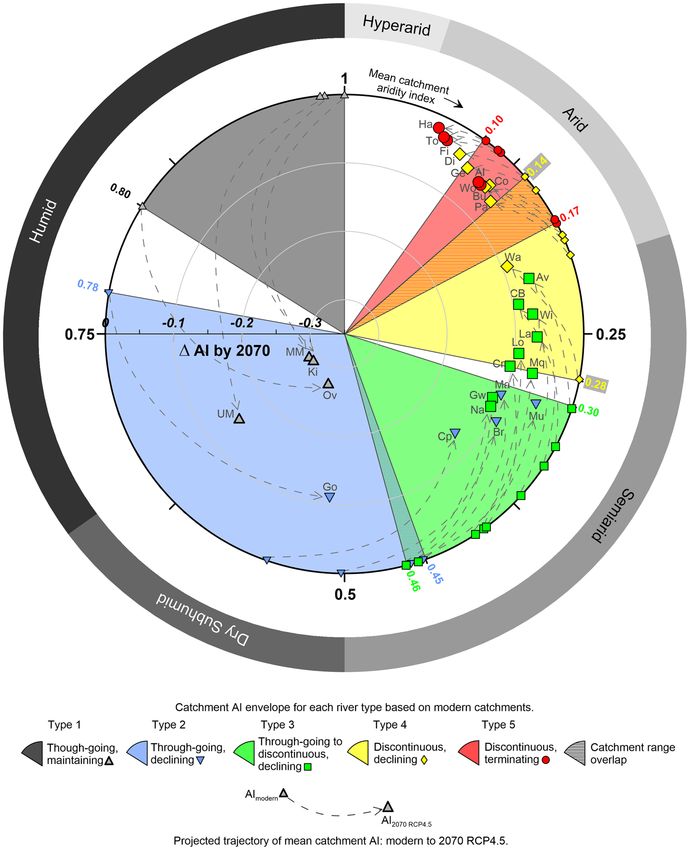
www.nature.com/scientificreports/                                                                         www.nature.com/scientificreports

                                                        Dominant river                                         Wetlands (presence/
                          Channel continuity            planform         Dominant river pattern                absence, type)            River type
                                                                                                                                         Type 1 – through-going,
                                          Maintaining                                                          permanent wetlands
                                                                                                                                         maintaining
                                                                         meandering or anabranching/
                          Through-going
                                                                         anastomosing                                                    Type 2 – through-going,
                                                        sinuous
                                                                                                               permanent and             declining
                                                                                                               intermittent wetlands     Type 3 – through-going to
                                          Declining
                                                                                                                                         discontinuous, declining
                                                                         meandering/straight, anabranching/
                                                                         anastomosing, or distributary         intermittent and          Type 4 – discontinuous,
                                                                                                               ephemeral wetlands        declining
                          Discontinuous
                                                        non-sinuous      straight, anabranching/
                                                                         anastomosing, or distributary, with                             Type 5 – discontinuous,
                                          Terminating                                                          no significant wetlands
                                                                         trunk channel terminating in a                                  terminating
                                                                         floodout (unchannelled plain)

                           Table 1. Geomorphological measures used to differentiate the five dryland river types.

                           and alluvial river styles dominate. Owing to limited tributary inputs and declining valley slopes, many rivers
                           undergo downstream decreases in discharge and stream power that lead to channel size declines and, in some
                           cases, channel breakdown23. Some of these rivers are regulated to allow water storage, abstractions and altered
                           seasonal flows, but downstream decreases in discharge and stream power, and channel size declines and break-
                           down can occur despite regulation23. While Australian dryland rivers display a range of dominantly alluvial styles
                           (e.g. single channel versus multiple channel), we have defined five river types that are widely represented in
                           the middle to lower reaches (Fig. 1; Supplementary Fig. S1). Two overarching categories are recognised: rivers
                           with through-going channels to their catchment outlet (e.g. a lake or another river) and rivers with discontinu-
                           ous channels (e.g. characterised by zones where channels lose definition or where channels terminate). Further
                           differentiation is achieved by defining dominant river planform (sinuous, non-sinuous) and pattern (meander-
                           ing, straight, anabranching/anastomosing, distributary), the nature of downstream decline in channel size after
                           leaving valley (bedrock) confinement (maintaining, declining, or terminating), and the presence/absence and
                           type of wetlands (see Methods, Table 1 and Supplementary Fig. S1). The five types are: Type 1 – through-going,
                           sinuous channels that maintain size downstream; Type 2 – through-going, sinuous channels that decline in size
                           downstream; Type 3 – through-going to discontinuous, sinuous channels that decline in size downstream; Type
                           4 – discontinuous, non-sinuous channels that decline in size downstream; Type 5 – discontinuous, non-sinuous
                           channels that decline in size downstream and terminate (e.g. at a floodout) (Fig. 1).

                           Climatic gradient in continental eastern Australia
                           Approximately 78% of the Australian continent is classified as dryland24, and across the eastern half of the con-
                           tinent, there is a pronounced aridity gradient from humid (AI > 0.65), through dry subhumid (AI 0.65–0.5)
                           and semiarid (AI 0.5–0.2), to arid (AI 0.2–0.05) (Fig. 2). Pronounced periods of above- and below-average rain-
                           fall combine to also make Australian hydroclimates (including river flow regimes) some of the most variable
                           in the world25–29, a characteristic that persists despite the presence of dams and associated flow regulation in
                           many catchments. In this tectonically stable setting, and especially in the middle to lower reaches where rivers
                           are largely free from bedrock influence, these hydroclimatic variations are the key driver of river response and
                           resulting channel-floodplain geomorphology. The relationship between climate, hydrology, and geomorphology
                           is complex but may be expressed through various metrics including mean and peak runoff depth, flow variability,
                           and stream power. Stream power is a function of river discharge and slope, and represents the energy exerted
                           by water on the bed and banks of a river30. It is widely used as a quantitative measure of the potential for flow to
                           initiate channel adjustment through erosion or deposition31,32.

                           Hydroclimatic controls on Australian dryland river geomorphology
                           To examine the links between hydroclimate and geomorphology, the five river types (Fig. 1; Table 1) have been
                           subjected to one-way analysis of variance (ANOVA; Fig. 3) and a pairwise analysis of similarities (ANOSIM) of
                           key variables (Fig. 4; Table 2; Supplementary Table S1). Mean catchment AI is the variable that best defines sig-
                           nificant differences between river types (except for Types 4 and 5; see Fig. 3I). Through-going, maintaining rivers
                           (Type 1) occur in catchments where ~65–87% of the total catchment area is classed as humid and mean catch-
                           ment AI is 0.80–1.0 (Fig. 4; Supplementary Fig. S2). Through-going, declining rivers (Type 2) occur in catchments
                           where ~7–48% of total catchment area is classed as humid and mean catchment AI is 0.45–0.78. Through-going
                           to discontinuous, declining rivers (Type 3) occur in catchments where ~0.2–8% of the total catchment area is
                           classed as humid and mean catchment AI is 0.30–0.46. Discontinuous, declining rivers (Type 4) have no catch-
                           ment area that is humid or even dry subhumid and mean catchment AI is 0.14–0.28. Discontinuous, terminating
                           rivers (Type 5) occur in catchments that are typically 100% arid and mean catchment AI is 0.10–0.17 (Fig. 4;
                           Supplementary Fig. S2).
                               Links between climate, catchment aridity, and key hydrological variables have been established in previ-
                           ous research, including how the magnitude and variability of runoff and streamflow in eastern Australian riv-
                           ers is strongly modulated by climatic modes (e.g. El Niño-Southern Oscillation (ENSO), Interdecadal Pacific
                           Oscillation (IPO) and the Southern Annular Mode (SAM))25–29. While these inter- and multi-decadal hydrocli-
                           matic relationships are relatively well understood, the distinct trends and clusters that emerge from our analysis
                           demonstrate, for the first time, the significant overarching control that dominant hydroclimate exerts on the

Scientific Reports |   (2020) 10:6653 | https://doi.org/10.1038/s41598-020-63622-3                                                                                 3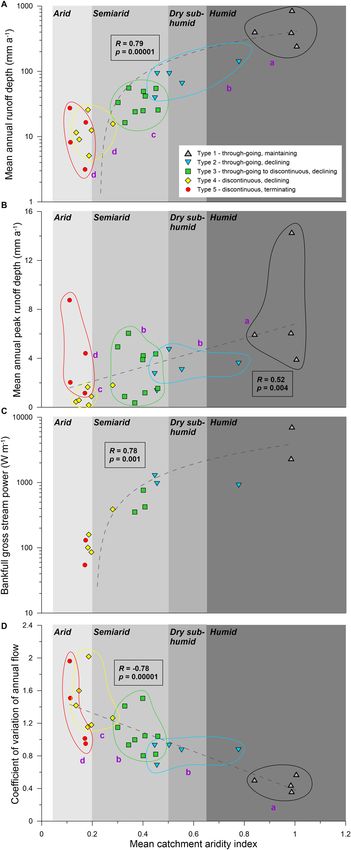
www.nature.com/scientificreports/                                                              www.nature.com/scientificreports

                           Figure 2. Modern, global Aridity Index [AI] (defined as mean annual precipitation [PPT]/annual potential
                           evapotranspiration [PET]) for (A) the world and (B) central and eastern Australia. AI data were sourced from
                           a publicly available dataset57. Drylands have AI < 0.6556. Currently, there are no hyperarid regions on the
                           Australian continent. In B), seasonal rainfall boundaries are marked by dashed black lines and are adapted from
                           the Australian Bureau of Meteorology’s climate classification data. Stream gauges were selected nearest to the
                           end of bedrock confinement in each catchment and symbols represent different river types (see Fig. 1). Study
                           catchments are labelled as follows: Ki – Kiewa, MM – Mitta Mitta, Ov – Ovens and UM – Upper Murray (Type
                           1; grey triangles); Br – Broken, Cp – Campaspe, Go – Goulburn, Ma – Macintyre and Mu – Murrumbidgee
                           (Type 2; inverted blue triangles); Av – Avoca, CB – Condamine-Balonne, Cr – Castlereagh, Gw – Gwydir, La –
                           Lachlan, Lo – Loddon, Mq – Macquarie, Na – Namoi and Wi – Wimmera (Type 3; green squares); Bu – Bulloo,
                           Co – Cooper Creek, Di – Diamantina, Ge – Georgina, Pa – Paroo and Wa – Warrego (Type 4; yellow diamonds);
                           Al – Allungra Creek, Fi – Finke, Ha – Hay, To – Todd and Wo – Woodforde (Type 5; red circles). See Table 3
                           for a list of all rivers. Note that there is no useable gauge in the Hay catchment. Map created in ArcMap v.10.2
                           software (https://desktop.arcgis.com/en/arcmap/).

                           geomorphology of Australian dryland rivers. There is a strong and significant positive correlation between mean
                           catchment AI and mean annual runoff depth (Pearson’s R = 0.79, p = 0.00001), and all river types are significantly
                           different except for Types 4 and 5 (pairwise ANOSIM, p < 0.05; Fig. 5A). There is a significant positive correlation

Scientific Reports |   (2020) 10:6653 | https://doi.org/10.1038/s41598-020-63622-3                                                           4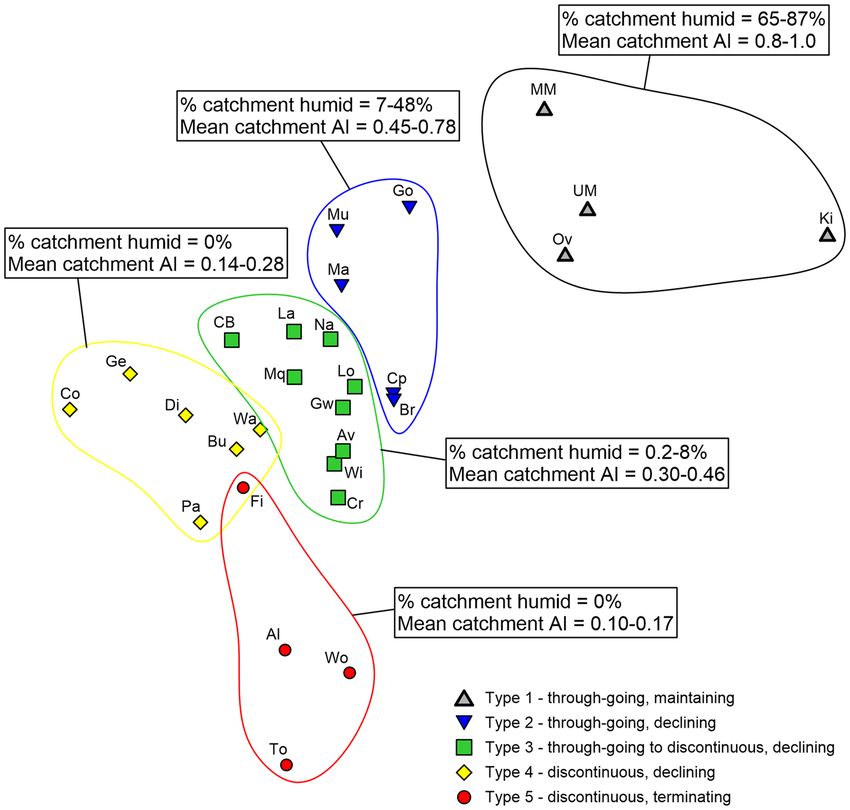
www.nature.com/scientificreports/                                                                           www.nature.com/scientificreports

                            Variable                                                     Units
                            Catchment area                                               km2
                            Average slope of alluvial plain                              m m−1
                            Average sinuosity (channel distance/ valley distance)        Dimensionless
                            Proportional net change in channel width 50 km               (%/50 km downstream of
                            downstream of confinement                                    bedrock confinement)
                            Mean annual runoff depth                                     mm a−1
                            Mean annual peak runoff depth                                mm a−1
                            Coefficient of variability of annual flow (std. dev./mean)   %
                            Mean annual gross stream power                               W m-1
                            *Bankfull gross stream power                                 W m-1
                            Mean catchment AI (mean annual precipitation/potential
                                                                                         Dimensionless
                            annual evapotranspiration)
                            Median catchment AI (mean annual precipitation/
                                                                                         Dimensionless
                            potential annual evapotranspiration)

                           Table 2. Variables used in ANOSIM and their units. Geomorphological measures were calculated using Google
                           Earth satellite imagery and a 30 m SRTM DEM. (Note: * not used in statistical analysis).

                           between mean catchment AI and mean peak annual runoff depth (Pearson’s R = 0.59, p = 0.004), and all river
                           types are significantly different except for Types 2 and 3 (pairwise ANOSIM, p < 0.05; Fig. 5B). There is a strong
                           and significant positive correlation between mean catchment AI and bankfull gross stream power (Pearson’s
                           R = 0.78, p = 0.001; Fig. 5C). There is a strong and significant negative correlation between mean catchment AI
                           and coefficient of annual flow (CVaf; Pearson’s R = −0.78, p = 0.00001), and all river types are significantly differ-
                           ent except for Types 2 and 3 (pairwise ANOSIM, p < 0.05; Fig. 5D).
                               Overall, catchments with a mean catchment AI classed as humid or dry subhumid have greater mean annual
                           runoff depth (>40 mm a−1) and stream power (>900 W m−1), lower flow variability (CVaf < 0.9), and support
                           through-going river types (most Types 1 and 2). Catchments with a mean catchment AI classed as semiarid or
                           arid have lower mean annual runoff depth (
www.nature.com/scientificreports/ www.nature.com/scientificreports
Figure 3. Comparison of the five river types based on 11 geomorphological and hydroclimatic variables. Plots
show mean plus error bars representing one standard deviation (Type 1, n = 4; Type 2, n = 5; Type 3, n = 9;
Type 4, n = 6; Type 5, n = 4). One-way ANOVAs were performed to identify statistically significant differences
between river types for each variable. Points sharing the same letter are not significantly different according to
Tukey’s honest significant difference (HSD) test. (A) No systematic trend between floodplain slope and river
type. (B) No systematic trend between catchment area and river type, although Types 1 and 2 tend to have
smaller catchments. (C) Significant differences between sinuosity and river type, with Types 1, 2, and 3 having
significantly higher sinuosity than Types 4 and 5. (D) Negative correlation between rate of downstream change
in channel size and river type. (E) Negative correlation between mean annual runoff depth and river type,
although the only significant difference is between Type 1 and the other types. (F) Positive correlation between
CVaf and river type, albeit with substantial overlap between types. (G) Weak negative correlation between mean
annual peak runoff depth and river type. (H) Significant differences between river types explained by median
Scientific Reports | (2020) 10:6653 | https://doi.org/10.1038/s41598-020-63622-3 6www.nature.com/scientificreports/ www.nature.com/scientificreports
catchment Aridity Index (AI), except for Types 4 and 5. (I) Significant differences between river types explained
by mean catchment AI. Mean catchment aridity is the best variable to differentiate river types, except for Types
4 and 5. (J) Negative correlation between mean annual gross stream power (measured at gauge nearest to the
end of bedrock confinement) and river types. (K) Negative correlation between bankfull gross stream power
(measured at gauge nearest to the end of bedrock confinement) and river type, although there are not enough
gauge data available to perform one-way ANOVAs. (L) Average proportion of catchment in each climate zone
for each of the five river types, demonstrating the progressive increase in the overall level of catchment aridity
from Type 1 to Type 5.
(Fig. 5), and different hydroclimatic conditions are associated with distinct river types (Figs. 3, 4 and 5), we can
assess how Australian dryland rivers may respond to projected hydroclimatic changes related to changing aridity
indices. Given the magnitude of rainfall reductions and evapotranspiration increases projected for much of the
Australian continent under RCP4.5 (Supplementary Fig. S3), many catchments will likely experience substantial
aridification (Fig. 6; Supplementary Figs. S2 and S3). Particularly sensitive rivers are those that are close to a
threshold of change between different river types and that therefore may be subject to significant geomorpholog-
ical adjustments under these future hydroclimatic conditions.
Indeed, of the 29 rivers analysed in this study, 23 (~80%) are projected to cross a threshold to another river
type due to future catchment aridification and associated changes in hydrological conditions under RCP4.5
(Fig. 6). The largest magnitude changes are likely to affect the currently through-going, maintaining rivers (Type
1) with headwaters in the Australian southeastern highlands. These highlands are projected to have some of the
most severe reductions in rainfall (see Supplementary Fig. S3), likely as a result of a projected increase in the
prevalence of positive phases of the Southern Annular Mode, which will shift the average track of the southern
hemisphere westerlies farther south and reduce winter rainfall over southern Australia41. All four Type 1 rivers
are projected to change to through-going, declining rivers (Type 2). Reduced runoff depth and stream power
will likely lead to sediment deposition and downstream declines in channel size (Fig. 6). Although the Kiewa,
Mitta Mitta, Upper Murray and Ovens rivers (Type 1) occupy only a small proportion of the Murray-Darling
Basin (~3.8%), they currently supply a disproportionately large amount of discharge (>33%) to parts of the lower
catchment. Therefore, reductions in mean annual runoff depth and downstream declines in flow will have major
impacts for water users and ecosystem services in the southern Murray-Darling Basin, which is one of Australia’s
most important agricultural regions. While we have not modelled the effects of future water storage, flow diver-
sions and abstractions, and land use in these catchments, these other forms of human disturbance will likely
exacerbate or compound the effects of climate change by further altering flow regimes in already highly pressured,
regulated systems6.
The most dramatic change in river morphology is from a through-going, declining river (Type 2) to a more
discontinuous river (Types 3 or 4). Under RCP4.5, the currently through-going, declining Campaspe, Broken,
Macintyre, and Murrumbidgee rivers (Type 2) are projected to have significant increases in catchment aridity,
leading to reduced discharges and stream powers and more highly variable flow regimes, thereby becoming dis-
continuous rivers more characterised by channel breakdown and unchannelised wetlands (Type 3). Such dramatic
changes in river structure and function will decrease hydrological and sediment connectivity, with profound,
long-lasting impacts on water and sediment distribution, ecosystem dynamics, and ecosystem services in rivers
and floodplains that are currently heavily used for irrigated agriculture and grazing. These changes are potentially
irreversible and will increase the likelihood of ecosystem collapse in these marginal environments [c.f.42]. This
will likely exacerbate existing high tensions surrounding water use and storage in inland Australia, particularly
in the Murray-Darling Basin where ongoing drought (2018–2020) and water resource planning changes have
had severe ecological impacts, perhaps providing an insight into the future facing many of Australia’s dryland
rivers43,44.
All of the currently through-going to discontinuous (Type 3) rivers except the Gwydir and Namoi are pro-
jected to become Type 4 rivers with discontinuous, declining channels (Fig. 6), likely inducing changes to many
of the semi-permanent, in-channel waterholes that currently characterise many river reaches19. Catchment arid-
ification may also impact inundation regimes in semi-permanent and intermittent floodplain wetlands associ-
ated with these rivers, likely inducing a change to more ephemeral floodplain wetlands. Potential reductions in
discharge and flow frequency will be particularly profound for wetlands of national and international ecological
importance (e.g. Ramsar wetlands), such as the Macquarie Marshes, Gwydir wetlands, Narran Lake wetlands, and
the Great Cumbung Swamp on the lower Lachlan River. Except for the Warrego River (Fig. 6), further declines
in flow may even result in many Type 4 rivers transitioning into discontinuous, terminating rivers (Type 5) with
few or no significant wetlands.
Discontinuous, terminating rivers (Type 5) are projected to experience even more arid hydroclimatic con-
ditions, most likely with even greater flow variability than at present. While there are currently no Australian
dryland rivers that are characterised by the levels of aridity projected for the Hay, Todd, and Finke catchments
(Fig. 6), increased flow variability may impact severely on the health of the well-developed riparian vegetation
assemblages that are such a critical influence on channel processes and forms in these rivers19. There are no
hyperarid regions (AI < 0.05) currently on the Australian continent, but reference to other hyperarid areas
around the world (e.g. central Sahara Desert), may provide an indication of what might be expected for the small
regions of Australia projected to experience hyperarid conditions by the second half of this century (e.g. lack of
bank-stabilising vegetation; Supplementary Fig. S3).
In summary, greater aridification of the Australian continent is projected for the second half of this century
under both moderate (RCP4.5) and business-as-usual (RCP8.5) climate change scenarios. The influence of this
Scientific Reports | (2020) 10:6653 | https://doi.org/10.1038/s41598-020-63622-3 7www.nature.com/scientificreports/ www.nature.com/scientificreports
River Gauge Period of Number of
River code Gauge name number record years
Mitta Mitta MM Tallandoon 401204 1934–2017 83
Kiewa Ki Mongan’s Bridge 402203 1955–2017 62
Upper Murray UM Jingellic 401201 1900–2017 117
Ovens Ov Myrtleford 403210 1961–2017 56
Goulburn Go Murchison 405200 1900–2017 117
Campaspe Cp Barnadown 406201 1978–2017 39
Broken Br Casey’s Weir 404242 1972–2017 45
Murrumbidgee Mu Narrandera 410005 1914–2017 103
Macintyre Ma Boggabilla 416002 1900–2017 117
Lachlan La Condobolin 412006 1900–2017 117
Macquarie Mq Baroona 421127 1986–2017 31
Gwydir Gw Pallamallawa 418001 1900–2017 117
Namoi Na Mollee 419039 1965–2017 52
Loddon Lo Laanecoorie 407203 1900–2017 117
Wimmera Wi Eversley 415207 1963–2017 54
Condamine-Balonne CB St George 422201F 1971–2017 46
Avoca Av Archdale Junction 408206 1987–2017 30
Castlereagh Cr Mendooran 420004 1953–2010 57
Warrego Wa Wyandra 423206A 1967–2017 50
Paroo Pa Willara Crossing 424002 1975–2017 42
Cooper Creek Co Nappa Merrie 003103A 1965–2017 52
Bulloo Bu Autumnvale 011202A 1967–2017 50
Diamantina Di Birdsville A0020101 1966–2017 51
Georgina Ge Roxborough Downs 001203A 1967–2017 50
Finke Fi Finke RS Crossing G0050116 2004–2017 13
Todd To Heavitree Gap G0060126 1973–2017 44
Woodforde Wo Arden Soak G0280010 1975–2017 42
Allungra Creek Al Allungra Waterhole G0280004 2001–2017 16
Table 3. Rivers with stream gauges (n = 28) used for hydrological analysis in this study (see Fig. 2). The Hay
River does not have a suitable gauge.
enhanced aridification on the hydrology, physical structure, and biogeomorphic function of Australian dryland
rivers is likely to be dramatic but, until now, has not been considered in any rigorous or systematic manner. Our
approach is a quantitively-tested form of ergodic reasoning with powerful application for understanding river
response to future hydroclimate change, not only across continental Australia but also potentially in other dry-
lands worldwide, as discussed below.
Developing the approach to assess river response in drylands globally
Our findings demonstrate that even under a relatively conservative future emissions scenario (RCP4.5), projected
aridification and associated changes to hydrological conditions across continental eastern and central Australia
are likely to lead to significant geomorphological thresholds being crossed this century. The vast majority of rivers
included in this study were highly sensitive to hydroclimatic change.
While Australia possesses a number of distinctive river styles, none of these styles are necessarily unique to the
continent [e.g.19]. Hence, with further development, the novel approach outlined in this study potentially could
be used to assess the geomorphic sensitivity of dryland rivers globally, especially for dominantly alluvial rivers
where hydroclimatic factors are the key drivers of river response. Many parts of dryland Africa, South and North
America, and central and western Asia are generally projected to experience declines in surface water availability
and river flow in coming decades6,13,14,45–48. As such, rivers in these regions may also respond to these hydro-
climatic changes by transforming from through-going to more discontinuous river types. In southern Africa,
for instance, river morphology varies across strong hydroclimatic gradients, with through-going, maintaining
rivers more common in subhumid catchments, and through-going, declining and discontinuous, declining or
terminating rivers more common in semiarid and arid catchments21,22. Nevertheless, along many of these rivers,
varying degrees of bedrock (lithological, structural) control influence the river’s ‘degrees of freedom’; for example,
resistant rocks such as dolerite or quartzite commonly crop out in river bed and banks and influence the depth of
incision or extent of lateral migration that can occur in response to hydroclimatic drivers [e.g.49,50]. In drylands
where there is an even higher degree of tectonic and bedrock influence on rivers (e.g. the Mediterranean and
parts of the Middle East), 21st century hydroclimatic drivers will still exert an influence on river response, but
may be muted or locally overridden by the non-climatic factors. For example, in steep, confined river valleys,
dryland rivers may respond to hydroclimatic changes mainly by altering the magnitude of cut-and-fill cycles
rather than by undergoing any pronounced changes in channel continuity while periodic, tectonically-induced
Scientific Reports | (2020) 10:6653 | https://doi.org/10.1038/s41598-020-63622-3 8www.nature.com/scientificreports/ www.nature.com/scientificreports
Figure 4. Non-parametric multidimensional scaling (nMDS) resemblance matrix visualising the level of
similarity between each river type based on key geomorphological and hydroclimatic variables (see Methods;
Table 2). Pairwise ANOSIM analysis shows that each river type is statistically different from one another
(p < 0.05; see Table 2 and Supplementary Table S1). Each point on the nMDS plot represents a different river
and points closer together are more similar to one another based on the measured variables, and points further
apart are more dissimilar. Annotations summarise the percentage of catchment area classed as humid for each
river type, and the envelopes of mean catchment AI values for each river type. See Fig. 1 for catchment labelling
conventions and Table 3 for a list of all rivers.
rockfalls or landslides may provide the main reach-scale, long-lasting disruptions to downstream flow and sed-
iment transfer19,51. In many regions globally, river regulation and flow abstraction can also impact on the flow
regime of dryland rivers6,43, although in most cases the effect would be similar to that expected under projected
future hydroclimatic change (i.e. reduced runoff and perhaps altered seasonality) and so will likely exacerbate or
compound the hydrological and geomorphological changes brought about by future hydroclimate change.
While our approach has been based around Australian dryland rivers with flow gauging records, this may not
be essential. Climate-hydrology-geomorphology relations established for gauged rivers could be used to make
predictions for nearby ungauged rivers in the same hydroclimatic region. In southeastern Australia, for example,
all the gauged Type 1 rivers that form part of our dataset (e.g. Kiewa, Mitta Mitta, Upper Murray and Ovens riv-
ers) are projected to become Type 2 rivers under future hydroclimatic change (Fig. 6). Modelling of future mean
catchment aridity index for other nearby rivers that are classified as Type 1 based on their geomorphology can be
undertaken even if they are ungauged, as the robust climate-hydrology-geomorphology relationships have been
established using data from the gauged rivers. Alternatively, indirect approaches to discharge estimation in dry-
land rivers52 could be used to generate supporting hydrological or hydraulic information to help establish modern
climate-hydrology-geomorphology relations across hydroclimatic gradients, as has been done successfully for
different dryland rivers worldwide (e.g.10,22,53). By applying ergodic reasoning, these relations could then be used
as the basis for predicting river response under altered hydroclimates.
In summary, beyond the continental Australian setting, our approach will need to be expanded to include
a wider diversity of dryland rivers (e.g. additional alluvial, bedrock, and mixed-bedrock alluvial types), and to
account for a fuller suite of climatic and non-climatic (e.g. lithological/structural, tectonic, anthropogenic) con-
trols on river response. Nevertheless, careful regional- or continental-scale application to a range of gauged and
ungauged dryland rivers may still provide the basis for making valuable insights into potential threshold river
responses to 21st century hydroclimatic changes.
Scientific Reports | (2020) 10:6653 | https://doi.org/10.1038/s41598-020-63622-3 9www.nature.com/scientificreports/ www.nature.com/scientificreports
Figure 5. Mean catchment Aridity Index (AI) plotted against various hydrologic parameters from river gauge
locations nearest to the end of bedrock confinement in each catchment (see Fig. 2 for gauge locations). Pearson’s
correlation coefficient (R) indicates the strength of the linear association between the variables (note that the
log-scale for A and C makes the regressions appear curved). The p-value (p) indicates the statistical significance
of the linear correlation between the variables. Lowercase purple letters indicate the results of a pairwise
ANOSIM; groups sharing the same letter are not significantly different. (A) mean annual runoff depth (mm
a−1); (B) mean annual peak runoff depth (mm a−1); (C) bankfull gross stream power (estimated using bankfull
discharge estimates from gauged cross sections and ratings tables). In this case, there are insufficient gauge
data to confidently estimate bankfull stream power for all rivers, meaning statistical analysis across river types
cannot be undertaken; (D) Coefficient of variation of annual flow (CVaf ).
Scientific Reports | (2020) 10:6653 | https://doi.org/10.1038/s41598-020-63622-3 10www.nature.com/scientificreports/ www.nature.com/scientificreports
Figure 6. Polar plot displaying the modern and projected mean catchment Aridity Index (AI) value for each
catchment (angle axis) and the projected magnitude of change in the mean catchment Aridity Index by 2070
RCP4.5 (radius axis; Δ AI by 2070). Dashed arrowed lines represent trajectories that connect the starting
(modern) and end (2070) points for individual rivers; rivers that end closest to the centre of the plot have the
largest projected Δ AI. Coloured segments represent the envelope of AI values assigned to each river type based
on modern catchment characteristics. Symbols represent the modern river type and those that are a different
colour to the underlying segment are rivers that are projected to change river type by 2070 according to RCP4.5.
See Fig. 2 for catchment labelling conventions and Table 3 for a list of all rivers.
Conclusion. Forecasting the responses of dryland rivers to climate-driven hydrological changes is critical
due to the importance of geomorphology for the range and quality of ecosystem services in these marginal envi-
ronments1. Dryland rivers sustain many unique and threatened ecosystems and help support the livelihoods of
approximately 2 billion people who live in the world’s drylands1,2. Given heightened concern over the likelihood
of a global average temperature rise of >1.5 °C by the end of the century54,55, major changes to hydroclimates and
river geomorphology are likely to occur within a few generations. Our approach to forecasting likely geomorpho-
logical changes in Australian dryland rivers has the potential to be applied to other gauged and ungauged dryland
rivers globally, including in regions where there is a wider diversity of river styles and additional controls that may
influence river response to hydroclimatic changes. As such, further development of our approach may provide a
key tool to identify thresholds of river response in otherwise poorly monitored systems, and may provide advance
warning of such changes to inform water resource development, adaptation, and other management strategies.
Scientific Reports | (2020) 10:6653 | https://doi.org/10.1038/s41598-020-63622-3 11www.nature.com/scientificreports/ www.nature.com/scientificreports
Methods
River types. Large river catchments in continental eastern and central Australia straddle different climate
zones from humid through to arid (Fig. 2). The rivers included in this study in some cases have humid upper
reaches, but all have drylands (subhumid through arid climates) consisting of between 10 and 100% of their
catchment areas. A framework was developed to categorise river types based on their geomorphological charac-
teristics. The rivers analysed were the Kiewa, Mitta Mitta, Ovens, Upper Murray, Broken, Campaspe, Goulburn,
Macintyre, Murrumbidgee, Avoca, Condamine-Balonne, Castlereagh, Gwydir, Lachlan, Loddon, Macquarie,
Namoi, Wimmera, Bulloo, Cooper Creek, Diamantina, Georgina, Paroo, Warrego, Allungra Creek, Finke, Hay,
Todd, and Woodforde. Although dryland river types fall along a continuum19,20, we use five geomorphological
characteristics to define five dryland river types (Fig. 1; Table 1; see also Supplementary Fig. S1). These geomor-
phological characteristics were derived using Google Earth satellite imagery and a 30 m Shuttle Radar Topography
Mission (SRTM) digital elevation model (DEM):
1. longitudinal continuity of channels (through-going, discontinuous);
2. nature of reduction in channel width downstream of the end of major bedrock confinement (maintaining,
declining, terminating);
3. dominant river planform (sinuous, non-sinuous);
4. dominant river pattern (single-thread (meandering, straight), multi-thread (anabranching, anastomosing,
distributary));
5. presence/absence of wetlands, and where present, type of wetlands (e.g. permanent, intermittent,
ephemeral).
Aridity and hydrology. Aridity has been expressed according to the Aridity Index (AI), defined as mean
annual precipitation (PPT) divided by potential mean annual evapotranspiration (PET56). AI data were sourced
from the datasets compiled by Trabucco and Zomer, (200957), available from the Consultative Group for
International Agriculture Research Consortium for Spatial Information (CGIAR-CSI) GeoPortal (http://www.
csi.cgiar.org). Hydrology data were sourced from the New South Wales Department of Primary Industries Office
of Water, the Victorian Department of Environment, Land, Water and Planning Water Measurement Information
System, the Queensland Government Water Monitoring Information Portal, and the Northern Territory Water
Resources Data and Information Centre. Gauges were chosen as near as possible to the end of bedrock confine-
ment on each river (i.e. usually in the transition from the upper to middle reaches) and each had at least 30 years
of continuous flow records, except for the Finke River and Allungra Creek gauges that had 13 and 16 years of flow
records, respectively (Table 3). It should also be noted that the Hay River does not have a suitable gauge (the only
gauges in the catchment are on small headwater creeks) and was not included in hydrological analysis, but was
included for catchment aridity analyses.
Hydrological variables were calculated from these flow records using standard methods. Mean annual run-
off depth was calculated by dividing mean annual discharge (megalitres; ML) by catchment area (km2). Mean
annual peak runoff depth was calculated by dividing mean annual peak discharge (ML) by catchment area (km2).
Coefficient of variation of annual flow (CVaf ) was calculated by dividing the standard deviation of mean annual
discharge by mean annual discharge. Mean floodplain slope was derived by calculating an average slope of the
alluvial plain downstream of each river’s emergence from bedrock confinement using a 30 m SRTM DEM. Gross
bankfull stream power is the product of bankfull discharge (m3 s−1), channel slope (m m−1), and the specific
weight of water-sediment mixture (given the low suspended loads of most Australian rivers, this was assumed
constant at 9800 N m-3). Gross bankfull stream power was calculated for the trunk channel at gauge locations
that provided a ratings table necessary to estimate bankfull discharge; these data were only available for 14 of the
29 rivers and so there were not enough data points from each of the river types for robust analysis of similarities
(ANOSIM) (see below and Fig. 5C). Channel slope data used for gross stream power estimation were calculated
by dividing the local floodplain slope – calculated using 3–5 km transects along the floodplain at each gauge loca-
tion using a 30 m SRTM DEM – by the channel sinuosity value measured over the same reach. The relationships
between aridity and specific hydrological variables (mean annual runoff depth [annual discharge normalised for
catchment area], mean annual peak runoff depth, and coefficient of variation of annual flow) were then analysed
using basic linear regressions.
Climate data and future climate projections. ArcMap v.10.2 software was used for catchment scale
analyses of AI, precipitation, and future climate model outputs. Gridded modern AI data were clipped to each
study subcatchment and the proportional aridity was calculated with exported cell counts of each unique AI value
in the sub-catchment (cells equivalent to ~1 km by ~1 km). Weighted mean catchment AI was also calculated
from this output.
To derive future precipitation and potential evapotranspiration, we used outputs from 16 downscaled global
climate models (GCMs) that were part of the Intergovernmental Panel on Climate Change’s (IPCC) Fifth
Coupled Model Intercomparison Project, (CMIP558). These models are BCC-CSM1–1, CCSM4, CNRM-CM5,
GFDL-CM3, GISS-E2-R, HadGEM2-AO, HadGEM2-CC, HadGEM2-ES, INMCM4, IPSL-CM5A-LR,
MIROC-ESM-CHEM, MIROC-ESM, MIROC5, MPI-ESM-LR, MRI-CGCM3, and NorESM1-M. The outputs
used were from model runs assuming Representative Concentration Pathway (RCP) 4.5. RCPs are named accord-
ing to the radiative forcing of greenhouse gases expected for 2100 depending on various scales of emissions
reductions (RCP2.6, 4.5, 6, 8.5)40. RCP4.5 is a relatively moderate future pathway in which emissions peak around
2040 and then decline with a radiative forcing of 4.5 W m−2 above pre-industrial values by 210040. RCP4.5 was
chosen to understand which dryland river catchments were most sensitive to even relatively moderate scenarios
of future climate change. Future aridity under RCP8.5 was also modelled to understand the difference between
Scientific Reports | (2020) 10:6653 | https://doi.org/10.1038/s41598-020-63622-3 12www.nature.com/scientificreports/ www.nature.com/scientificreports
scenarios (see Supplementary Fig. S3). Due to projected increases in rainfall over parts of northern and central
Australia under RCP8.5 relative to RCP4.5, projected net change in AI over the Australian continent is very
similar for both RCP4.5 and RCP8.5 (Supplementary Fig. S3). Future projected precipitation is an output from
the CMIP5 models. Mean annual temperature (Tmean) and annual temperature range (Trange) were the outputs
used in conjunction with solar radiation (RA) to model future potential evapotranspiration (PET) using the
Hargreaves-Samani equation (Eq. (1)59–61):
PET = 0.0023RA(Tmean + 17.8)Trange0.5 (1)
The Hargreaves-Samani equation was used to calculate the modern AI used in this study and therefore was 57
also used for the future projections. It has been shown to perform nearly as well as the common FAO Penman
method but requires substantially less parametrisation with more readily available data62. Future projected pre-
cipitation was then divided by modelled future potential evapotranspiration to provide future AI values across
Australia.
Multivariate analysis of variables associated with river types. The five river types were compared
across various hydrological and geomorphological variables using a multivariate approach in Primer v663. Data
for 11 variables were collected (Table 2; Figs. 3 and 4), but bankfull gross stream power was not included in statis-
tical tests as data were not available to calculate gross stream power for all gauges. One-way Analysis of Variance
(ANOVA) tests were also performed to determine the difference between river types for each variable. Tukey’s
honest significant difference (HSD) test determined which groups were significantly different from one another
at p < 0.05. Results are presented in Fig. 3. Analysis of similarities (ANOSIM) and pairwise tests among all com-
binations of river types were performed on a resemblance matrix based on Euclidean distances, and based on
9999 permutations. R statistics were calculated for each pairwise comparison, where R values closer to 1 indicate
greater differences between two compared groups63. Significance was determined where p < 0.05 (Supplementary
Table S1). Based on the resemblance matrix, a non-parametric multidimensional scaling (nMDS) plot was con-
structed to visually represent the similarity among rivers; each point on the figure represents a single river, with
points closer together being more similar to one another on the measured variables, and points farther apart
being more dissimilar (Fig. 4).
Data availability
Modern aridity index data are publicly available from Trabucco and Zomer’s (2009) Global Aridity Index (Global-
Aridity) and Global Potential Evapo-Transpiration (Global-PET) Geospatial Database. Published online, available
from the CGIAR-CSI GeoPortal at: http://www.csi.cgiar.org. Downscaled global climate model projection data
are publicly available from WorldClim – Global Climate data at: www.worldclim.org/. The data that support the
findings of this paper are available from the corresponding author upon reasonable request.
Received: 18 November 2019; Accepted: 24 March 2020;
Published: xx xx xxxx
References
1. Millennium Ecosystem Assessment (MEA) Ecosystems and Human Well-being: Wetlands and Water (World Resources Institute:
Washington, DC) (2005).
2. Van der Esch, S. et al. Exploring future changes in land use and land condition and the impacts on food, water, climate change and
biodiversity: Scenarios for the Global Land Outlook. (PBL Netherlands Environmental Assessment Agency, The Hague) (2017).
3. Costanza, R. et al. The value of the world’s ecosystem services and natural capital. Nature 387, 253–260 (1998).
4. Pekel, J.-F., Cottam, A., Gorelick, N. & Belward, A. S. High-resolution mapping of global surface water and its long-term changes.
Nature 540, 418–422 (2016).
5. Rodell, M. et al. Emerging trends in global freshwater availability. Nature 557, 651–659 (2018).
6. Best, J. Anthropogenic stresses on the world’s big rivers. Nat Geosci 12, 7–21 (2019).
7. Schumm, S. A. The Fluvial System. (Wiley, New York) (1977).
8. Nanson, G. C. & Tooth, S. Arid-zone rivers as indicators of climate change, In: Singhvi, A.K. and Derbyshire, E. (Eds.),
Paleoenvironmental Reconstructions in Arid Lands, 175–216 (Balkema, Rotterdam) (1999).
9. Woodward, J. C., Williams, M. A. J., Garzanti, E., Macklin, M. G. & Marriner, N. From source to sink: Exploring the Quaternary
history of the Nile. Quat Sci Rev 130, 3–8 (2015).
10. Hesse, P. P. et al. Palaeohydrology of lowland rivers in the Murray-Darling Basin, Australia. Quat Sci Rev 200, 85–105 (2018).
11. Lane, S. N. 21st century climate change: Where has all the geomorphology gone? Earth Surf Process Landf 38, 106–110 (2013).
12. Fryirs, K. A. River sensitivity: A lost foundation concept in fluvial geomorphology. Earth Surf Process Landf 42, 55–70 (2017).
13. Nijssen, B., O’Donnell, G. M., Hamlet, A. F. & Lettenmaier, D. P. Hydrologic sensitivity of global rivers to climate change. Clim
Change 50, 143–175 (2001).
14. Milly, P. C. D., Dunne, K. A. & Vecchia, A. V. Global pattern of trends in streamflow and water availability in a changing climate.
Nature 438, 347–350 (2005).
15. De Wit, M. & Stankiewicz, J. Changes in surface water supply across Africa with predicted climate change. Science 311, 1917–1921
(2006).
16. Brierley, G. J. & Fryirs, K. A. Eds. River Futures: An Integrative Scientific Approach to River Repair (Island Press, Washington DC)
(2008).
17. Tooth, S. Floodouts in central Australia. In: Miller, A. J. & Gupta, A. (Eds.), Varieties of Fluvial Form, 219–247 (Wiley, Chichester)
(1999).
18. Tooth, S. & McCarthy, T. S. Wetlands in drylands: geomorphological and sedimentological characteristics, with emphasis on
examples from southern Africa. Prog Phys Geogr 31, 3–41 (2007).
19. Tooth, S. & Nanson, G. C. Distinctiveness and diversity of arid zone river systems. In: Thomas, D. S. G. (Ed.), 3rd edn. Arid Zone
Geomorphology: Process, Form and Change in Drylands, 269–300 (John Wiley & Sons: Chichester) (2011).
20. Tooth, S. Dryland Fluvial Environments: Assessing Distinctiveness and Diversity from a Global Perspective, In Shroder, J. and Wohl,
E. E. (Eds.) Treatise on Geomorphology 9, 612–644 (Academic Press) (2013).
Scientific Reports | (2020) 10:6653 | https://doi.org/10.1038/s41598-020-63622-3 13www.nature.com/scientificreports/ www.nature.com/scientificreports
21. Grenfell, S. E., Grenfell, M. C., Rowntree, K. M. & Ellery, W. N. Fluvial connectivity and climate: A comparison of channel pattern
and process in two climatically contrasting fluvial sedimentary systems in South Africa. Geomorphology 205, 142–154 (2014).
22. Larkin, Z. T., Ralph, T. J., Tooth, S. & McCarthy, T. S. The interplay between extrinsic and intrinsic controls in determining floodplain
wetland characteristics in the South African drylands. Earth Surf Process Landf 42, 1092–1109 (2017).
23. Ralph, T. J. & Hesse, P. P. Downstream hydrogeomorphic changes along the Macquarie River, southeastern Australia, leading to
channel breakdown and floodplain wetlands. Geomorphology 118, 48–64 (2010).
24. Peel, M. C., Finlayson, B. L. & McMahon, T. A. Updated world map of the Köppen-Geiger climate classification. Hydrol Earth Syst
Sci Discuss 4, 439–473 (2007).
25. McMahon, T. A., Finlayson, B. L., Haines, A. & Srikanthan, R. Runoff variability: a global perspective. IASH-AISH 168, 3–11 (1987).
26. McMahon, T. A., Peel, M. C., Vogel, R. M. & Pegram, G. G. S. Global streamflows - Part 3: Country and climate zone characteristics.
J Hydrol 347, 272–291 (2007).
27. McMahon, T. A., Murphy, R. E., Peel, M. C., Costelloe, J. F. & Chiew, F. H. S. Understanding the surface hydrology of the Lake Eyre
Basin: Part 2-Streamflow. J Arid Environ 72, 1869–1886 (2008).
28. Verdon, D. C., Wyatt, A. M., Kiem, A. S. & Franks, S. W. Multidecadal variability of rainfall and streamflow: Eastern Australia. Water
Resour Res 40, 1–8 (2004).
29. Peel, M. C., McMahon, T. A. & Finlayson, B. L. Continental differences in the variability of annual runoff-update and reassessment.
J Hydrol 295, 185–197 (2004).
30. Brierley, G.J., Fryirs, K.A. Geomorphology and River Management: Applications of the River Styles Framework (Blackwell
Publications: Oxford) (2005).
31. Chang, H. H. Minimum stream power and river channel patterns. J Hydrol 41, 303–327 (1979).
32. Yochum, S. E., Sholtes, J. S., Scott, J. A. & Bledsoe, B. P. Stream power framework for predicting geomorphic change: The 2013
Colorado Front Range flood. Geomorphology 292, 178–192 (2017).
33. Knighton, A. D. & Nanson, G. C. Flow transmission along an arid zone anastomosing river, Cooper Creek, Australia. Hydrol Process
8(2), 137–154 (1994).
34. Pietsch, T. J. & Nanson, G. C. Bankfull hydraulic geometry; the role of in-channel vegetation and downstream declining discharges
in the anabranching and distributary channels of the Gwydir distributive fluvial system, southeastern Australia. Geomorphology 129,
152–165 (2011).
35. Slingerland, R. & Smith, N. D. River avulsions and their deposits. Annu Rev Earth Planet Sci 32, 257–285 (2004).
36. Hughes, L. Climate change and Australia: Trends, projections and impacts. Austral Ecol 28, 423–443 (2003).
37. Chiew, F. H. S. & McMahon, T. A. Modelling the impacts of climate change on Australian streamflow. Hydrol Process 16, 1235–1245
(2002).
38. Chiew, F. H. S., Young, W. J., Cai, W. & Teng, J. Current drought and future hydroclimate projections in southeast Australia and
implications for water resources management. Stoch Environ Res Risk Assess 25, 601–612 (2011).
39. CSIRO and Bureau of Meteorology (BoM). Projections: Atmosphere and the land, Climate Change in Australia. Information for
Australia’s Natural Resource Management Regions: Technical Report (2015).
40. van Vuuren et al. The representative concentration pathways: An overview. Clim Change 109, 5–31 (2011).
41. Shi, G., Ribbe, J., Cai, W., Cowan, T. & Nin, E. An interpretation of Australian rainfall projections. Geophys Res Lett 35, 1–6 (2008).
42. Harris, R. M. B. et al. Biological responses to the press and pulse of climate trends and extreme events. Nat Clim Chang 8, 579–587
(2018).
43. Kingsford, R. T. Ecological impacts of dams, water diversions and river management on floodplain wetlands in Australia. Austral
Ecol 25, 109–127 (2000).
44. Connell, D. & Grafton, R. Q. Water reform in the Murray-Darling Basin. Water Resour Res 47, 1–9 (2011).
45. Nash, L. L. & Gleick, P. H. Sensitivity of streamflow in the Colorado Basin to climatic changes. J Hydrol 125, 221–241 (1991).
46. Shongwe, M. E. et al. Projected Changes in Mean and Extreme Precipitation in Africa under Global Warming. Part I: Southern
Africa. J Clim 22, 3819–3837 (2009).
47. Schewe, J. et al. Multimodel assessment of water scarcity under climate change. Proc Natl Acad Sci USA 111, 3245–3250 (2013).
48. Seager, R. et al. Projections of declining surface-water availability for the southwestern United States. Nat Clim Chang 3, 482–486
(2013).
49. Tooth, S. et al. Controls on the genesis, sedimentary architecture, and preservation potential of dryland alluvial successions in stable
continental interiors: insights from the incising Modder River, South Africa. J Sediment Res 83, 541–561 (2013).
50. Keen-Zebert, A. et al. Late Quaternary floodplain reworking and the preservation of alluvial sedimentary archives in unconfined
and confined river valleys in the eastern interior of South Africa. Geomorphology 185, 54–66 (2013).
51. Macklin, M. G., Tooth, S., Brewer, P. A., Noble, P. L. & Duller, G. A. T. Holocene flooding and river development in a Mediterranean
steepland catchment: the Anapodaris Gorge, south central Crete, Greece. In: J.C., Woodward, P.A., Brewer, M.G., Macklin and S.,
Tooth (Eds), Advances in Palaeoflood Science, Special Issue of Glob Planet Change, 70, 35–52 (2010).
52. Bjerklie, D. M. Estimating the bankfull velocity and discharge for rivers using remotely sensed river morphology information. J
Hydrol 341, 144–155 (2007).
53. Li, J., Tooth, S. & Yao, G. Cascades of sub-decadal, channel-floodplain changes in low-gradient, non-vegetated reaches near a
dryland river terminus: Salar de Uyuni, Bolivia. Earth Surf Process Landf 44, 490–506 (2019).
54. IPCC. Climate Change 2014: Synthesis Report. Contribution of Working Groups I, II and III to the Fifth Assessment Report of the
Intergovernmental Panel on Climate Change, IPCC (2014).
55. Hoegh-Guldberg, O. et al. Impacts of 1.5 °C global warming on natural and human systems. In: Masson-Delmotte, V. et al. (Eds.)
Global warming of 1.5 °C. An IPCC Special Report on the impacts of global warming of 1.5 °C above pre-industrial levels and related
global greenhouse gas emission pathways, in the context of strengthening the global response to the threat of climate change,
sustainable development, and efforts to eradicate poverty (2018).
56. United Nations Environment Programme (UNEP) World Atlas of Desertification (Edward Arnold: London) pp 15–45 (1992).
57. Trabucco, A. & Zomer, R. J. Global Aridity Index (Global-Aridity) and Global Potential Evapo-Transpiration (Global-PET)
Geospatial Database., CGIAR Consortium for Spatial Information. Available from the CGIAR-CSI GeoPortal at: http://www.csi.
cgiar.org (2009).
58. Hijmans, R. J., Cameron, S. E., Parra, J. L., Jones, G. & Jarvis, A. Very high resolution interpolated climate surfaces for global land
areas. Int J Climatol 25, 1965–1978 (2005).
59. Hargreaves, G. H. & Samani, Z. A. Estimating potential evapotranspiration. J Irrig Drain Div – Am Soc Civ Eng 108, 225–230 (1982).
60. Hargreaves, G. H. & Samani, Z. A. Reference crop evapotranspiration from temperature. Appl Eng Agric 1, 96–99 (1985).
61. Hargreaves, G. H. & Allen, R. G. History and evaluation of Hargreaves evapotranspiration equation. J Irrig Drain Div – Am Soc Civ
Eng 129, 53–63 (2003).
62. Heydari, M. M., Tajamoli, A., Ghoreishi, S. H., Darbe-Esfahani, M. K. & Gilasi, H. Evaluation and calibration of Blaney–Criddle
equation for estimating reference evapotranspiration in semiarid and arid regions. Environ Earth Sci 74, 4053–4063 (2015).
63. Clarke, K. R. & Gorley, R. N. PRIMER v6: User Manual/Tutorial. PRIMER-E: Plymouth (2006).
Scientific Reports | (2020) 10:6653 | https://doi.org/10.1038/s41598-020-63622-3 14You can also read


